

Abstract
BACKGROUND
Single-nucleotide polymorphisms (SNPs) in genes encoding cardiac ion channels and nitric oxide synthase 1 adaptor protein (NOS1AP) are associated with electrocardiographic (ECG) QT-interval duration, but the association of these SNPs with new prognostically important ECG measures of ventricular repolarization has been unknown.
OBJECTIVE
Our aim was to examine the relationship of SNPs to ECG T-wave peak to T-wave end (TPE) interval and T-wave morphology parameters.
METHODS
We studied 5,890 adults attending the Health 2000 Study, a Finnish epidemiological survey. TPE interval and four T-wave morphology parameters were measured from digital 12-lead ECGs and related to those seven SNPs showing a phenotypic effect on QT-interval duration in the Health 2000 Study population.
RESULTS
In multivariable analyses, the KCNH2 K897T minor allele was associated with a 1.2 ms TPE-interval shortening (P=.00005) and the KCNH2 intronic rs3807375 minor allele was associated with a 0.8 ms TPE-interval prolongation (P=.001), whereas the KCNE1 D85N variant had no TPE-interval effect (P=.20). NOS1AP minor alleles (rs2880058, rs4657139, rs10918594, rs10494366) were associated with shorter TPE interval (effects from 0.5 to 0.8 ms, P from .032 to .002), which resulted from their stronger effects on QTpeak than QTend interval. None of the SNPs showed a consistent association with T-wave morphology parameters.
CONCLUSIONS
KCNH2 K897T and rs3807375 as well as the four studied NOS1AP variants have modest effects on ECG TPE interval but are not related to T-wave morphology measures. The previously observed prognostic value of T-wave morphology parameters is unlikely to be based on these SNPs.
Keywords: electrocardiography, epidemiology, genetics, genetic polymorphism, ion channels, nitric oxide synthase, repolarization, T wave
Introduction
In monogenic repolarization-based arrhythmia disorders, such as long QT syndrome (LQTS), mutations in myocardial ion channel genes generate the arrhythmogenic substrate.1 Common ion channel gene variants, such as single-nucleotide polymorphisms (SNPs), are associated with modest alterations in electrocardiographic (ECG) QT-interval duration, and may further modify repolarization-related arrhythmia vulnerability.1-6 Additionally, genetic variation in nitric oxide synthase 1 adaptor protein gene (NOS1AP) is associated with QT interval6,7 and, more importantly, has been associated with increased risk for clinical symptoms and more severe disease in a LQTS type 1 founder population8 as well as with increased risk for sudden cardiac death in a sample from the general population.9 The risk for sudden cardiac death was, however, independent of QT-interval duration in multivariable analyses,9 raising the possibility that other ECG repolarization measures than QT interval might better reveal the increased risk.
The T wave is generated by myocardial voltage gradients during the repolarization phase of cardiomyocyte action potentials.10,11 QT interval is a measure of repolarization duration, but may not reveal other changes during the repolarization process. T-wave peak to T-wave end (TPE) interval measures terminal repolarization, and has experimentally been linked to arrhythmogenic repolarization dispersion in the myocardium.10,12,13 In addition, several new ECG repolarization measures characterizing T-wave morphology have been introduced.14,15 In fact, in the general population T-wave morphology parameters seem to be more useful than other ECG repolarization measures in mortality risk assessment.16 In the present study we examined the association of several SNPs with ECG TPE interval and T-wave morphology parameters to characterize more comprehensively the effects of the defined SNPs on ventricular repolarization in the large population-based Health 2000 Study.
Method
Study population
The study population was derived from an epidemiological survey, the Health 2000 Study, conducted in Finland in 2000–2001. The study population, drawn from the Finnish Population Information System, was a two-stage stratified cluster sample of 8,028 Finnish adults aged ≥30 years. The Health 2000 Study included a home interview, a comprehensive health examination with questionnaires, measurements (e.g. height, weight, blood pressure, ECG), and a physician’s clinical examination. Definitions of hypertension, coronary heart disease, myocardial infarction, and diabetes in the current study have been published elsewhere.16 Heart failure classification in the survey was based on hospital diagnoses, health interview, physician’s clinical examination, and medication use for heart failure. Probable and certain diagnoses of heart failure were included in the current study. The Health 2000 Study protocol is available online,17 and was approved by the Epidemiology Ethics Committee of the Helsinki and Uusimaa Hospital Region. All participants gave their signed informed consent.
Deoxyribonucleic acid samples were collected from 6,334 Health 2000 Study subjects, and ECGs were available from 6,292 subjects. From the present study, we excluded subjects carrying one of four Finnish LQTS founder mutations (n=27), ECGs with Minnesota coding showing Wolff-Parkinson-White syndrome (n=1), paced rhythm (n=4), atrial fibrillation (n=93), atrial flutter (n=1), complete left bundle branch block (n=56), complete right bundle branch block (n=61), or low-quality ECG (n=8). We also excluded subjects who used medication with possible effect on QT-interval duration (n=151). These were the drugs listed in the first category (“Drugs with Risk of Torsades de Pointes”) on the website www.qtdrugs.org (accessed November 2007) and digoxin, which shortens QT interval. The present study thus included 5,890 individuals.
Electrocardiographic measurements
A digital standard 12-lead ECG was recorded with a Marquette MAC 5000 electrocardiograph (GE Marquette Medical Systems, Milwaukee, Wisconsin, USA). All leads were simultaneous recordings, and a median QRS-T complex was used for analyses.18 We used QT Guard software (GE Marquette Medical Systems) to measure heart rate and principal component analysis (PCA) ratio, and custom-made software for all other measurements. The reproducibility of our repolarization measurements was good and has been previously published.18 Left ventricular hypertrophy was considered to be present if Sokolow-Lyon voltage >3.5 mV or Cornell voltage-duration product >244 mV×ms, or both criteria were observed.
TPE intervals
We performed TPE-interval measurements based on a previously described and validated algorithm.19,20 The software calculated TPE interval from T-wave peak to T-wave end in each lead. A single observer (K.P.) reviewed measurements on-screen in a blinded fashion. Leads with low signal-to-noise ratio or flat T waves were excluded from TPE-interval analyses, and the mean number of TPE-interval measurements per ECG was 10.3±1.7. We used the maximum TPE interval from precordial leads for analyses. TPE intervals were not corrected for heart rate.21 SNP effects on QTpeak and QTend intervals were analyzed from the lead with the maximum precordial TPE interval. QT intervals were heart rate-adjusted with the nomogram method as previously described.16
T-wave morphology parameters
The automatic calculation of T-wave morphology parameters has been published in detail previously.16 In brief, the PCA ratio was calculated as the ratio of the second to first eigenvalues of the spatial T-wave vector with an increase in PCA ratio indicating more complex T-wave morphology.14 After singular value decomposition of eight independent ECG leads (I, II, V1-V6), T-wave morphology dispersion (TMD) measures the average angle between T-wave reconstruction vector pairs, with higher values indicating increasing differences in T-wave morphology among the leads.16 Total cosine R-to-T (TCRT) measures the deviation between potential directions during depolarization and repolarization phases, with lower values indicating increasing angle between R- and T-wave vectors.16 The vector magnitude of the fourth to eighth eigenvalues gives the absolute T-wave residuum (TWR). Higher TWR values indicate increasing non-dipolar ECG signal content and are expected to represent higher degree of ventricular repolarization heterogeneity,15 whereas PCA ratio, TCRT, and TMD reflect changes in dipolar ECG signal content. In the present study, T-wave morphology parameters showed nonsignificant or only very weak correlations to heart rate (absolute r values from 0.005 to 0.08).
Genetic analyses
We have recently published the relationship between several LQTS gene and NOS1AP SNPs to QTend interval.6 In the present study, we included KCNH2 rs1805123 (K897T) and rs3807375, KCNE1 rs1805128 (D85N), and four NOS1AP SNPs (rs2880058, rs4657139, rs10918594, rs10494366), based on their shortening or prolonging effects on QTend interval in the Health 2000 Study population.6 For rs1805123, genotyping was performed using a TaqMan SNP Genotyping Assay (Applied Biosystems, Foster City, California, USA) and for all other SNPs using Sequenom MALDI-TOF mass spectrometry (MassArray Compact Analyzer, Sequenom Inc, San Diego, California, USA).
Statistics
Analyses were performed with SPSS software 15.0 (SPSS Inc., Chicago, Illinois, USA). The prevalence estimates of genotypes were derived from the weighted study population as described previously.17 We analyzed the association between ECG repolarization parameters and clinical variables including: gender, age, current smoking status, body mass index, heart rate, systolic blood pressure, diastolic blood pressure, hypertension, coronary heart disease, previous myocardial infarction, heart failure, diabetes mellitus, ECG left ventricular hypertrophy status, and Cornell voltage-duration product (as a continuous variable). Of these clinical variables, gender, age, systolic blood pressure, coronary heart disease, previous myocardial infarction, and Cornell voltage-duration product were selected as covariates for regression analyses (P<.001 for the association with repolarization parameters for most of the variables). Using a stepwise linear regression model, each repolarization parameter was adjusted for the clinical covariates. The output residuals were saved and used as the dependent variable in further linear regression analyses with the genotypes as the independent variable. In additive genetic models, we transformed each genotype to a continuous variable that corresponded to the number of minor alleles (0, 1, 2). In genotypic genetic models, two degrees of freedom test was used, and the heterozygote and minor homozygote genotypes were converted to two dichotomous variables and the major homozygote genotype was the reference. The results are shown for additive genetic models. Appropriateness of the additive model was confirmed by evaluating the genotype-specific means for residuals of repolarization parameters. Non-normal variable distributions of PCA ratio, TMD, TCRT, and TWR were normalized in regression analyses. The PCA ratio, TMD, and TWR were normalized with natural-logarithmic transformation. The TCRT was normalized with the Blom method22 because its distribution was not normalized with the logarithmic transformation. All SNPs were tested for Hardy-Weinberg equilibrium with the Chisquare test. For all tests, two-tailed P<.05 was considered significant.
Results
Genotyping call rates ranged from 97.6% to 99.9% and all SNPs were in Hardy-Weinberg equilibrium (P>.01). Table 1 shows the clinical characteristics and mean values of ECG repolarization measures in the study population.
Table 1.
Clinical characteristics and electrocardiographic repolarization measures (n=5,890)
| Men (%) | 45.2 |
| Age (years) | 52.1±14.3 |
| Current smoking (%) | 21.9 |
| Body mass index (kg/m2) | 26.9±4.7 |
| Heart rate (beats/minute) | 63.3±10.7 |
| Systolic blood pressure (mmHg) | 134.2±21.0 |
| Diastolic blood pressure (mmHg) | 81.9±11.0 |
| Hypertension (%) | 46.8 |
| Coronary heart disease (%) | 6.6 |
| Previous myocardial infarction (%) | 2.3 |
| Heart failure (%) | 1.1 |
| Diabetes mellitus (%) | 5.6 |
| ECG left ventricular hypertrophy (%) | 17.8 |
| TPE interval* (ms) | 83.4±12.5 |
| PCA ratio (%) | 15.5±8.4 |
| TMD (°) | 14.6±13.4 |
| TCRT (unitless) | 0.36±0.52 |
| TWR (technical units) | 16,810±22,749 |
Maximum precordial TPE interval. Values are mean±SD for continuous variables and percentages for categoric variables. PCA=principal component analysis, TCRT=total cosine R-to-T, TMD=T-wave morphology dispersion, TPE=T-wave peak to T-wave end interval, TWR=T-wave residuum.
Relationship of SNPs to TPE interval
Table 2 shows TPE intervals by genotype in the study population and SNP effects on TPE interval from multivariable regression analyses. A 1.2 ms TPE-interval shortening was observed per KCNH2 K897T minor allele and a 0.8 ms prolongation per KCNH2 rs3807375 minor allele. KCNE1 D85N did not have an effect on TPE interval. For the four NOS1AP SNPs with strong linkage disequilibrium (r2 between 0.77 and 0.97), minor alleles were associated with TPE-interval shortening, with the effect varying from 0.5 to 0.8 ms. The results were unchanged when TPE interval was measured from a single lead (V3) (data not shown). The results were also tested with the genotypic genetic models, and this did not change the results. Analyses after excluding a total of 1,355 subjects with coronary heart disease, previous myocardial infarction, heart failure, or ECG left ventricular hypertrophy did not alter the results (data not shown).
Table 2.
TPE intervals by genotype and effect of SNPs on electrocardiographic TPE interval
| Allele* and amino acid changes |
Major homozygotes |
Heterozygotes |
Minor homozygotes |
Minor allele effect§ |
||||||
|---|---|---|---|---|---|---|---|---|---|---|
| Gene | SNP | TPE† (ms) | % | TPE† (ms) | % | TPE† (ms) | % | ΔTPE† (ms) | P | |
| KCNH2 | rs1805123 | A→C, K897T | 83.8 | 67.9 | 82.5 | 28.8 | 81.6 | 3.3 | −1.2 | .00005 |
| rs3807375 | G→A | 82.7 | 32.4 | 83.7 | 49.4 | 84.1 | 18.2 | +0.8 | .001 | |
| KCNE1 | rs1805128 | G→A, D85N | 83.4 | 97.3 | 81.7 | 2.6 | 83.9 | 0.1 | −1.3 | .20 |
| NOS1AP | rs2880058 | A→G | 83.7 | 42.3 | 83.4 | 45.5 | 82.1 | 12.2 | −0.6 | .01 |
| rs4657139 | T→A | 83.6 | 41.3 | 83.5 | 46.1 | 82.1 | 12.6 | −0.5 | .03 | |
| rs10918594 | C→G | 83.9 | 43.8 | 83.3 | 44.0 | 82.0 | 12.3 | −0.8 | .002 | |
| rs10494366 | T→G | 83.7 | 41.6 | 83.4 | 45.7 | 82.3 | 12.7 | −0.6 | .02 | |
Values are mean.
Major→minor allele.
Maximum precordial TPE interval. Percentages refer to prevalence estimates.
Additive genetic model with the values representing differences from major homozygotes per one minor allele (adjustment for gender, age, systolic blood pressure, coronary heart disease, previous myocardial infarction, Cornell voltage-duration product). SNP=single nucleotide polymorphism, TPE=T-wave peak to T-wave end interval.
SNP effects on QTpeak and QTend intervals were analyzed for the SNPs that were significantly associated with TPE interval. Figure 1 shows that both KCNH2 K897T and NOS1AP rs10918594 were associated with prolongation of QTend interval. For NOS1AP, however, the association with QTpeak interval was stronger than with QTend interval, resulting in the shortening of TPE interval. The results remained the same when QT intervals were analyzed from a single lead (V3) and from the lead with the maximum precordial QTend interval (data not shown).
Figure 1.
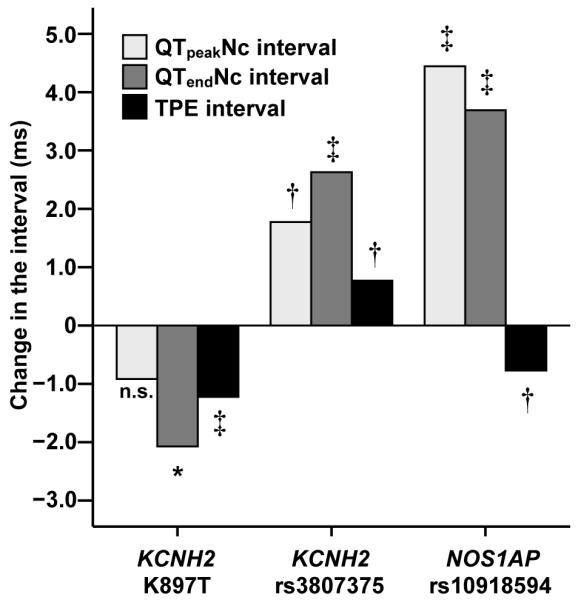
Effect of KCNH2 K897T, KCNH2 rs3807375, and NOS1AP 10918594 SNPs on electrocardiographic QTpeak, QTend, and TPE interval. Values are differences from major homozygotes per one minor allele. Because of similarity of the results for all other NOS1AP SNPs, results are shown only for rs10918594. *P<.05, †P<.01, ‡P<.0001. Nc=nomogram-corrected for heart rate, n.s.=nonsignificant, SNP=single-nucleotide polymorphism, TPE=T-wave peak to T-wave end.
Relationship of SNPs to T-wave morphology parameters
We studied the relationship of SNPs to T-wave morphology parameters (PCA ratio, TMD, TCRT, TWR). The multivariable regression analyses showed that KCNH2 K897T minor allele was associated with a 0.03 unit decrease in normalized TWR (P=.04), NOS1AP rs4657139 minor allele was associated with a 0.04 unit decrease in normalized TCRT (P=.04), and that NOS1AP rs10494366 minor allele was associated with a 0.04 unit decrease in normalized TCRT (P=.03). For all other SNPs, the results were nonsignificant (both allelic and genotypic genetic models tested, data not shown). When the three SNPs with significant results were tested with genotypic models, only the relationship between KCNH2 K897T and TWR was statistically significant (P=.04). Analyses after excluding study subjects with coronary heart disease, previous myocardial infarction, heart failure, or ECG left ventricular hypertrophy showed that KCNH2 K897T minor allele was associated with a 0.04 unit decrease in normalized TMD (P=.02) and normalized TWR (P=.02). These associations remained significant also in genotypic models, but for all other SNPs, the results were nonsignificant (data not shown).
Discussion
Main findings
Our results show that KCNH2 K897T minor allele C is associated with shorter ECG TPE interval and KCNH2 intronic rs3807375 minor allele A is associated with longer ECG TPE interval. These are consistent with their associations with shorter and longer QTend intervals, respectively, as previously shown.6 NOS1AP minor alleles are associated with shorter TPE interval. This is opposite in direction to the effects of the same alleles on the duration of QTend interval and seems to be resulted from their stronger effect on QTpeak than QTend interval. None of the SNPs showed a consistent association with T-wave morphology parameters.
ECG TPE interval and T-wave morphology measures
Dispersion of ventricular repolarization predisposes to repolarization-related arrhythmogenesis.10 In experimental studies using myocardial wedge preparations, TPE interval has been show to correlate with transmural dispersion of repolarization.10,11,23 In other studies, TPE interval has been shown to be a measure of global dispersion of repolarization.12,13 In an ambulatory ECG study of LQTS type 1 and 2 patients, TPE interval behaviour paralleled experimental and computer-simulated findings in transmural dispersion of repolarization in loss-of-function of the slow (IKs) and rapid (IKr) components of the delayed rectifier current, which cause LQTS type 1 and 2, respectively.24
T-wave morphology parameters, characterizing the three-dimensional morphology of the T wave, have been shown to provide prognostic information on survival in the general population.14-16 Of note, in the Health 2000 Study population T-wave morphology parameters, but not heart-rate corrected QTend interval, contained independent prognostic information on mortality, and the prognostic value was specifically related to cardiovascular mortality.16
Several SNPs of KCNE1, KCNH2, and NOS1AP have been shown to be associated with longer QTend interval.1 The recently observed increased risk of sudden death with NOS1AP variants in a general population sample was independent of the duration of QTend interval, however.9 Thus, we explored the effects of these variants on TPE interval and T-wave morphology parameters.
KCNH2 K897T and rs3807375, and repolarization measures
Experimental studies have shown that the KCNH2 K897T substitution has multiple effects on cellular electrophysiology,2,25-27 suggesting that the net effect of these changes on ECG ventricular repolarisation is difficult to predict. Our present study shows that K897T variant shortens ECG TPE interval but does not consistently alter T-wave morphology parameters. In the Health 2000 Study population analyzing the age-, gender- and heart rate-adjusted QT interval, we have shown this polymorphism to shorten QTend interval by 2.6 ms per minor allele.6 Also in several other studies, this polymorphism has been shown to slightly shorten QTend interval,2-5 but conflicting results do exist.28 In previous reports, the impact of the minor K897T allele has been suggested to be both protective and harmful, but sample sizes in these reports have been small.29,30
There are no experimental studies characterizing the functional properties of KCNH2 intronic SNP rs3807375 on myocardial repolarization. We observed that the minor allele of this variant prolongs TPE interval, but it has no effects on T-wave morphology parameters. Previously this variant has been reported to prolong QTend interval,5 a finding also observed in the Health 2000 Study population showing a 1.6 ms prolonging effect per minor allele.6 Since the prolongation of QTend and TPE interval on the resting ECG is a typical feature in LQTS type 2 caused by reduced IKr current,23,24,31 our ECG findings suggest that rs3807375 might reduce the repolarization reserve.
KCNE1 D85N and repolarization measures
KCNE1 D85N polymorphism causes variation in minK, which is the regulatory subunit of the IKs channel.32 Experimental studies have suggested that the minor D85N allele reduces IKs current.33 The 85N allele may thus predispose to acquired LQTS and modify the clinical expression of congenital LQTS.34 In experimental LQTS type 1 models, IKs block prolongs action potential duration homogeneously, and therefore does not increase transmural dispersion at rest, but does so in conjunction with β-adrenergic stimulation.31
In a previous analysis from the Health 2000 Study population, we observed a substantial 10.5 ms prolongation in QTend interval per each KCNE1 D85N minor allele.6 The present results show that, despite the marked prolongation of QTend interval observed in our prior study,6 this variant has no effect on ECG TPE interval or T-wave morphology measures. In ambulatory ECG recordings among LQTS type 1 patients, TPE interval increased significantly only at high heart rates.24 Thus, our findings in resting ECGs showing D85N variant to prolong QTend but not TPE interval are consistent with reduced IKs current. It remains to be studied, whether the D85N polymorphism is associated with a prolongation of TPE interval during physical exercise.
NOS1AP variants and repolarization measures
In experimental studies, overexpression of CAPON, the product of NOS1AP gene, results in up-regulation of NOS1-NO signalling pathways, leading to reduced ICa,L and enhanced IKr currents, and to shortened action potential.35 Postulating that genetic variants in NOS1AP lead to lower CAPON levels, increased ICa,L and decreased IKr currents with prolonged action potential are expected.8 In previous population studies, including our recent study in the Health 2000 Study population, the minor alleles of several NOS1AP variants have been shown to be associated with longer QTend interval.6,7
Recently, Crotti et al. reported that NOS1AP variants rs4657139 (one of the SNPs included in the present study) and rs16847548 were associated with a greater prolongation QTend interval, increased risk for symptoms, and greater probability for cardiac arrest and sudden death in a South African LQTS type 1 founder population.8 They suggested that increased ICa,L current might be associated with arrhythmogenic consequences in LQTS type 1 patients.8 On the other hand, Kao et al. reported that NOS1AP variants rs16847548 and rs12567209 were associated with sudden cardiac death in a large cohort of United States white adults, but the effect was independent of the duration of QTend interval in multivariable analyses, however.9 These authors suggested that either QTend interval might not be a sufficient measure of ventricular repolarization or the prognostic value of NOS1AP variants might be mediated by other mechanisms than repolarization.9
In the present study, the examined minor alleles of the NOS1AP variants were associated with shorter TPE interval but had no effects on T-wave morphology parameters. With a supposed decreased IKr current, TPE-interval shortening was an unexpected finding. Interestingly, our results suggest a stronger prolonging effect of NOS1AP SNPs on QTpeak than QTend interval. Whether the shortening of TPE interval is mediated by increased ICa,L or by some other mechanism remains to be studied.
Limitations
Our results may not be applicable to populations from different genetic backgrounds or to other races, and replication of the observed associations in another, independent cohort is warranted. The association between the SNPs and TPE interval appears weak and thus its clinical significance remains to be studied. Our analyses included four strongly correlating NOS1AP SNPs, and some other SNPs not examined in the present study may have different repolarization effects and prognostic value.9 The exact electrophysiological basis of T-wave morphology parameters is currently unknown.
Conclusion
Our results show that KCNH2 K897T minor allele is associated with shortening, and KCNH2 rs3807375 minor allele is associated with prolongation of ECG TPE interval. KCNE1 D85N has no effect on TPE interval. The studied NOS1AP minor alleles prolong more QTpeak than QTend interval, with the net effect being shorter TPE interval. None of the studied SNPs showed consistent association with ECG T-wave morphology parameters, suggesting that these polymorphisms do not mediate the observed prognostic value of T-wave morphology parameters in the Health 2000 Study. The studied repolarization parameters seem not to clarify the association between NOS1AP variants and sudden cardiac death.
Acknowledgements
None.
Funding: Dr Porthan was supported by grants from the Aarne and Aili Turunen Foundation, the Aarne Koskelo Foundation, the Finnish Foundation for Cardiovascular Research, the Finnish Medical Foundation, the Maud Kuistila Memorial Foundation, the Orion-Farmos Research Foundation, the Paavo and Eila Salonen Foundation. Dr Marjamaa was supported by grant from the Emil Aaltonen Foundation. Dr Viitasalo and Dr Oikarinen were supported by grants from the Finnish Foundation for Cardiovascular Research. Dr Newton-Cheh was supported by K23 HL080025, the Doris Duke Charitable Foundation, the Burroughs Wellcome Fund. Dr Salomaa was supported by the Academy of Finland (grant number 129494) and the Sigrid Juselius Foundation. Dr Kontula was supported by grants from the Sigrid Juselius Foundation and the Academy of Finland.
List of manuscript abbreviations
- ECG
electrocardiographic
- LQTS
long QT syndrome
- NOS1AP
nitric oxide synthase 1 adaptor protein gene
- PCA
principal component analysis
- SNP
single-nucleotide polymorphism
- TCRT
total cosine R-to-T
- TMD
T-wave morphology dispersion
- TPE
T-wave peak to T-wave end
- TWR
T-wave residuum
Footnotes
Publisher's Disclaimer: This is a PDF file of an unedited manuscript that has been accepted for publication. As a service to our customers we are providing this early version of the manuscript. The manuscript will undergo copyediting, typesetting, and review of the resulting proof before it is published in its final citable form. Please note that during the production process errors may be discovered which could affect the content, and all legal disclaimers that apply to the journal pertain.
Conflict of interest:
None.
The institution where work was performed: Helsinki University Central Hospital, Haartmaninkatu 4, P.O. Box 340, 00029 HUS, Finland
References
- 1.Noseworthy PA, Newton-Cheh C. Genetic determinants of sudden cardiac death. Circulation. 2008;118:1854–1863. doi: 10.1161/CIRCULATIONAHA.108.783654. [DOI] [PubMed] [Google Scholar]
- 2.Bezzina CR, Verkerk AO, Busjahn A, et al. A common polymorphism in KCNH2 (HERG) hastens cardiac repolarization. Cardiovasc Res. 2003;59:27–36. doi: 10.1016/s0008-6363(03)00342-0. [DOI] [PubMed] [Google Scholar]
- 3.Gouas L, Nicaud V, Berthet M, et al. Association of KCNQ1, KCNE1, KCNH2 and SCN5A polymorphisms with QTc interval length in a healthy population. Eur J Hum Genet. 2005;13:1213–1222. doi: 10.1038/sj.ejhg.5201489. [DOI] [PubMed] [Google Scholar]
- 4.Pfeufer A, Jalilzadeh S, Perz S, et al. Common variants in myocardial ion channel genes modify the QT interval in the general population: results from the KORA study. Circ Res. 2005;96:693–701. doi: 10.1161/01.RES.0000161077.53751.e6. [DOI] [PubMed] [Google Scholar]
- 5.Newton-Cheh C, Guo CY, Larson MG, et al. Common genetic variation in KCNH2 is associated with QT interval duration: the Framingham Heart Study. Circulation. 2007;116:1128–1136. doi: 10.1161/CIRCULATIONAHA.107.710780. [DOI] [PubMed] [Google Scholar]
- 6.Marjamaa A, Newton-Cheh C, Porthan K, et al. Common candidate gene variants are associated with QT interval duration in the general population. J Int Med. 2009;265:448–458. doi: 10.1111/j.1365-2796.2008.02026.x. [DOI] [PMC free article] [PubMed] [Google Scholar]
- 7.Arking DE, Pfeufer A, Post W, et al. A common genetic variant in the NOS1 regulator NOS1AP modulates cardiac repolarization. Nat Genet. 2006;38:644–651. doi: 10.1038/ng1790. [DOI] [PubMed] [Google Scholar]
- 8.Crotti L, Monti MC, Insolia R, et al. NOS1AP Is a Genetic Modifier of the Long-QT Syndrome. Circulation. 2009;120:1657–1663. doi: 10.1161/CIRCULATIONAHA.109.879643. [DOI] [PMC free article] [PubMed] [Google Scholar]
- 9.Kao WH, Arking DE, Post W, et al. Genetic variations in nitric oxide synthase 1 adaptor protein are associated with sudden cardiac death in US white community-based populations. Circulation. 2009;119:940–951. doi: 10.1161/CIRCULATIONAHA.108.791723. [DOI] [PMC free article] [PubMed] [Google Scholar]
- 10.Yan G-X, Antzelevitch C. Cellular basis for the normal T wave and the electrocardiographic manifestations of the long-QT syndrome. Circulation. 1998;98:1928–1936. doi: 10.1161/01.cir.98.18.1928. [DOI] [PubMed] [Google Scholar]
- 11.Antzelevitch C. Cellular basis for the repolarization waves of the ECG. Ann N Y Acad Sci. 2006;1080:268–281. doi: 10.1196/annals.1380.021. [DOI] [PMC free article] [PubMed] [Google Scholar]
- 12.Zabel M, Portnoy S, Franz MR. Electrocardiographic indexes of dispersion of ventricular repolarization: an isolated heart validation study. J Am Coll Cardiol. 1995;25:746–752. doi: 10.1016/0735-1097(94)00446-W. [DOI] [PubMed] [Google Scholar]
- 13.Opthof T, Coronel R, Wilms-Schopman FJ, et al. Dispersion of repolarization in canine ventricle and the electrocardiographic T wave: Tp-e interval does not reflect transmural dispersion. Heart Rhythm. 2007;4:341–348. doi: 10.1016/j.hrthm.2006.11.022. [DOI] [PubMed] [Google Scholar]
- 14.Okin PM, Devereux RB, Fabsitz RR, Lee ET, Galloway JM, Howard BV. Principal component analysis of the T wave and prediction of cardiovascular mortality in American Indians: the Strong Heart Study. Circulation. 2002;105:714–719. doi: 10.1161/hc0602.103585. [DOI] [PubMed] [Google Scholar]
- 15.Zabel M, Malik M, Hnatkova K, et al. Analysis of T-wave morphology from the 12-lead electrocardiogram for prediction of long-term prognosis in male US veterans. Circulation. 2002;105:1066–1070. doi: 10.1161/hc0902.104598. [DOI] [PubMed] [Google Scholar]
- 16.Porthan K, Viitasalo M, Jula A, et al. Predictive value of electrocardiographic QT interval and T-wave morphology parameters for all-cause and cardiovascular mortality in a general population sample. Heart Rhythm. 2009;6:1202–1208. doi: 10.1016/j.hrthm.2009.05.006. [DOI] [PubMed] [Google Scholar]
- 17.Aromaa A, Koskinen S, editors. Health and functional capacity in Finland. Baseline results of the Health 2000 Health Examination Survey. Publications of the National Public Health Institute; Helsinki: [Accessed September 18, 2008]. Publication Number B12/2004. Available at http://www.terveys2000.fi/julkaisut/baseline.pdf. [Google Scholar]
- 18.Porthan K, Virolainen J, Hiltunen TP, et al. Relationship of electrocardiographic repolarization measures to echocardiographic left ventricular mass in men with hypertension. J Hypertens. 2007;25:1951–1957. doi: 10.1097/HJH.0b013e328263088b. [DOI] [PubMed] [Google Scholar]
- 19.Oikarinen L, Paavola M, Montonen J, et al. Magnetocardiographic QT interval dispersion in postmyocardial infarction patients with sustained ventricular tachycardia: validation of automated QT measurements. Pacing Clin Electrophysiol. 1998;21:1934–1942. doi: 10.1111/j.1540-8159.1998.tb00013.x. [DOI] [PubMed] [Google Scholar]
- 20.Hekkala A-M, Väänänen H, Swan H, Oikarinen L, Viitasalo M, Toivonen L. Reproducibility of computerized measurements of QT interval from multiple leads at rest and during exercise. Ann Noninvasive Electrocardiol. 2006;11:318–326. doi: 10.1111/j.1542-474X.2006.00124.x. [DOI] [PMC free article] [PubMed] [Google Scholar]
- 21.Andersen MP, Xue JQ, Graff C, Kanters JK, Toft E, Struijk JJ. New descriptors of T-wave morphology are independent of heart rate. J Electrocardiol. 2008;41:557–561. doi: 10.1016/j.jelectrocard.2008.07.021. [DOI] [PubMed] [Google Scholar]
- 22.Blom G. Statistical estimates and transformed beta variables. John Wiley & Sons, Inc.; New York: 1958. [Google Scholar]
- 23.Gima K, Rudy Y. Ionic current basis of electrocardiographic waveforms: a model study. Circ Res. 2002;90:889–896. doi: 10.1161/01.res.0000016960.61087.86. [DOI] [PMC free article] [PubMed] [Google Scholar]
- 24.Viitasalo M, Oikarinen L, Swan H, et al. Ambulatory electrocardiographic evidence of transmural dispersion of repolarization in patients with long-QT syndrome type 1 and 2. Circulation. 2002;106:2473–2478. doi: 10.1161/01.cir.0000036369.16112.7d. [DOI] [PubMed] [Google Scholar]
- 25.Anson BD, Ackerman MJ, Tester DJ, et al. Molecular and functional characterization of common polymorphism in HERG (KCNH2) potassium channels. Am J Physiol Heart Circ Physiol. 2004;286:H2434–H2441. doi: 10.1152/ajpheart.00891.2003. [DOI] [PubMed] [Google Scholar]
- 26.Paavonen KJ, Chapman H, Laitinen PJ, et al. Functional characterization of the common amino acid 897 polymorphism of the cardiac potassium channel KCNH2 (HERG) Cardiovasc Res. 2003;59:603–611. doi: 10.1016/s0008-6363(03)00458-9. [DOI] [PubMed] [Google Scholar]
- 27.Gentile S, Martin N, Scappini E, Williams J, Erxleben C, Armstron DL. The human ERG1 channel polymorphism, K897T, creates a phosphorylation site that inhibits channel activity. Proc Natl Acad Sci U S A. 2008;105:14704–14708. doi: 10.1073/pnas.0802250105. [DOI] [PMC free article] [PubMed] [Google Scholar]
- 28.Pietilä E, Fodstad H, Niskasaari E, et al. Association between HERG K897T polymorphism and QT interval in middle-aged Finnish women. J Am Coll Cardiol. 2002;40:511–514. doi: 10.1016/s0735-1097(02)01979-4. [DOI] [PubMed] [Google Scholar]
- 29.Crotti L, Lundquist AL, Insolia R, et al. KCNH2-K897T is a genetic modifier of latent congenital long-QT syndrome. Circulation. 2005;112:1251–1258. doi: 10.1161/CIRCULATIONAHA.105.549071. [DOI] [PubMed] [Google Scholar]
- 30.Zhang X, Chen S, Zhang L, et al. Protective effect of KCNH2 single nucleotide polymorphism K897T in LQTS families and identification of novel KCNQ1 and KCNH2 mutations. BMC Med Genet. 2008;9:87. doi: 10.1186/1471-2350-9-87. [DOI] [PMC free article] [PubMed] [Google Scholar]
- 31.Shimizu W, Antzelevitch C. Cellular basis for the ECG features of the LQT1 form of the long QT-syndrome: effect of β-adrenergic agonists and antagonists and sodium channel blockers on transmural dispersion of repolarization and torsades de pointes. Circulation. 1998;98:2314–2322. doi: 10.1161/01.cir.98.21.2314. [DOI] [PubMed] [Google Scholar]
- 32.Lehmann-Horn F, Jurkat-Rott K. Voltage-Gated Ion Channels and Hereditary Disease. Physiol Rev. 1999;79:1317–1372. doi: 10.1152/physrev.1999.79.4.1317. [DOI] [PubMed] [Google Scholar]
- 33.Westenskow P, Splawski I, Timothy KW, Keating MT, Sanguinetti MC. Compound mutations: a common cause of severe long-QT syndrome. Circulation. 2004;15:1834–1841. doi: 10.1161/01.CIR.0000125524.34234.13. [DOI] [PubMed] [Google Scholar]
- 34.Nishio Y, Makiyama T, Itoh H, et al. D85N, a KCNE1 polymorphism, is a disease-causing gene variant in long QT syndrome. J Am Coll Cardiol. 2009;54:812–819. doi: 10.1016/j.jacc.2009.06.005. [DOI] [PubMed] [Google Scholar]
- 35.Chang KC, Barth AS, Sasano T, et al. CAPON modulates cardiac repolarization via neuronal nitric oxide synthase signaling in the heart. Proc Natl Acad Sci U S A. 2008;105:4477–4482. doi: 10.1073/pnas.0709118105. [DOI] [PMC free article] [PubMed] [Google Scholar]