

Abstract
Neurons transport and position mitochondria using a combination of saltatory, bidirectional movements and stationary docking. Axonal mitochondria move along microtubules (MTs) using kinesin and dynein motors, but actin and myosin also play a poorly defined role in their traffic. To ascertain this role, we have used RNA interference (RNAi) to deplete specific myosin motors in cultured Drosophila neurons and quantified the effects on mitochondrial motility. We produced a fly strain expressing the Caenorhabditis elegans RNA transporter SID-1 in neurons to increase the efficacy of RNAi in primary cultures. These neurons exhibited significantly increased RNAi-mediated knockdown of gene expression compared with neurons not expressing this transporter. Using this system, we observed a significant increase in mitochondrial transport during myosin V depletion. Mitochondrial mean velocity and duty cycle were augmented in both anterograde and retrograde directions, and the fraction of mitochondrial flux contained in long runs almost doubled for anterograde movement. Myosin VI depletion increased the same movement parameters but was selective for retrograde movement, whereas myosin II depletion produced no phenotype. An additional effect of myosin V depletion was an increase in mitochondrial length. These data indicate that myosin V and VI play related but distinct roles in regulating MT-based mitochondrial movement: they oppose, rather than complement, protracted MT-based movements and perhaps facilitate organelle docking.
Introduction
Neurons transport mitochondria over long distances within the axon and also distribute them non-uniformly among sites with heightened need for ATP production or Ca2+ homeostasis, such as growth cones, axon branches, synapses, or nodes of Ranvier (Berthold et al., 1993; Morris and Hollenbeck, 1993; Bristow et al., 2002; Ruthel and Hollenbeck, 2003; Miller and Sheetz, 2004; Hollenbeck and Saxton, 2005; Zhang et al., 2010). This is accomplished by a rather baroque, inefficient-looking process of saltatory, bidirectional mitochondrial movement with frequent stops and, for some fraction of axonal mitochondria, persistent docking in specific regions (Hollenbeck and Saxton, 2005). It is clear that much of the total mitochondrial flux in axons is generated by microtubule (MT)-based movements using the anterograde motor protein kinesin (Nangaku et al., 1994; Hurd and Saxton, 1996; Hollenbeck and Saxton, 2005; Pilling et al., 2006) and the retrograde motor protein dynein (Pilling et al., 2006). However, actin and myosin also play a role that has remained uncertain (Morris and Hollenbeck, 1995; Ligon and Steward, 2000; Hollenbeck and Saxton, 2005). One possible role for actomyosin-based transport is that it augments or supplements MT-based movement, returning mitochondria that have transiently detached back to their MT tracks, or moving them through small regions of the axon that are MT poor (Langford, 1995). This has also been suggested for other organelles in non-neuronal cells, such as endosomes or secretory vesicles that move along paths, including both the MT-rich cytoplasm and actin-rich cell cortex (Ross et al., 2008). However, an alternative possibility is that the myosin-based movement of mitochondria actually contributes to their distribution by opposing protracted MT-based movements, as has been shown for melanosomes in Xenopus pigment cells (Rodionov et al., 1991; Rogers et al., 1999; Tuma and Gelfand, 1999; Gross et al., 2002). This would not only help explain the complex, saltatory pattern of mitochondrial motility and their non-uniform distribution but also the augmentation of mitochondrial movements in the absence of actin (Morris and Hollenbeck, 1995) and the requirement for actin in the induced halting and docking of mitochondria along the axon (Chada and Hollenbeck, 2003, 2004).
To test this hypothesis, we selectively depleted specific myosins in Drosophila primary neurons using RNA interference (RNAi) and quantified the effects on the axonal transport of mitochondria. We observed an increase in movements in both directions after myosin V depletion and of retrograde movements after myosin VI depletion, consistent in its details with a myosin–MT motor competition that interrupts mitochondrial movement. We also observed a significant increase in mitochondrial length after myosin V depletion, suggesting that it may play a role in the mitochondrial fission–fusion equilibrium.
Materials and Methods
Drosophila stocks.
The strain w1118; +; D42–GAL4, UAS–mito-GFP (“mito-GFP”) expressing mitochondrially targeted green fluorescent protein (GFP) in motor neurons (Pilling et al., 2006) was a gift from W. M. Saxton (University of California, Santa Cruz, Santa Cruz, CA). For creating the UAS–sid-1 line, a sid-1::Flag cDNA fragment was excised from PAcPL–sid-1::Flag (donated by C. Hunter, Harvard University, Cambridge, MA) using BamHI and was ligated to the BglII site of pUAST. This generated an 11.2 kb plasmid (pUASt map information kindly provided by Andrea Brand, Gurdon Institute, Cambridge, UK). This plasmid (supplemental Fig. S3, available at www.jneurosci.org as supplemental material) was then transformed into a w1118 strain and mapped to the second chromosome. The UAS–sid-1 chromosome was crossed into the w1118, +, D42–GAL4, UAS–mito-GFP background using dominantly marked balancer chromosomes to obtain the working fly strain: w1118; UAS–SID-1; D42–GAL4, UAS–mito-GFP.
Embryo collection.
Flies were maintained in population cages at 25°C for collecting embryos. Before egg collection, they were placed on a 12 h light/dark cycle and fed with yeast paste streaked on apple agar plates. Flies were allowed to lay eggs for 2 h, and the embryos were allowed to develop for 4–6 h at 25°C so as to obtain early gastrulae embryos.
Cell culture.
Cultured cells were prepared by dissociating early gastrula embryos (4–6 h after laying) using established methods (Salvaterra et al., 1987). This generates a cell population that differentiates into many cell types, including neurons. Motor neurons were identified by their morphology and their mitochondrial GFP expression. Cells were grown in Shields and Sang medium supplemented with 20% FBS, 100 U/ml penicillin and streptomycin (Invitrogen), and 200 ng/ml insulin. One day after plating, serum-containing medium was removed and replaced with serum-free medium. Cultures were then exposed to specific double-stranded RNA (dsRNA) at 40 μg/ml in serum-free medium for 2.5 h, followed by addition of serum-containing medium and incubation at 25°C for 2–3 d. These cells were then used for microscopy and/or Western blotting. For giant neuron preparation, cultured cells were prepared as described above and exposed to cytochalasin B at 2 μg/ml for 24 h (Pilling et al., 2006).
RNA interference.
Myosin dsRNA was generated using methods and primer sequences described previously (Goshima and Vale, 2003; Rogers et al., 2003). Briefly, mRNA was isolated from fly larvae using Qiagen RNeasy kit and reverse transcribed using specific primers for myosins II, V, or VI (Qiagen One-Step RT PCR kit). The resulting cDNA was PCR amplified, and this product was used as a template for in vitro transcription (Ambion MEGAscript T7 kit). Contaminating DNA was removed by DNAase treatment, and dsRNA obtained was purified (Qiagen RNeasy kit) and its concentration determined before use. Off-target control dsRNA was prepared using the pC4β-gal vector and primer sequences: 5′-TAATACGACTCACTATAGGCACCCGAGTGTGATCATCTG-3′; and 5′-TAATACGACTCACTATAGGATGACGGAACAGGTATTCGC-3′. For GFP dsRNA, pcDNA3.1/mito-GFP was used as template and primer sequences: 5′-TAATACGACTCACTATAGGTCAGTGGAGAGGGTGAAGGT-3′; and 5′-TAATACGACTCACTATAGGGGCAGATTGTGTGGACAGG-3′
Fluorescence microscopy and movement analysis.
Cells were observed on a Nikon TE300 inverted microscope equipped with MicroMax cooled CCD camera (Princeton Instruments). Fluorescent images were gathered at 1 s intervals for 200–250 s. Movement of mitochondria was tracked and quantified using NIH ImageJ software. Isolated neurons that were clearly separated from neuronal clusters were imaged, and every in-focus mitochondrion within an axon was tracked to eliminate selection bias. To avoid stage drift and positioning errors that can lead to small erroneous measurements and distort actual transport values by repetition, we excluded all displacement values of <0.1 μm between consecutive frames (Pilling et al., 2006). Intervals with average velocities between 0.10 and −0.10 μm/s for at least three consecutive frames were designated as pauses. Uninterrupted motion between pauses and/or direction reversal was considered a “run.” The sum total of all run lengths in a particular category gave an estimate of flux. The percentage of time spent moving in a particular direction gave duty cycle values.
Western blotting.
Lysates were prepared for SDS-PAGE from cultured cells obtained from normal and SID-1-expressing flies that had been treated with GFP dsRNA. Samples were loaded in serial dilutions to yield immunoblotting signals in the linear range, and adjusted volumes were subsequently used for quantification. Primary antibodies used were rabbit anti-GFP (1:1000; Clontech), mouse monoclonal anti-ELAV (embryonic lethal, abnormal vision) (1:500; Developmental Studies Hybridoma Bank), rabbit anti-non-muscle myosin II (1:1000), rabbit anti-myosin V (1:1000), or mouse monoclonal anti-myosin VI (1:400) antibodies. Myosin antibodies used were generated against Drosophila proteins and are well characterized and specific (Kiehart and Feghali, 1986; Miller et al., 1989; Li et al., 2007). Blots were then probed with Alexa Fluor 680 goat anti-rabbit (Invitrogen) and IRDye 800 CW-conjugated goat anti-mouse antibody (Rockland). Bands were visualized using an Odyssey Infrared Imaging System (Li-Cor Biosciences), and band intensities and areas were measured using MetaMorph software. The total intensity was quantified for GFP and ELAV bands, and ratio of GFP/ELAV was used to obtain normalized values for each treatment.
Immunofluorescent staining.
For immunostaining of the endogenous myosins, cells were fixed with 4% paraformaldehyde in PBS, permeabilized with 0.1% Triton X-100 for 10 min, and blocked in 5% BSA/PBS/0.1% Tween 20. Primary antibodies used were rabbit anti-myosin V (1:500), rabbit anti-non-muscle myosin II (1:500), or mouse monoclonal anti-myosin VI antibodies (1:30), and secondary antibody used were Alexa Fluor 680 goat anti-rabbit and Alexa Fluor 680 goat anti-mouse. To obtain values for background subtraction, the primary antibody was omitted. Staining was visualized using epifluorescent illumination with FITC and Texas Red filter sets.
Mitochondrial fluorescence intensity and length measurements.
Quantitative imaging was done using MetaMorph software. Images were thresholded, the integrated morphometry analysis function was used to measure fluorescence intensities for largest possible area of each axon, and the values obtained were divided by area and given as arbitrary fluorescent units per square micrometer. Noncellular background fluorescence values were subtracted from axonal fluorescence. Mitochondrial lengths were measured using the region measurement function in MetaMorph. Multiple measurements of a single mitochondrion were made over the course of 250 frames and averaged.
Results
SID-1 expression enhances dsRNA knockdown in primary neuronal cultures
RNAi using dsRNA is a remarkably effective tool for suppressing specific gene expression in Drosophila cells (Goshima and Vale, 2003; Rogers et al., 2003; Sharma and Nirenberg, 2007). However, neurons are generally thought to be less amenable to RNAi than other cell types. The Caenorhabditis elegans sid-1 gene encodes an RNA transporter protein found at the plasma membrane. Drosophila do not have a sid-1 ortholog, and endocytic pathways are their only known means of dsRNA uptake. Thus, to increase the uptake of dsRNA into Drosophila neurons for our experiments, we generated a fly strain expressing a C. elegans UAS–sid-1 cDNA transgene in the genetic background of the mitochondrial marker line D42–Gal,UAS–mito-GFP (Pilling et al., 2006) to yield the strain: w1118; UAS–sid-1; D42–GAL4, UAS–mito-GFP, referred to here as D42: mito-GFP, SID-1.
We tested the efficacy of this system by knocking down GFP expression with specific dsRNA in primary neurons derived from mito-GFP fly lines with or without the sid-1 gene and assessing the degree of GFP depletion using quantitative fluorescence measurements (Fig. 1A–G). Consistent with other primary cell responses to dsRNA, treatment with GFP dsRNA led to a reduction in protein expression of ∼50% in neurons from mito-GFP flies. However, neurons from the mito-GFP/SID-1 line responded to the same dsRNA treatment with an 80% reduction in GFP expression. These results were confirmed by immunoblotting, using the ratio of signal intensity for anti-GFP to that of an anti-ELAV to normalize for the neuronal content of mixed primary cultures (Fig. 1H). Thus, expression of the sid-1 transgene leads to a substantial improvement in RNAi effects, suggesting that this is a strategy with significant implications for other dsRNA studies in primary cultures. We used the D42: mito-GFP, SID-1 strain for all experiments described below.
Figure 1.

SID-1 incorporation improves the efficiency of dsRNA knockdown. GFP expression was knocked down using specific dsRNA in primary neurons prepared from mito-GFP fly lines with and without expression of SID-1. A, C, and E show mitochondrial GFP fluorescence in axons, whereas in B, D, and F, Mitotracker Red staining shows the location of mitochondria regardless of GFP levels. Compared with controls (A, B), neurons treated with GFP dsRNA showed diminished GFP fluorescence (C, D), and this effect was clearly enhanced in SID-1/mito-GFP lines (E, F). Fluorescence quantification shows that SID-1 expression increases the RNAi-mediated inhibition of GFP expression from 50% knockdown in neurons without SID-1 to 80% knockdown with SID-1 (G) (p < 0.05, two-tailed t test). This was confirmed by Western blotting (H). Data were compiled from at least 30 neurons for each treatment, and experiments were repeated three times. Scale bar, 10 μm.
Myosin motor protein expression and knockdown
The identities of the myosin motors involved in actin-based axonal transport of mitochondria have not been determined, but, of Drosophila's 13 myosin genes, myosins V and VI are the likeliest candidates. The processive motor myosin V seems most likely to be involved, because it has not only been shown to associate with a variety of organelles in neurons (Prekeris and Terrian, 1997; Bridgman, 1999; Miller and Sheetz, 2000) but also participates in the transport and distribution of melanosomes (Wu et al., 1998; Rogers et al., 1999; Gross et al., 2002) and secretory granules (Rudolf et al., 2003; Desnos et al., 2007). Furthermore, myosin V is also known to support movement in vitro at rates similar to axonal transport of mitochondria on actin filaments (Morris and Hollenbeck, 1995; Wolenski et al., 1995). In addition, a class V myosin (Myo2) has been shown to play a direct role in mitochondrial transport and inheritance in budding yeast (Altmann et al., 2008). Myosin VI has been shown to transport cytoplasmic particles in Drosophila embryos (Mermall et al., 1994) and also plays a role in trafficking uncoated vesicles during clathrin-mediated endocytosis (Buss et al., 2001). Myosin II has been reported to decorate the cytoplasmic surface of axoplasmic organelles via immunogold electron microscopy (DeGiorgis et al., 2002), implicating it as yet another candidate organelle motor.
Preliminary studies in our laboratory have shown >80% colocalization between a GFP-tagged myosin V tail and axonal mitochondria in cultured vertebrate neurons (supplemental Fig. S1, available at www.jneurosci.org as supplemental material). In Drosophila motor neurons, myosin II, V, and VI immunostaining revealed a punctate pattern throughout the cell and partially colocalized with mitochondria. We observed that 82% mitochondria showed myosin II staining, 85% showed myosin V staining, and 74% showed myosin VI staining (supplemental Fig. S2, available at www.jneurosci.org as supplemental material). We treated neurons from Drosophila embryos with specific myosin dsRNA (see Materials and Methods) and cultured them for 3–4 d before observation; this protocol was optimized using the dsRNA knockdown of GFP, an abundantly expressed transgene. We confirmed the decrease of motor protein levels by immunocytochemistry using specific antibodies. Myosin V dsRNA treatment led to a ∼75% reduction in anti-myosin V immunostaining compared with cells treated with β-galactosidase (β-gal) dsRNA as an off-target control. For myosin II and VI, a >60% decrease in immunostaining compared with controls was seen (Fig. 2A,B). To test the specificity of myosin knockdown, neurons treated with myosin II dsRNA were immunostained for myosins V and VI. Average fluorescence intensities obtained were very similar to those obtained for off-target controls, showing that the knockdown was specific (Fig. 2B). Similarly, for myosin V and myosin VI dsRNA-treated cells, decreased fluorescence intensities were only seen for targeted myosins (data not shown). Western blots confirmed the sensitivity and specificity of myosin protein knockdown after dsRNA treatment (Fig. 2C). Blotting with anti myosin II, V, and VI antibodies revealed that exposure to specific dsRNA lead to robust protein knockdown. Myosin V depletion was only seen when cultures had been treated with myosin V dsRNA and not with either myosin II or myosin VI dsRNA treatment. Similarly for myosin VI, depletion was only seen when neurons were treated with specific dsRNA and not during exposure to either myosin II or V dsRNA.
Figure 2.
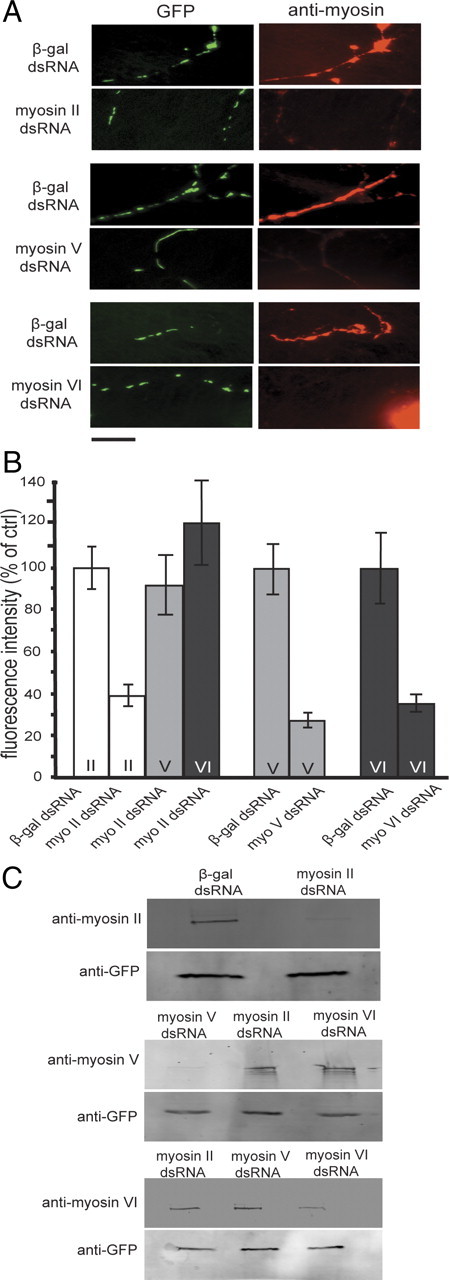
Myosin knockdown with dsRNA. A, B, Myosins II, V, and VI were knocked down using specific dsRNAs, neurons were fixed and stained with specific myosin antibodies (A), and average fluorescence intensities were determined (B). Identical exposures are shown here for all cells; hence, images of control cells appear overexposed for myosin immunostain. Depletion of myosin V lead to an ∼75% reduction in specific myosin V immunostaining compared with control cells treated with β-gal dsRNA (p < 0.01, two-tailed t test). Myosin II and VI knockdowns produced a decrease in specific immunostaining of >60% compared with controls (p < 0.01 and p < 0.05, respectively). Neurons treated with myosin II dsRNA were also immunostained for myosins V and VI. Fluorescence intensities obtained in these heterologous knockdowns were similar to those obtained for respective controls (B), showing that the dsRNA effect was specific to each myosin type. These data were compiled from at least 20 neurons for each treatment, and experiments were repeated twice. Scale bar, 10 μm. C shows myosin knockdown by immunoblotting. Myosins II, V, and VI were knocked down using corresponding dsRNAs, and lysates were prepared from these cultured cells and blotted with specific myosin antibodies. Reduction in protein levels of myosins II, V, and VI were seen only when cells had been treated with corresponding dsRNA. Protein levels remained unchanged during heterologous knockdowns i.e., myosin V depletion was only seen when cultures had been treated with myosin V dsRNA and not during myosin II and VI dsRNA treatments. Neuronal content for these mixed cultures was normalized using GFP immunoreactivity.
Myosin motor protein knockdown increases mitochondrial transport
To test the roles of myosins in mitochondrial movement, we performed detailed quantification of organelle transport in the axons of dsRNA-treated primary neurons. Myosin V depletion in neurons produced an obvious transport phenotype: an increase in mitochondrial transport. More mitochondria displayed movement than in controls, and the frequency of protracted movements was increased (Fig. 3A–C) (supplemental Videos 1–3, available at www.jneurosci.org as supplemental material). A significant enhancement in average mitochondrial run length was seen in both directions during myosin V knockdown but only in the retrograde direction during myosin VI knockdown (Fig. 3D). Myosin V and VI knockdowns also produced an increased frequency of longer runs compared with controls. The range of mitochondrial run lengths observed was very broad (0.3–20 μm, 3545 runs measured), and, although shorter runs far outnumbered longer ones, the longer runs constituted a large fraction of the total mitochondrial flux in these axons. Thus, we compared the fraction of total movement (or flux) contained in these runs under the different knockdown treatments. We found that myosin V knockdown doubled the fraction of total anterograde movement found in the longer run class (>1 μm) from 28 to 57%. For retrograde movement, a modest increase (from 40 to 50%) was also seen (Fig. 3E). Knockdown of myosin VI also led to an increase in the fraction of total retrograde movement in longer runs (Fig. 3E), whereas no effect was seen on anterograde movement.
Figure 3.

Myosin depletion increases specific parameters of axonal mitochondrial transport. A–C, Neuronal cultures were treated with dsRNA to knockdown (KD) expression of specific myosins, and mitochondrial motility was tracked and quantified. Patterns of movement versus time for 10 mitochondria each from a randomly selected control cell treated with β-gal dsRNA (A) and cells treated with myosin V dsRNA (B) or myosin VI dsRNA (C) are shown. The x-axis represents time elapsed, and the y-axis represents distance traveled by each mitochondrion from its position in the first frame. Positive distances reflect anterograde movement, and negative distances reflect retrograde movement. An increase in total organelle motility is seen in both anterograde and retrograde directions for myosin V knockdowns, whereas only retrograde movement shows an increase after myosin VI knockdown. D, Quantification of mitochondrial transport parameters shows that, in myosin V knockdown cells, there is an increase in mean run length and velocity in both directions, although these increases are restricted to the retrograde direction for myosin VI knockdown. Means ± SE are shown. E, Myosin V knockdown doubled the fraction of total anterograde movement/flux found in the longer run class (>1 μm) from 28 to 57% (p < 0.001, χ2 test). For myosin VI knockdown, anterograde transport was very similar to controls, but modest increases in the fraction of retrograde movement contained in longer runs were seen for both myosin V (p < 0.05) and myosin VI (p < 0.05) knockdowns. Myosin II knockdown did not affect any transport parameters significantly (D, E). χ2 test statistic was applied to absolute flux values. Data were acquired from three experiments (β-gal control, n = 117 mitochondria/17 axons; myosin II dsRNA treatment, n = 69/11; myosin V dsRNA treatment, n = 74/11; myosin VI dsRNA treatment, n = 66/10).
We also observed an increase in mitochondrial velocity during myosin depletion (Fig. 3D). As seen for other transport measures, myosin V depletion significantly increased velocity in both anterograde and retrograde directions, whereas myosin VI dsRNA treatment affected only the retrograde direction. The increased run lengths in myosin V and VI knockdowns indicate that, when present, these motors interfere with the capacity of mitochondria to undergo persistent, uninterrupted movement. The increased mitochondrial velocities in these knockdowns suggest further that myosins exert force on mitochondria that competes with MT-based motors. Myosin II knockdown did not affect velocity, run length, or flux, ruling out a direct role for this motor in mitochondrial transport.
Myosin interruption of mitochondrial transport leads to docking rather than direction change
The interruption of protracted mitochondrial transport by myosins could regulate the transition to a stationary, docked state, the direction of transport, or both. To test this, we quantified the effect of myosin knockdowns on stationary time versus direction changes. Myosin V depletion lead to a >25% decrease in the percentage of time mitochondria spent being stationary (Fig. 4A–C). The resulting increase in duty cycle occurred for both anterograde and retrograde directions (Fig. 4B,C). Myosin VI knockdown had a more subtle effect: a modest but significant increase in retrograde duty cycle only (Fig. 4B,C). Although the changes in transport parameters for retrograde movement seen with myosin VI depletion were similar to those we observed for myosin V (Figs. 3D,E, 4C), the myosin VI effect was distributed differently. During myosin VI knockdown, a minority of mitochondria showed most of the duty cycle increase, whereas myosin V knockdown lead to a broad increase in transport for most organelles (Fig. 4B,C) (supplemental Videos 3, 4, available at www.jneurosci.org as supplemental material). The differential effect on transport seen during myosin V and VI knockdowns may be attributable to interactions with kinesin or dynein that are specific to each myosin or it could be attributable to the organization of actin filaments in these neurons.
Figure 4.
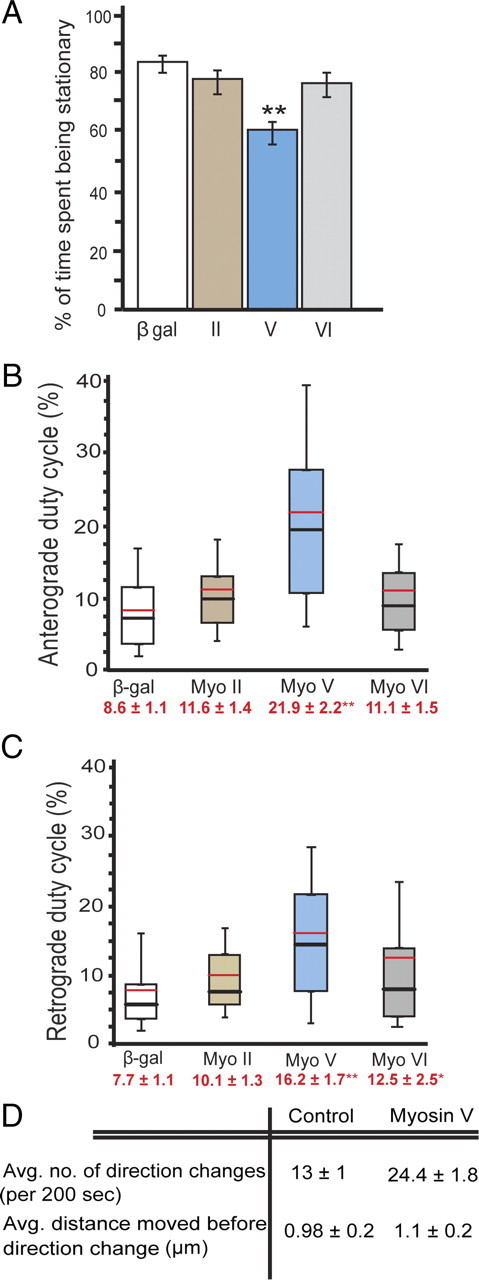
Myosin opposes mitochondrial transport, leading to increased stationary periods. During myosin V depletion, there is a significant decrease in the percentage of time mitochondria spent being stationary; **p < 0.05. (A). The mitochondrial duty cycles in the anterograde (B) and retrograde (C) directions are shown using box plots in which the black hash mark represents the median, the red hash mark represents the mean, the top and bottom of the box represent 25th and 75th percentiles, and the top and bottom error bars represent 10th and 90th percentiles. Mean ± SE are shown in red below the x-axis label for each treatment. The majority of mitochondria are mobile for longer durations during myosin V knockdown, and this effect is seen for both anterograde and retrograde directions. Myosin V knockdown in cells did not affect the ability of mitochondria to undergo direction changes (D). Average distances moved by the organelle between direction reversals were similar for control and myosin V dsRNA-treated cells. Myosin II knockdown did not affect either stationary phases or duty cycle. Data acquired from three experiments (β-gal control, n = 117 mitochondria/17 axons; myosin II dsRNA treatment, n = 69/11; myosin V dsRNA treatment, n = 74/11; myosin VI dsRNA treatment, n = 66/10).
To determine whether myosin V regulates the direction of mitochondrial movement, we also quantified the frequency of direction change exhibited under control conditions and after myosin V knockdown. Each change in direction from either anterograde to retrograde or vice versa was counted as one event, and the average number of events and distance covered between them was calculated. We observed that the average number of direction changes seen per mitochondrion per 200 s observation interval almost doubled (24 vs 13) during myosin V depletion. However, because mitochondria covered twice as much distance in myosin V-depleted cells, the average distance moved between direction changes remained similar for both controls and myosin V knockdown cells (Fig. 4D). These results indicate that myosin acts to interrupt mitochondrial transport on MTs to decrease duty cycle and perhaps facilitate docking and that the observed interruption of transport does not mediate or regulate direction changes.
Myosin V knockdown increases mitochondrial length
An additional, unexpected phenotype observed with myosin V knockdown was an obvious and significant increase in the length of axonal mitochondria (Fig. 5A). The mean length in myosin V-depleted axons was 2.6 ± 0.3 μm compared with 1.5 ± 0.1 μm in controls. Mitochondrial length was not affected by knockdown of myosin VI (mean of 1.4 ± 0.2 μm) or myosin II (mean of 1.5 ± 0.1 μm). More than 80% of mitochondria in controls had lengths ≤2.0 μm, whereas in myosin V-depleted cells, only ∼40% mitochondria had lengths ≤2.0 μm (Fig. 5B). These data was derived from multiple measurements made for each mitochondrion over a course of 250 frames (one frame acquired per second) to prevent inaccurately large length measurements attributable to transient overlaps of mitochondria. Equally unexpected was that these longer mitochondria showed motility that was in all respects equal or greater to that of their shorter counterparts in control cells (data not shown).
Figure 5.
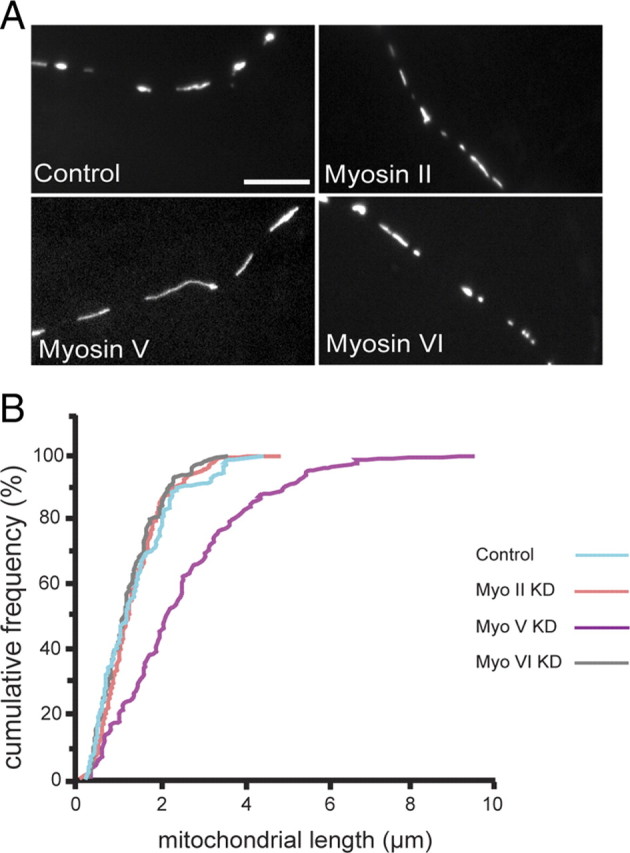
Reduction of myosin V levels resulted in longer mitochondria. An obvious phenotype in myosin V knockdown (KD) neurons was an increase in mitochondrial length, whereas in myosin II and myosin VI knockdowns, mitochondrial lengths appeared similar to those in control axons (A). Lengths of axonal mitochondria were measured and plotted as a cumulative frequency distribution: a value on y-axis represents the sum of all frequencies up to and including each length value (B). Mitochondrial lengths in myosin V-depleted cells (magenta) show a distinctly different distribution from controls (blue) (p = 0.002, two-tailed t test). Pooled data are shown from three experiments [control (blue), n = 151 mitochondria/19 axons; myosin II dsRNA treatment (orange), n = 89/14; myosin V dsRNA treatment (magenta), n = 83/12; myosin VI dsRNA treatment (gray), n = 113/15]. Scale bar, 10 μm.
Discussion
We studied the role of myosin motors in mitochondrial transport in cultured Drosophila neurons. To increase the neuronal responsiveness to RNAi, we constructed a fly strain expressing in neurons, the SID-1 dsRNA transporter of C. elegans. Expression of this protein markedly increased the efficacy of dsRNA-mediated knockdown in primary neuronal cultures. We used this system to knockdown myosins II, V, and VI and assessed mitochondrial transport. Myosin II knockdown did not lead to any phenotype. During myosin V depletion, we observed a significant increase in mitochondrial transport, and the fraction of mitochondrial flux contained in long runs almost doubled for anterograde movement. The mean velocity and duty cycle also increased in both directions; however, the frequency of direction changes per unit distance traveled remained unaffected. Myosin VI depletion increased the same movement parameters as myosin V but was selective for retrograde movement. In addition to the transport phenotypes, an increase in mitochondrial length in axons was also seen during myosin V depletion.
Myosin disruption of transport
If actomyosin-based transport were augmenting mitochondrial motility on MTs, we would have seen a decrease in at least some transport parameters with myosin knockdowns. Instead, we observed increases in duty cycle and run length and a corresponding decrease in stationary phases, which are all consistent with the hypothesis that the normal role of myosins in mitochondrial axonal transport is to oppose protracted MT-based movement. This has a precedent in the hormone-regulated movement of pigment granules in Xenopus melanocytes. These organelles move away from the cell center during exposure to melanocyte-stimulating hormone, but, rather than traveling along MTs all the way to the periphery, they become dispersed throughout the cell. They achieve this distribution via bidirectional movements on the radial MT array, driven by kinesin and dynein, in which myosin V selectively competes with dynein, effectively removing organelles from the MT tracks during retrograde runs and displacing them onto actin filaments (Gross et al., 2002). Similarly in mouse melanocytes, myosin V captures melanosomes moving rapidly on MTs and offloads them onto actin tracks. Local movement on actin eventually allows them to reach distal ends of melanocytes, and this is a prerequisite for skin pigmentation (Wu et al., 1998). Our data suggest that anterograde movements of axonal mitochondria can be strongly disrupted by myosin V, whereas retrograde movements are modestly disrupted by both myosins V and VI. This is also consistent with previous analysis of myosin Va null mice (Bridgman, 1999) in which axonal vesicles showed increased anterograde movement. However, our data show not just increased duty cycle and run length but also increased velocity after myosin V and VI knockdown. This suggests that myosins exert a force on mitochondria that competes with MT-based motors and may thus facilitate their offloading from MT tracks and/or docking on actin. It is possible that some or all of the “stationary” periods we observe actually comprise very short bidirectional movements on actin that do not complement mitochondrial motility, consistent with the view of myosins V and VI as “dynamic tethers” (Woolner and Bement, 2009). Apart from their roles in organelle transport, a parallel body of evidence does indicate a role for myosins V and VI in anchoring cytoplasmic organelles. Myosin V has been implicated in tethering vesicles to actin during spermatogenesis (Mermall et al., 2005). As for myosin VI, its monomeric form, low processivity (Lister et al., 2004), and long dwell time (Altman et al., 2004; Noguchi et al., 2006) are generally inconsistent with organelle movement; thus, it is perhaps more likely to be a candidate for anchoring than for moving mitochondria on actin.
Physiological significance of disrupted mitochondrial transport
What physiological role could be played by myosins opposing protracted mitochondrial movements in the axon? Mitochondria often do not have a uniform or constant distribution in axons; against the backdrop of mass net movement in the anterograde and retrograde directions, they are also selectively localized (Hollenbeck and Saxton, 2005) and activated (Verburg and Hollenbeck, 2008) at specific sites. These include a variety of regions with high demand for mitochondrial function (Hollenbeck and Saxton, 2005). Achieving and subsequently reorganizing such a non-uniform distribution requires that mitochondria be not only transported to these regions but also retained there. The primary mechanism proposed for mitochondrial docking is linkage to the cytoskeleton and evidence exists for neurofilaments (NFs), MTs, and actin filaments as docking sites. Associations of mitochondria with NFs have been suggested by ultrastructural observation (Hirokawa, 1982) and in vitro binding (Wagner et al., 2003), but Drosophila neurons display complex saltatory mitochondrial movements despite lacking intermediate filaments (Goldstein and Gunawardena, 2000). Ultrastructural studies have also shown links between mitochondria and MTs (Lindén et al., 1989a,b; Leterrier et al., 1994), and recent observations by Kang et al. (2008) have implicated the brain-specific protein syntaphilin in mitochondrial docking to MTs in a mouse model; however, no syntaphilin homolog has been found in invertebrates (Lloyd et al., 2000). Recent evidence indicates that the mitochondrial proteins Milton and Miro GTPase can regulate MT-based movement in the axon. Miro binds the kinesin-1 HC directly (Macaskill et al., 2009b) and also as part of a complex with the protein Milton (Glater et al., 2006; MacAskill et al., 2009a) in a manner that depends on Ca levels (Saotome et al., 2008; Macaskill et al., 2009b; Wang and Schwarz, 2009) and probably controls kinesin function. Whereas both Miro and Milton are required for transport of mitochondria to synapses (Stowers et al., 2002; Guo et al., 2005), their role in generating a non-uniform distribution of mitochondria in the neuron is not yet clear.
Another body of evidence favors actin filaments as a mitochondrial docking substrate. Mitochondria-rich zones in neurons are often actin rich but MT and NF poor. In addition, in the absence of actin, axonal mitochondrial transport exhibits greater velocities and excursion lengths (Morris and Hollenbeck, 1995; Ligon and Steward, 2000), indicating that some interaction with actin actually impedes MT-based transport. Most relevant here, mitochondria can be attracted to and retained at axonal sites of experimentally induced receptor-based signaling (Chada and Hollenbeck, 2003; Verburg and Hollenbeck, 2008) only in the presence of intact actin filaments (Chada and Hollenbeck, 2004). Along with the data presented here, this argues for a transport system in which MTs act as tracks for most normal mitochondrial traffic in the axon, whereas myosin motors interact with actin to oppose movement transiently but in a manner that becomes stable in the presence of specific signals and, perhaps, additional docking proteins. The ability of myosins to produce short, slow movements of axonal mitochondria (Morris and Hollenbeck, 1995; Ligon and Steward, 2000) would thus be incidental to their main function there. It seems likely that mitochondrial transport requires several levels of regulation, including the regulation of motor activity, motor–organelle binding, interruption or reinitiation of movement, and docking.
Drosophila neurons differ from most vertebrate neurons in that they lack neurofilaments, and, in culture, their axons have a very small diameter. Neurofilaments are not only abundantly present in vertebrate axons but are also known to interact with mitochondria (Wagner et al., 2003). Their possible influences on the relative roles of actin, myosins, and MT motors in vertebrate neurons cannot be addressed here. Thus, some of the transport phenotypes we observed during myosin depletion could be different in vertebrate neurons.
Myosin V knockdown increases mitochondrial length
The effects of myosin V depletion on both mitochondrial traffic and length could be independent functions of the motor protein (Mermall et al., 1998). However, it seems likely that mitochondria require stationary phases for proper assembly and function of fission machinery. Hence, a perturbation that leads to increased transport would interfere with their ability to undergo normal fission, shifting the balance of fission and fusion and producing longer mitochondria. Consistent with this, Saotome et al. (2008) observed that EF-hand mutations in the Miro protein increased mitochondrial motility by suppressing Ca-dependent mitochondrial arrest and also lead to a >20% increase in mitochondrial length. Conversely, a dMiro null mutation decreased both the motility and length of axonal mitochondria (Russo et al., 2009). In addition, De Vos et al. (2005) have shown that the induction of mitochondrial fission using ATP synthase and electron-transport inhibitors in neurons was accompanied by increased occupancy of mitochondria by the fission protein DRP1. However, if filamentous actin was disrupted, then inhibitor treatment did not increase DRP1 colocalization and fission did not increase. This indicates that filamentous actin is required for successful recruitment of fission proteins to mitochondria, and our results imply that this requirement includes myosin–actin interactions that halt mitochondrial movement.
Footnotes
This work was supported by National Institute of Neurological Disorder and Stroke Grant NS 27073 (P.J.H.) and the Purdue Research Foundation (D.P., P.J.H.). We thank Haiqiong Li and Mandana Amiri for myosin V tail colocalization with mitochondria data. We thank Daniel Suter and Henry Chang (Purdue University, West Lafayette, IN) for helpful comments during this study, Dan Kiehart (Duke University, Durham, NC) for anti-myosin II, James Sellars (National Heart, Lung, and Blood Institute/National Institutes of Health, Bethesda, MD) and Don Ready (Purdue University) for anti-myosin V, and Kathryn Miller (Washington University, St. Louis, MO) for anti-myosin VI. P.J.H. thanks Norbert Perrimon (Harvard Medical School, Boston, MA) for hosting a sabbatical visit.
References
- Altman D, Sweeney HL, Spudich JA. The mechanism of myosin VI translocation and its load-induced anchoring. Cell. 2004;116:737–749. doi: 10.1016/s0092-8674(04)00211-9. [DOI] [PubMed] [Google Scholar]
- Altmann K, Frank M, Neumann D, Jakobs S, Westermann B. The class V myosin motor protein, Myo2, plays a major role in mitochondrial motility in Saccharomyces cerevisiae. J Cell Biol. 2008;181:119–130. doi: 10.1083/jcb.200709099. [DOI] [PMC free article] [PubMed] [Google Scholar]
- Berthold CH, Fabricius C, Rydmark M, Andersén B. Axoplasmic organelles at nodes of Ranvier. I. Occurrence and distribution in large myelinated spinal root axons of the adult cat. J Neurocytol. 1993;22:925–940. doi: 10.1007/BF01218351. [DOI] [PubMed] [Google Scholar]
- Bridgman PC. Myosin Va movements in normal and dilute-lethal axons provide support for a dual filament motor complex. J Cell Biol. 1999;146:1045–1060. doi: 10.1083/jcb.146.5.1045. [DOI] [PMC free article] [PubMed] [Google Scholar]
- Bristow EA, Griffiths PG, Andrews RM, Johnson MA, Turnbull DM. The distribution of mitochondrial activity in relation to optic nerve structure. Arch Ophthalmol. 2002;120:791–796. doi: 10.1001/archopht.120.6.791. [DOI] [PubMed] [Google Scholar]
- Buss F, Luzio JP, Kendrick-Jones J. Myosin VI, a new force in clathrin mediated endocytosis. FEBS Lett. 2001;508:295–299. doi: 10.1016/s0014-5793(01)03065-4. [DOI] [PubMed] [Google Scholar]
- Chada SR, Hollenbeck PJ. Mitochondrial movement and positioning in axons: the role of growth factor signaling. J Exp Biol. 2003;206:1985–1992. doi: 10.1242/jeb.00263. [DOI] [PubMed] [Google Scholar]
- Chada SR, Hollenbeck PJ. Nerve growth factor signaling regulates motility and docking of axonal mitochondria. Curr Biol. 2004;14:1272–1276. doi: 10.1016/j.cub.2004.07.027. [DOI] [PubMed] [Google Scholar]
- DeGiorgis JA, Reese TS, Bearer EL. Association of a nonmuscle myosin II with axoplasmic organelles. Mol Biol Cell. 2002;13:1046–1057. doi: 10.1091/mbc.01-06-0315. [DOI] [PMC free article] [PubMed] [Google Scholar]
- Desnos C, Huet S, Darchen F. “Should I stay or should I go?”: myosin V function in organelle trafficking. Biol Cell. 2007;99:411–423. doi: 10.1042/BC20070021. [DOI] [PubMed] [Google Scholar]
- De Vos KJ, Allan VJ, Grierson AJ, Sheetz MP. Mitochondrial function and actin regulate dynamin-related protein 1-dependent mitochondrial fission. Curr Biol. 2005;15:678–683. doi: 10.1016/j.cub.2005.02.064. [DOI] [PubMed] [Google Scholar]
- Glater EE, Megeath LJ, Stowers RS, Schwarz TL. Axonal transport of mitochondria requires milton to recruit kinesin heavy chain and is light chain independent. J Cell Biol. 2006;173:545–557. doi: 10.1083/jcb.200601067. [DOI] [PMC free article] [PubMed] [Google Scholar]
- Goldstein LS, Gunawardena S. Flying through the Drosophila cytoskeletal genome. J Cell Biol. 2000;150:F63–F68. doi: 10.1083/jcb.150.2.f63. [DOI] [PMC free article] [PubMed] [Google Scholar]
- Goshima G, Vale RD. The roles of microtubule-based motor proteins in mitosis: comprehensive RNAi analysis in the Drosophila S2 cell line. J Cell Biol. 2003;162:1003–1016. doi: 10.1083/jcb.200303022. [DOI] [PMC free article] [PubMed] [Google Scholar]
- Gross SP, Tuma MC, Deacon SW, Serpinskaya AS, Reilein AR, Gelfand VI. Interactions and regulation of molecular motors in Xenopus melanophores. J Cell Biol. 2002;156:855–865. doi: 10.1083/jcb.200105055. [DOI] [PMC free article] [PubMed] [Google Scholar]
- Guo X, Macleod GT, Wellington A, Hu F, Panchumarthi S, Schoenfield M, Marin L, Charlton MP, Atwood HL, Zinsmaier KE. The GTPase dMiro is required for axonal transport of mitochondria to Drosophila synapses. Neuron. 2005;47:379–393. doi: 10.1016/j.neuron.2005.06.027. [DOI] [PubMed] [Google Scholar]
- Hirokawa N. Cross-linker system between neurofilaments, microtubules, and membranous organelles in frog axons revealed by the quick-freeze, deep-etching method. J Cell Biol. 1982;94:129–142. doi: 10.1083/jcb.94.1.129. [DOI] [PMC free article] [PubMed] [Google Scholar]
- Hollenbeck PJ, Saxton WM. The axonal transport of mitochondria. J Cell Sci. 2005;118:5411–5419. doi: 10.1242/jcs.02745. [DOI] [PMC free article] [PubMed] [Google Scholar]
- Hurd DD, Saxton WM. Kinesin mutations cause motor neuron disease phenotypes by disrupting fast axonal transport in Drosophila. Genetics. 1996;144:1075–1085. doi: 10.1093/genetics/144.3.1075. [DOI] [PMC free article] [PubMed] [Google Scholar]
- Kang JS, Tian JH, Pan PY, Zald P, Li C, Deng C, Sheng ZH. Docking of axonal mitochondria by syntaphilin controls their mobility and affects short-term facilitation. Cell. 2008;132:137–148. doi: 10.1016/j.cell.2007.11.024. [DOI] [PMC free article] [PubMed] [Google Scholar]
- Kiehart DP, Feghali R. Cytoplasmic myosin from Drosophila melanogaster. J Cell Biol. 1986;103:1517–1525. doi: 10.1083/jcb.103.4.1517. [DOI] [PMC free article] [PubMed] [Google Scholar]
- Langford GM. Actin- and microtubule-dependent organelle motors: interrelationships between the two motility systems. Curr Opin Cell Biol. 1995;7:82–88. doi: 10.1016/0955-0674(95)80048-4. [DOI] [PubMed] [Google Scholar]
- Leterrier JF, Rusakov DA, Lindén M. Statistical analysis of the surface distribution of microtubule-associated proteins (MAPs) bound in vitro to rat brain mitochondria and labelled by 10 nm gold-coupled antibodies. Bull Assoc Anat (Nancy) 1994;78:47–51. [PubMed] [Google Scholar]
- Li BX, Satoh AK, Ready DF. Myosin V, Rab11, and dRip11 direct apical secretion and cellular morphogenesis in developing Drosophila photoreceptors. J Cell Biol. 2007;177:659–669. doi: 10.1083/jcb.200610157. [DOI] [PMC free article] [PubMed] [Google Scholar]
- Ligon LA, Steward O. Role of microtubules and actin filaments in the movement of mitochondria in the axons and dendrites of cultured hippocampal neurons. J Comp Neurol. 2000;427:351–361. doi: 10.1002/1096-9861(20001120)427:3<351::aid-cne3>3.0.co;2-r. [DOI] [PubMed] [Google Scholar]
- Lindén M, Nelson BD, Leterrier JF. The specific binding of the microtubule-associated protein 2 (MAP2) to the outer membrane of rat brain mitochondria. Biochem J. 1989a;261:167–173. doi: 10.1042/bj2610167. [DOI] [PMC free article] [PubMed] [Google Scholar]
- Lindén M, Nelson BD, Loncar D, Leterrier JF. Studies on the interaction between mitochondria and the cytoskeleton. J Bioenerg Biomembr. 1989b;21:507–518. doi: 10.1007/BF00762522. [DOI] [PubMed] [Google Scholar]
- Lister I, Schmitz S, Walker M, Trinick J, Buss F, Veigel C, Kendrick-Jones J. A monomeric myosin VI with a large working stroke. EMBO J. 2004;23:1729–1738. doi: 10.1038/sj.emboj.7600180. [DOI] [PMC free article] [PubMed] [Google Scholar]
- Lloyd TE, Verstreken P, Ostrin EJ, Phillippi A, Lichtarge O, Bellen HJ. A genome-wide search for synaptic vesicle cycle proteins in Drosophila. Neuron. 2000;26:45–50. doi: 10.1016/s0896-6273(00)81136-8. [DOI] [PubMed] [Google Scholar]
- MacAskill AF, Brickley K, Stephenson FA, Kittler JT. GTPase dependent recruitment of Grif-1 by Miro1 regulates mitochondrial trafficking in hippocampal neurons. Mol Cell Neurosci. 2009a;40:301–312. doi: 10.1016/j.mcn.2008.10.016. [DOI] [PubMed] [Google Scholar]
- Macaskill AF, Rinholm JE, Twelvetrees AE, Arancibia-Carcamo IL, Muir J, Fransson A, Aspenstrom P, Attwell D, Kittler JT. Miro1 is a calcium sensor for glutamate receptor-dependent localization of mitochondria at synapses. Neuron. 2009b;61:541–555. doi: 10.1016/j.neuron.2009.01.030. [DOI] [PMC free article] [PubMed] [Google Scholar]
- Mermall V, McNally JG, Miller KG. Transport of cytoplasmic particles catalysed by an unconventional myosin in living Drosophila embryos. Nature. 1994;369:560–562. doi: 10.1038/369560a0. [DOI] [PubMed] [Google Scholar]
- Mermall V, Post PL, Mooseker MS. Unconventional myosins in cell movement, membrane traffic, and signal transduction. Science. 1998;279:527–533. doi: 10.1126/science.279.5350.527. [DOI] [PubMed] [Google Scholar]
- Mermall V, Bonafé N, Jones L, Sellers JR, Cooley L, Mooseker MS. Drosophila myosin V is required for larval development and spermatid individualization. Dev Biol. 2005;286:238–255. doi: 10.1016/j.ydbio.2005.07.028. [DOI] [PubMed] [Google Scholar]
- Miller KE, Sheetz MP. Characterization of myosin V binding to brain vesicles. J Biol Chem. 2000;275:2598–2606. doi: 10.1074/jbc.275.4.2598. [DOI] [PubMed] [Google Scholar]
- Miller KE, Sheetz MP. Axonal mitochondrial transport and potential are correlated. J Cell Sci. 2004;117:2791–2804. doi: 10.1242/jcs.01130. [DOI] [PubMed] [Google Scholar]
- Miller KG, Field CM, Alberts BM. Actin-binding proteins from Drosophila embryos: a complex network of interacting proteins detected by F-actin affinity chromatography. J Cell Biol. 1989;109:2963–2975. doi: 10.1083/jcb.109.6.2963. [DOI] [PMC free article] [PubMed] [Google Scholar]
- Morris RL, Hollenbeck PJ. The regulation of bidirectional mitochondrial transport is coordinated with axonal outgrowth. J Cell Sci. 1993;104:917–927. doi: 10.1242/jcs.104.3.917. [DOI] [PubMed] [Google Scholar]
- Morris RL, Hollenbeck PJ. Axonal transport of mitochondria along microtubules and F-actin in living vertebrate neurons. J Cell Biol. 1995;131:1315–1326. doi: 10.1083/jcb.131.5.1315. [DOI] [PMC free article] [PubMed] [Google Scholar]
- Nangaku M, Sato-Yoshitake R, Okada Y, Noda Y, Takemura R, Yamazaki H, Hirokawa N. KIF1B, a novel microtubule plus end-directed monomeric motor protein for transport of mitochondria. Cell. 1994;79:1209–1220. doi: 10.1016/0092-8674(94)90012-4. [DOI] [PubMed] [Google Scholar]
- Noguchi T, Lenartowska M, Miller KG. Myosin VI stabilizes an actin network during Drosophila spermatid individualization. Mol Biol Cell. 2006;17:2559–2571. doi: 10.1091/mbc.E06-01-0031. [DOI] [PMC free article] [PubMed] [Google Scholar]
- Pilling AD, Horiuchi D, Lively CM, Saxton WM. Kinesin-1 and Dynein are the primary motors for fast transport of mitochondria in Drosophila motor axons. Mol Biol Cell. 2006;17:2057–2068. doi: 10.1091/mbc.E05-06-0526. [DOI] [PMC free article] [PubMed] [Google Scholar]
- Prekeris R, Terrian DM. Brain myosin V is a synaptic vesicle-associated motor protein: evidence for a Ca2+-dependent interaction with the synaptobrevin-synaptophysin complex. J Cell Biol. 1997;137:1589–1601. doi: 10.1083/jcb.137.7.1589. [DOI] [PMC free article] [PubMed] [Google Scholar]
- Rodionov VI, Gyoeva FK, Gelfand VI. Kinesin is responsible for centrifugal movement of pigment granules in melanophores. Proc Natl Acad Sci U S A. 1991;88:4956–4960. doi: 10.1073/pnas.88.11.4956. [DOI] [PMC free article] [PubMed] [Google Scholar]
- Rogers SL, Karcher RL, Roland JT, Minin AA, Steffen W, Gelfand VI. Regulation of melanosome movement in the cell cycle by reversible association with myosin V. J Cell Biol. 1999;146:1265–1276. doi: 10.1083/jcb.146.6.1265. [DOI] [PMC free article] [PubMed] [Google Scholar]
- Rogers SL, Wiedemann U, Stuurman N, Vale RD. Molecular requirements for actin-based lamella formation in Drosophila S2 cells. J Cell Biol. 2003;162:1079–1088. doi: 10.1083/jcb.200303023. [DOI] [PMC free article] [PubMed] [Google Scholar]
- Ross JL, Ali MY, Warshaw DM. Cargo transport: molecular motors navigate a complex cytoskeleton. Curr Opin Cell Biol. 2008;20:41–47. doi: 10.1016/j.ceb.2007.11.006. [DOI] [PMC free article] [PubMed] [Google Scholar]
- Rudolf R, Kögel T, Kuznetsov SA, Salm T, Schlicker O, Hellwig A, Hammer JA, 3rd, Gerdes HH. Myosin Va facilitates the distribution of secretory granules in the F-actin rich cortex of PC12 cells. J Cell Sci. 2003;116:1339–1348. doi: 10.1242/jcs.00317. [DOI] [PubMed] [Google Scholar]
- Russo GJ, Louie K, Wellington A, Macleod GT, Hu F, Panchumarthi S, Zinsmaier KE. Drosophila Miro is required for both anterograde and retrograde axonal mitochondrial transport. J Neurosci. 2009;29:5443–5455. doi: 10.1523/JNEUROSCI.5417-08.2009. [DOI] [PMC free article] [PubMed] [Google Scholar]
- Ruthel G, Hollenbeck PJ. Response of mitochondrial traffic to axon determination and differential branch growth. J Neurosci. 2003;23:8618–8624. doi: 10.1523/JNEUROSCI.23-24-08618.2003. [DOI] [PMC free article] [PubMed] [Google Scholar]
- Salvaterra PM, Bournias-Vardiabasis N, Nair T, Hou G, Lieu C. In vitro neuronal differentiation of Drosophila embryo cells. J Neurosci. 1987;7:10–22. doi: 10.1523/JNEUROSCI.07-01-00010.1987. [DOI] [PMC free article] [PubMed] [Google Scholar]
- Saotome M, Safiulina D, Szabadkai G, Das S, Fransson A, Aspenstrom P, Rizzuto R, Hajnóczky G. Bidirectional Ca2+-dependent control of mitochondrial dynamics by the Miro GTPase. Proc Natl Acad Sci U S A. 2008;105:20728–20733. doi: 10.1073/pnas.0808953105. [DOI] [PMC free article] [PubMed] [Google Scholar]
- Sharma SK, Nirenberg M. Silencing of genes in cultured Drosophila neurons by RNA interference. Proc Natl Acad Sci U S A. 2007;104:12925–12930. doi: 10.1073/pnas.0704299104. [DOI] [PMC free article] [PubMed] [Google Scholar]
- Stowers RS, Megeath LJ, Górska-Andrzejak J, Meinertzhagen IA, Schwarz TL. Axonal transport of mitochondria to synapses depends on milton, a novel Drosophila protein. Neuron. 2002;36:1063–1077. doi: 10.1016/s0896-6273(02)01094-2. [DOI] [PubMed] [Google Scholar]
- Tuma MC, Gelfand VI. Molecular mechanisms of pigment transport in melanophores. Pigment Cell Res. 1999;12:283–294. doi: 10.1111/j.1600-0749.1999.tb00762.x. [DOI] [PubMed] [Google Scholar]
- Verburg J, Hollenbeck PJ. Mitochondrial membrane potential in axons increases with local nerve growth factor or semaphorin signaling. J Neurosci. 2008;28:8306–8315. doi: 10.1523/JNEUROSCI.2614-08.2008. [DOI] [PMC free article] [PubMed] [Google Scholar]
- Wagner OI, Lifshitz J, Janmey PA, Linden M, McIntosh TK, Leterrier JF. Mechanisms of mitochondria-neurofilament interactions. J Neurosci. 2003;23:9046–9058. doi: 10.1523/JNEUROSCI.23-27-09046.2003. [DOI] [PMC free article] [PubMed] [Google Scholar]
- Wang X, Schwarz TL. The mechanism of Ca2+ -dependent regulation of kinesin-mediated mitochondrial motility. Cell. 2009;136:163–174. doi: 10.1016/j.cell.2008.11.046. [DOI] [PMC free article] [PubMed] [Google Scholar]
- Wolenski JS, Cheney RE, Mooseker MS, Forscher P. In vitro motility of immunoadsorbed brain myosin-V using a Limulus acrosomal process and optical tweezer-based assay. J Cell Sci. 1995;108:1489–1496. doi: 10.1242/jcs.108.4.1489. [DOI] [PubMed] [Google Scholar]
- Woolner S, Bement WM. Unconventional myosins acting unconventionally. Trends Cell Biol. 2009;19:245–252. doi: 10.1016/j.tcb.2009.03.003. [DOI] [PMC free article] [PubMed] [Google Scholar]
- Wu X, Bowers B, Rao K, Wei Q, Hammer JA., 3rd Visualization of melanosome dynamics within wild-type and dilute melanocytes suggests a paradigm for myosin V function In vivo. J Cell Biol. 1998;143:1899–1918. doi: 10.1083/jcb.143.7.1899. [DOI] [PMC free article] [PubMed] [Google Scholar]
- Zhang CL, Ho PL, Kintner DB, Sun D, Chiu SY. Activity-dependent regulation of mitochondrial motility by calcium and Na/K-ATPase at nodes of Ranvier of myelinated nerves. J Neurosci. 2010;30:3555–3566. doi: 10.1523/JNEUROSCI.4551-09.2010. [DOI] [PMC free article] [PubMed] [Google Scholar]