

Abstract
Biomedical imaging can reveal clear 3-dimensional body morphology non-invasively with high spatial resolution. Its efficacy, in both clinical and pre-clinical settings, is enhanced with its capability to provide in vivo functional/biological information in tissue. The role of kinetic modeling in providing biological/functional information in biomedical imaging is described. General characteristics and limitations in extracting biological information are addressed and practical approaches to solve the problems are discussed and illustrated with examples. Some future challenges and opportunities for kinetic modeling to expand the capability of biomedical imaging are also presented.
Introduction
Biomedical imaging has experienced a rapid and continuing advancement, and is critically important in many clinical and pre-clinical applications. There are a multiple of modalities, such as CT, MRI, emission tomography, and ultrasound, and they can all give accurate 3-dimensional (3-D) images of some physical quantities, such as, tissue x-ray attenuation coefficients, proton density, and radioactivity concentrations, in the body non-invasively. Based on these images and measurements, detailed information regarding the structure (shape and size) and functions inside the body can be obtained that is useful for disease diagnosis, treatment monitoring, pharmaceutical development and biological/medical investigations.
Among these 3-D imaging modalities, emission tomography (ET), especially positron emission tomography (PET), is unique in its ability to provide functional information, such as perfusion, transport, metabolism, and receptor density, in tissues1,2. While the importance of the advancements in physics (e.g., detectors) and instrumentation (fast electronics) cannot be overstated, the unique capability of emission tomography is derived from its intrinsic use of radio-tracers to trace biological pathways, and the availability of many radio-tracers for a wide range of biological functions in tissues/cells. Since the use of tracers to indicate biological function is based on the principle of tracer kinetics, understanding of the principle is critical for the interpretation of the image/measurements and for guiding the development of new radio-tracers3,4. In this article, I will explain the role of kinetic modeling in this process, and will address some practical problems and their solutions. I will focus on PET in the rest of this article when addressing these issues.
Image interpretation as an inverse problem
The procedure of performing a PET study consists of 1) administrating a tracer (labeled with a positron emitter) in the body and 2) scanning the subject in a PET scanner to give images of the distribution of the injected tracer at some specific time post injection or as a function of time. The biological condition of the imaged tissue was then inferred from the obtained PET images. The procedure is illustrated in the diagram shown in Figure 1. The objective is to determine the biological state of tissue that is unknown. The tracer administration and the PET imaging are part of the measurement process—the forward process. The interpretation of the resulted images to determine the unknown tissue biology is the so-called inverse process, in terms of mathematical terminology. Formally, solution of the inverse problem is done by first modeling the forward process mathematically, and then followed by adjusting the model to find the condition (or parameter values) that gives the response/predictions most consistent with the measurements (i.e., the measured images). The modeling part, in this case, is primarily to describe the distribution, uptake and clearance of the injected tracer in the body mathematically. For a biological system as complex as the body, modeling the tracer kinetics in the body is not trivial. Fortunately, compartmental models, which consist of only 1st order ordinary differential equations, have been found able to describe the tracer kinetics in the body quite well3. However, there are many practical problems/issues involved that need to be addressed in solving the inverse problem. The imaging process also needs to be modeled as well, since it is part of the forward process that gives the measurement results, but, imaging is a physical process that is relatively simple to model compared to a biological system. Even though few people have this inverse process and modeling in mind when interpreting the PET images, the modeling is implicit in the process of interpreting the images.
Fig. 1.
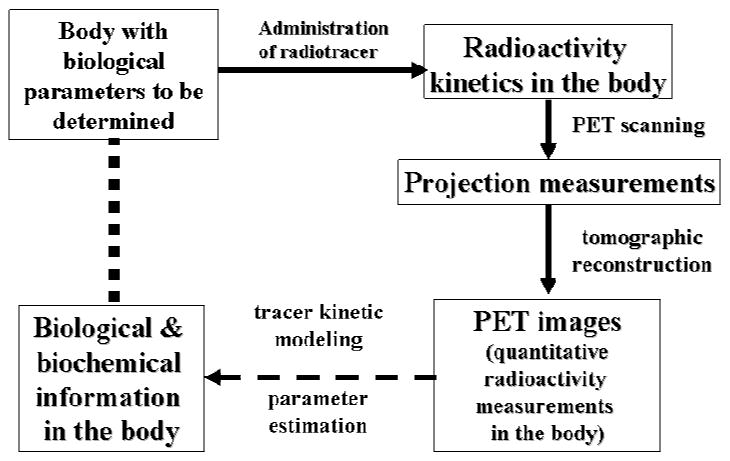
Procedure of a PET study as a diagram of information flow. The dash arrow indicates the interpretation of the images obtained from PET scanning after a PET tracer has been administered to the subject. The interpretation is accomplished by kinetic modeling of the tracer distribution in the body and by estimation of the model parameters best matching the biological functions in the body of the subject being studied.
Practical issues and solutions
Though compartmental models are appropriate for describing the tracer kinetics, there are many organs and kinetically different tissues in the body. A compartmental model that describes the tracer kinetics in the whole body could still be large and complicated, and have many unknown parameters. The more complicated the model, the more difficult it is to solve the inverse problem. This is exacerbated by the fact that usually not the whole body is imaged, or, even it is, is not simultaneously (i.e., different parts are imaged at different times). In such cases, whether there are sufficient measurements to solve the problem is a key question. What assumptions one can make to constrain the problem and to obtain robust results is naturally also a concern. In the following subsections, common approaches to address these issues will be discussed.
Input function
Since most tissues in the body receive administered tracer from blood directly and rely on the venous blood to clear the extracted tracer from the tissue, the tracer kinetics in local tissue would depend only on the time activity curve (TAC) of the tracer in blood and the biological/metabolic state in the tissues4,5. If the blood TAC of the tracer is measured/known, relationship between the tracer kinetics in tissue and the tissue biological function can be directly established. The influence due to other body tissue/organs on tracer kinetics in the tissue of interest will be accounted for completely by the tracer TAC in the blood, which is normally called the input function. With the input function determined, only the tracer behavior in the local tissue region needs to be addressed, and the kinetics in one region is completely independent of those in other tissues. Thus, the modeling of the tracer kinetics in local tissue of interest is greatly simplified, and a model of the form shown in Figure 2 can generally be used.
Fig. 2.
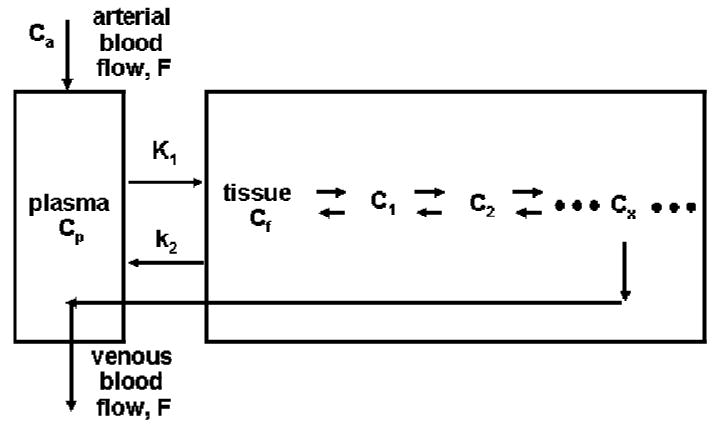
A comprehensive model describing the kinetics of a tracer that follows a biochemical reaction in a local tissue region. Tracer is delivered by blood flow to tissue, transported across the capillary and cell membrane, and involved in the biochemical pathway in the cells that the tracer was developed for. Some chemical form of the labeled tracer/product will usually be transported out of the cells and be cleared from tissue via the venous blood flow.
Well designed tracers/probes
Biochemical pathways in cells usually involve many steps. Even with the simplification to deal only with tracer behaviors in local tissue region, the model can still be quite complicated. However, if the tracer is properly designed such that it only goes through a couple of steps in cells and has only a couple of pools/compartments, the modeling problem can be more easily managed. The commonly used PET tracer FDG 6,7 is a good example of such well designed tracers. It can be transported by glucose transporters into cells and phosphorylated by hexokinase, but the phosphorylated product, FDG-6-P, is not a substrate for the subsequent isomerization step in the glycolytic pathway8,9. Also, FDG is stable in the body and no significant amounts of labeled metabolites appear in the blood even after a couple of hours. So, a compartmental model describing the kinetics can be quite simple (see Figure 3A).
Fig. 3.
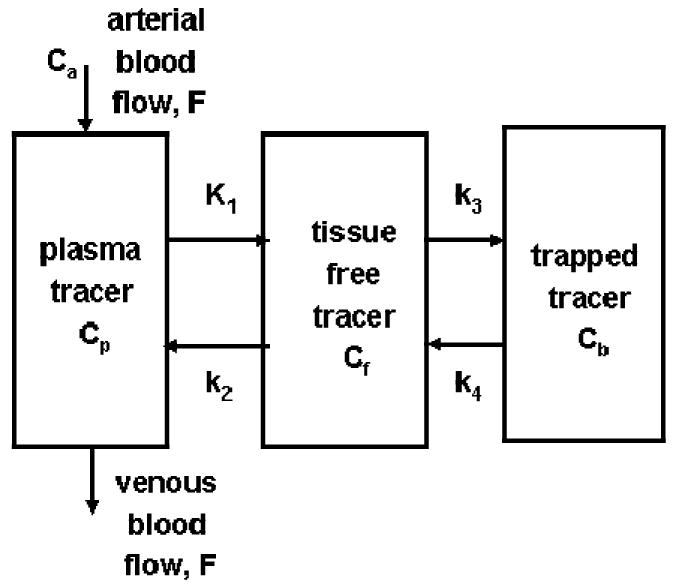
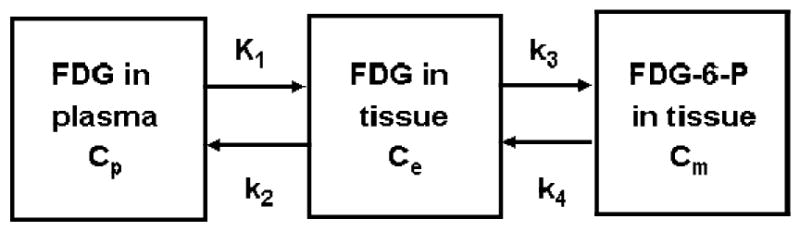
A) Simplified models for a well designed tracer that does not involved in many serial reactions in a biochemical pathway. The input function for this model is plasma tracer concentration Ca in arterial blood. B) Model configuration is further reduced from the one in 3A, if the extraction fraction of the tracer across the capillary is small and blood perfusion is not a limiting factor, like the case of FDG in brain and myocardial tissues. In this case, Ca and Cp of Figure 3A are nearly equal, and the input function is still the plasma tracer concentration in arterial blood, but is commonly denoted as Cp.
Furthermore, if the extraction fraction of the tracer is small (e.g., <10%) when it passes through the capillaries in tissue, the uptake and clearance of the tracer in tissue are not affected greatly by blood perfusion in the tissue, and the blood perfusion and clearance can be omitted from the model, simplifying the model further, as illustrated in Figure 3B. A great advantage of a simple model is that it has only a small number of model parameters and their estimation can be quite robust. The model of Fig. 3B is generally used for describing FDG kinetics in brain, myocardial, and tumor tissues4.
Based on this model, and the input function and the measurement of the tissue kinetics, one can estimate (e.g., using nonlinear regression) the values of the rate constants, from which the net uptake constant of FDG from blood to tissue can be calculated (i.e., as K1k3/(k2+k3))8. Also, the efficiency of the transport/enzymatic reactions for FDG relative to those of glucose can be calibrated, and the uptake rate of FDG in tissue can be converted to the utilization rate of glucose in tissue. The calibration constant between FDG and glucose through these steps is commonly referred to as the lumped constant (LC), used originally by Sokoloff 10 for deoxyglucose (DG) and later adopted for FDG8,9.
Simplified analysis and SUV
As shown in the above example, an important information obtained is the uptake constant (i.e., K1k3/(k2+k3) ) of the tracer in tissue. A simple method, the Patlak analysis 11, can be used to provide the uptake constant directly using a graphical procedure.
Another type of tracers/probes commonly used in PET is for determination of the density of receptors/enzymes in tissue. An example of this type of tracers/probes is FDDNP, which is used for assay of amyloid plagues and neuro-fibrillary tangles (NFT) in tissue for assessment of pathological progress related to Alzheimer disease12,13. The model for this type of tracers is similar to the one for those that trace a dynamic process (e.g., Fig. 3), except that the k3 step is proportional to the binding affinity of the tracer to the receptor site and the density of the receptors, and k4 represents its dissociation from the binding. The ratio k3/k4 is related directly to the ratio of receptor density and the dissociation constant of the tracer for receptor binding, and is commonly called the binding potential14. Theoretically, if one knows the value of the dissociation constant, the receptor density can be easily obtained from the binding potential. However, due to the uncertainty of the in vivo biochemical environment around the receptors, accurate estimation of the dissociation constant of the binding tracer in vivo is difficult, and the binding potential is usually used instead as an index of receptor density.
The primary parameter of interest for this type of studies is the ratio k3/k4. There is a simple graphical method, Logan plot15, that can give the distribution volume (Vd) of the tracer in tissue relative to that in blood. This distribution volume, according to the model, is equal to (K1/k2)(1+ k3/k4). If a tissue region does not have any specific receptor that the tracer will bind to, the value of Vd will simply be K1/k2. Assuming this K1/k2 ratio is uniform over all tissue regions, the ratio k3/k4 can be obtained by the following equation.
Moreover, it has also been shown that the ratio of distribution volumes in the above equation can be determined easily with the use of the kinetics of the reference tissue as the input function in applying the Logan plot16. With this approach, one does not even need to determine the input function from blood samples. There are also other simplified methods for estimating the binding potential or distribution volumes17,18. One needs to keep in mind, however, the underlying assumptions of these methods (e.g., uniform K1/k2 ratio and the existence of a reference tissue that is devoid of specific receptors for the tracer/probe used).
In many cases, even the above simplified analyses are impractical. A simpler and commonly used quantification method for tumor uptake of FDG is the standardized uptake value (SUV)19-21. It is calculated as
SUV = (tracer concentration in tissue)/(dose of injected tracer/body weight of subject)
The value of SUV would equal to 1.0, if the tracer is distributed uniformly in the whole body. So, if the value is higher (or lower) than 1.0 in a tissue region, it would mean that the tracer uptake in that tissue is more (or less) than the whole body average. There are variations of the SUV calculations. Lean body weight or body surface area is often used to replace the body weight. Other variations including the addition of plasma glucose level in the formulation to improve its correlation with tissue glycolytic rate. 20,21 22 SUV is easy to calculate, but has its limitations. Its validity for quantification of an uptake process depends on the consistent shape of the input function among individuals in the population21. It is not necessarily appropriate for quantifying the tissue biological states for general tracers.
Multi-function capability of PET
One of the unique characteristics of PET is that there are many tracers available to measure a variety of biological parameters. Figure 4 shows what this multi-function capability of PET can be utilized to provide useful biological information that is difficult to be obtained otherwise. In this example, 4 PET scans with 4 different tracers were performed to image the brain of a subject and kinetic modeling was used to convert the PET images to biological parameters in absolute units. The use of FDG provided the parametric image of glucose utilization rate (MRG); O-15 water provided the perfusion image (CBF); O-15 CO gave the image of vascular volume (CBV); O-15 oxygen gave images of oxygen utilization rate (MRO) and extraction fraction (OEF) (in combination with the use of CBF and CBV images)23. Furthermore, the image ratio of MRO and MRG gave the image of oxygen-to-glucose utilization ratio (OGR). CBF image could indicate whether sufficient oxygen and glucose were delivered to brain tissue; OEF showed whether the delivered oxygen met the demand of the tissue (i.e., whether OEF is less than or equal to 40%); OGR (in molar ratio) showed whether the utilized glucose went through the Creb cycle (OGR = 6) or whether substrate other than glucose was consumed (OGR>6). This multi-function study has been performed on patients with severe brain injury at the Brain Injury Research Center of UCLA to investigate brain tissue metabolic changes associated with severe brain injury24-27.
Fig. 4.
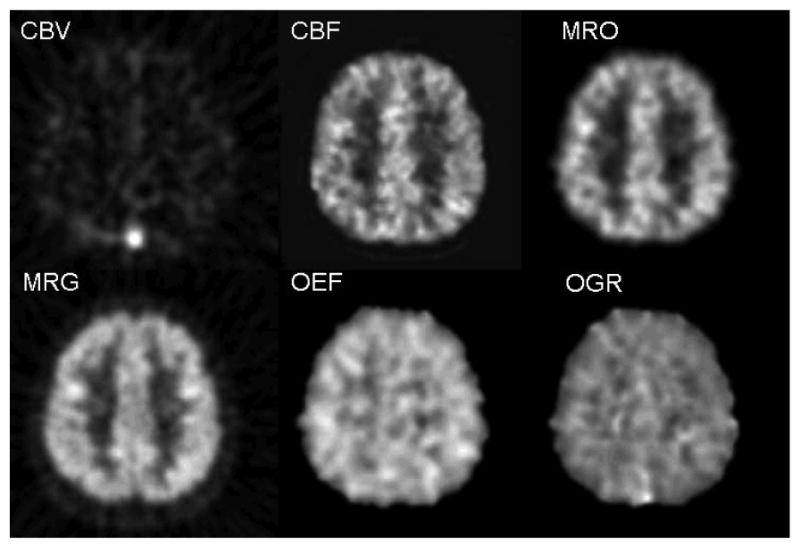
Parametric images from 4 brain PET scans of a normal subject with 4 different tracers, O-15 CO, O-15 water, O-15 oxygen, and FDG. The images correspond to the same transaxial cross-section through the upper part of the brain. The gray scales of the images were scaled to the maximal value on each image. Lighter shade is for higher values. Multiple biological functions for tissues in the same brain regions were obtained with the 4 PET scans: CBV (cerebral blood volume) from O-15 CO scan; CBF (cerebral blood flow) from O-15 water; MRO (metabolic rate of oxygen) and OEF (oxygen extraction fraction) from O-15 oxygen along with the images of CBV and CBF; MRG (glucose utilization rate) from FDG; OGR (oxygen to glucose molar ratio) as a ratio of MRO and MRG. For normal subjects, values of OEF and OGR are around 0.40 and 6.0, respectively, and are similar for gray and white matter regions as shown in the figure. (see text and cited references for details on methods and nominal values.) (Images were generated from a study performed at UCLA in collaboration with Drs. Marvin Bergsneider, H.M. Wu, David Hovda, et al at UCLA Brain Injury Research Center)
For multi-function studies, separate PET studies with different tracers are performed in separate scanning sessions. To take full advantage of this multi-function capability, the images from different studies need to be co-registered. Usually, patients studied with PET also have other imaging studies (e.g., MRI and CT). They also need to be co-registered to integrate the structural/morphological information with the functional information28. Furthermore, people are beginning to align/warp images of individuals elastically to a standardized image in a common brain space to compare with a database for computer aided diagnosis of various diseases 29-32.
Future challenges
There are many additional areas that kinetic modeling can be used to help advance the state of the art of biomedical imaging. With the growing use of small animal PET imaging for biological and pharmaceutical studies, there are many new technical challenges, as well as new opportunities for kinetic modeling. To obtain the input function in small animals like mice is one of them. A lot of progresses have been made recently33-36, but more advancement is expected. The use of kinetic modeling in the image reconstruction of dynamic PET images is also expected to help reduce image noise level and improve the signal to noise ratio. Other challenges/opportunities include rapid validation of models for new tracers, automated processing for biological quantification, and modeling of biomarkers with large mass doses.
One of the special characteristics of mouse PET imaging is that the whole animal can be placed inside the field of view. So, the kinetics of all tissues in the body can be obtained simultaneously. This offers the opportunity that a whole body model can be developed and be used to determine the biological parameters in the entire body at the same time. If this is successful, no separate determination of the input function would be needed. A set of dynamic mouse FDG PET from UCLA is available online (http://dragon.nuc.ucla.edu/mqp/index.html)37. People who are interested in solving the problem can start exploring this possibility without performing the expensive and time consuming experiments to acquire the experimental data.
Computation is important in many scientific fields today, and has created specialties, like computational fluid dynamics, computer-aided design, computational biology, virtual anatomy, and Monte Carlo simulation. In biomedical imaging, Monte Carlo simulation is used to help the design of new scanners, and computer-aided diagnosis is used to speed up the diagnostic procedure and to improve its sensitivity and specificity. Based on kinetic modeling of the whole body for tracer distribution, we have also developed a computer software system call KIS 38 (http://dragon.nuc.ucla.edu/kis/index.html) to simulate tracer kinetics in local tissue regions as well as in the entire body as measured with PET. It offers the opportunity to do virtual PET studies on mouse. A hypothetical tracer with certain biological and biochemical properties can be evaluated quickly to see if it would be useful for indicating certain biological function, before effort is devoted for its development. Instead of lengthy trial and error experiments, scanning protocols can also be evaluated quickly using this type of virtual experimentation to determine the optimal parameters.
Summary
As presented above, kinetic modeling has played an important role in biomedical imaging and its role is increasing as more functional and biological information is demanded in clinical and pre-clinical settings. Many new challenges and opportunities are here for investigators to advance the utility of kinetic modeling to expand the capability of biomedical imaging in the future.
Acknowledgments
The author would like to acknowledge the support from DOE (contract DE-FG02-06ER64249), NIH (grants R01-EB001943, P50-CA086306, P01-AG0254831), and the UCLA Brain Injury Research Center. He would also like to thank many colleagues (Drs. Barrio, Phelps, Wu, Bergsneider, Small, Schelbert, et al), graduate students and postdoctoral fellows, with whom he has collaborated over the years.
References
- 1.Phelps ME, Mazziotta J, Schelbert HR. Positron Emission Tomography and Autoradiography. Raven Press; 1985. [Google Scholar]
- 2.Phelps ME. PET: molecular imaging and its biological applications. New York: Springer; 2004. [Google Scholar]
- 3.Lassen NA, Perl W. Tracer Kinetic Methods in Medical Physiology. New York: Raven Press; 1979. p. 189. [Google Scholar]
- 4.Huang SC, Phelps ME. Principles of tracer kinetic modeling in positron emision tomography and autoradiography. In: Phelps ME, Mazziotta J, Schelbert HR, editors. Positron Emission Tomography and Autoradiography. Raven Press; 1985. pp. 287–346. [Google Scholar]
- 5.Gambhir SS. Quantitative assay development for PET. In: Phelps ME, editor. PET: molecular imaging and its biological applications. New York: Springer; 2004. pp. 125–216. [Google Scholar]
- 6.Ido T, Wan CN, Fowler J, Wolf A. Fluorination with F2: a convenient synthesis of 2-deoxy-2-fluoro-D-glucose. J Organ Chem. 1978;42:2341–2342. [Google Scholar]
- 7.Hamacher K, Coenen HH, Stocklin G. Efficient stereospecific synthesis of no-carrier-added 2-[F18]-fluoro-2-deoxy-D-glucose using aminopolyether supported nucleophilic substitution. J Nucl Med. 1986;27:235–238. [PubMed] [Google Scholar]
- 8.Huang SC, Phelps ME, Hoffman EJ, Sideris K, Selin CJ, Kuhl DE. Noninvasive determination of local cerebral metabolic rate of glucose in man. Am J Physiol. 1980;238:E69–82. doi: 10.1152/ajpendo.1980.238.1.E69. [DOI] [PubMed] [Google Scholar]
- 9.Phelps ME, Huang SC, Hoffman EJ, Selin CE, Kuhl DE. Tomographic measurement of regional cerebral glucose metabolic rate in man with (F-18) fluorodeoxyglucose: validation of method. Ann Neurol. 1979;6:371–388. doi: 10.1002/ana.410060502. [DOI] [PubMed] [Google Scholar]
- 10.Sokoloff L, Reivish M, Kennedy C, Des Rosiers MH, Patlak CS, Pettigrew KD, Sakurada O, Shinohara M. The [C-14]deoxyglucose method for the measurement of local cerebral glucose utilization: theory, procedure, and normal values in the conscious and anesthetized albino rat. J Neuro Chem. 1977;28:897–916. doi: 10.1111/j.1471-4159.1977.tb10649.x. [DOI] [PubMed] [Google Scholar]
- 11.Patlak C, Blasberg RG. Graphical evaluation of blood-to-brain transfer constants from multiple-time uptake data. J Cereb Blood Flow Metab. 1983;3:1–7. doi: 10.1038/jcbfm.1983.1. [DOI] [PubMed] [Google Scholar]
- 12.Barrio JR, Huang SC, Cole GM, et al. PET imaging of Tangles and Plaques in Alzheimer's Disease. J Nucl Med. 1999;40:284. [Google Scholar]
- 13.Small G, Kepe V, Ercoli LM, Siddarth P, Miller KJ, Bookheimer SY, Lavretsky H, Cole GM, Vinters HV, Thompson PM, Huang SC, Satyamurthy N, Phelps ME, Barrio JR. Positron Emission Tomography scanning of cerebral amyloid and Tau deposits in mild cognitive impairment. The New England Journal of Medicine. 2006;355:2652–2663. doi: 10.1056/NEJMoa054625. [DOI] [PubMed] [Google Scholar]
- 14.Mintun MA, Raichle ME, Kilbourn MR, wooten GF, Welch MJ. A quantitative model for the in vivo assessment of drug binding sites with positron emission tomography. Ann Neurol. 1984;15:217–227. doi: 10.1002/ana.410150302. [DOI] [PubMed] [Google Scholar]
- 15.Logan J, Fowler J, Volkow N, Wolf A, dewey S, Schlyer D, Mac-gregor R, Hitzmann R, bendriem B, Gatley S, Christman D. Graphical analysis of reversible redioligand binding from time-activity measurements applied to [N-[C-11]-methyl-(-)-cocaine PET studies in human subjects. J Cereb Blood Flow Metab. 1990;10:740–747. doi: 10.1038/jcbfm.1990.127. [DOI] [PubMed] [Google Scholar]
- 16.Logan J, Fowler JS, Volkow ND, Wang GJ, Ding YS, Alexoff DL. Distribution volume ratios without blood sampling from graphical analysis of PET data. J Cereb Blood Flow Metab. 1996;16:834–840. doi: 10.1097/00004647-199609000-00008. [DOI] [PubMed] [Google Scholar]
- 17.Lammertsma AAHS. Simplified reference tissue model for PET receptor studies. Neruoimage. 1996;4:153–158. doi: 10.1006/nimg.1996.0066. [DOI] [PubMed] [Google Scholar]
- 18.Gunn R, Lammertsma AA, Hume SP, Cunningham VJ. Parametric imaging of ligand-receptor binding in PET using a simplified reference region model. Neuroimage. 1997;6:279–287. doi: 10.1006/nimg.1997.0303. [DOI] [PubMed] [Google Scholar]
- 19.Zasadny K, Wahl RL. Standardized uptake values of normal tissues at PET with 2-[fluorine-18]-fluoro-2-deoxy-D-glucose: variation with body weight and a method for correction. Radiology. 1993;189:847–850. doi: 10.1148/radiology.189.3.8234714. [DOI] [PubMed] [Google Scholar]
- 20.Keyes JJ. SUV: standard uptake or silly useless value? J Nucl Med. 1995;36:1836–1839. [PubMed] [Google Scholar]
- 21.Huang S. Anatomy of SUV (Standardized Uptake Value) Nucl Med Biol. 2000;27:643–646. doi: 10.1016/s0969-8051(00)00155-4. [DOI] [PubMed] [Google Scholar]
- 22.Wong C, Thie J, Parling-Lynch KJ, Zakalik D, Margolis JH, Gaskill M, Hill J, Qing F, Fink-Bennett D, Nagle C. Glucose-normalized standardized uptake value from (18)F-FDG PET in classifying lymphomas. J Nucl Med. 2005;46:1659–1663. [PubMed] [Google Scholar]
- 23.Hattori N, Bergsneider M, Wu HM, Glenn TC, Vespa PM, Hovda DA, Phelps ME, Huang SC. Accuracy of a method using short inhalation of O-15-O2 for measuring cerebral oxygen extraction fraction with PET in healthy humans. journal of Nuclear Medecine. 2004;45:765–770. [PubMed] [Google Scholar]
- 24.Bergsneider M, Hovda DA, Lee SM, Kelly DF, McArthur DL, Vespa PM, Lee JH, Huang SC, Martin NA, Phelps ME, Becker DP. Dissociation of cerebral glucose metabolism and level of consciousness during the period of metabolic depression following human traumatic brain injury. J Neurotrauma. 2000;17:389–401. doi: 10.1089/neu.2000.17.389. [DOI] [PubMed] [Google Scholar]
- 25.Bergsneider M, Hovda DA, McArthur DL, Etchepare M, Huang SC, Sehati N, Satz P, Phelps ME, Becker DP. Metabolic recovery following human traumatic brain injury based on FDG-PET: time course and relationship to neurological disability. Journal of Head Trauma Rehabilitation. 2001;16:135–148. doi: 10.1097/00001199-200104000-00004. [DOI] [PubMed] [Google Scholar]
- 26.Wu HM, Huang SC, Hattori N, Glenn TC, Vespa P, Yu CL, Hovda DA, Phelps ME, Bergsneider M. Selective metabolic reduction in gray matter acutely following human traumatic brain injury. J Neurotrauma. 2004;21:149–161. doi: 10.1089/089771504322778613. [DOI] [PubMed] [Google Scholar]
- 27.Wu HM, Huang SC, Hattori N, Glenn TC, Vespa PM, Hovda DA, Bergsneider M. Subcorticle white matter metabolic changes remote from focal hemorrhagic lesions suggest diffuse injury following human traumatic brain injury (TBI) Neurosurgery. 2004;55:1306–1317. doi: 10.1227/01.neu.0000143028.08719.42. [DOI] [PubMed] [Google Scholar]
- 28.Lin KP, Huang SC, Baxter L, Phelps ME. Trans Nucl Sci. Vol. 41. IEEE; 1994. A general technique for inter-study registration of multifunction and multimodality images; pp. 2850–2855. [Google Scholar]
- 29.Leow A, Yu CL, Lee SJ, Huang SC, Nicolson R, Hayashi KM, Protas H, Toga AW, Thompson P. Brain structural mapping using a noval hybrid implicit/explicit framework based on the level-set method. NeuroImage. 2005;24:910–927. doi: 10.1016/j.neuroimage.2004.09.022. [DOI] [PubMed] [Google Scholar]
- 30.Minoshima S, Koeppe RA, Frey KA, Kuhl DE. Anatomic standardization: linear scaling and nonlinear warping of functional brain images. Journal of Nuclear Medecine. 1994;35:1528–1537. [PubMed] [Google Scholar]
- 31.Ashburner J, Friston KJ. Voxel-based morphometry: the methods. Neruoimage. 2000;11:805–821. doi: 10.1006/nimg.2000.0582. [DOI] [PubMed] [Google Scholar]
- 32.Matsuda H. Role of neuroimaging in Alzheimer's disease, with emphasis on brain perfusion SPECT. J Nucl Med. 2007;48:1289–1300. doi: 10.2967/jnumed.106.037218. [DOI] [PubMed] [Google Scholar]
- 33.Wu HM, Sui G, Lee CC, Ladno W, Prins ML, Tseng HR, Phelps ME, Huang SC. Application of integrated microfluidics to small animal positron emission tomography to obtain fully quantitative in vivo imaging. Journal of Nuclear Medecine. 2006;47:55. [Google Scholar]
- 34.Wu HM, Shoghi-Jadid K, Schiepers C, Chatziioannou A, Huang SC. Derivation of input function from dynamic FDG-microPET images of mice. 2002:s43. [Google Scholar]
- 35.Kim J, Herrero P, Sharp T, Laforest R, Rowland DJ, Tai YC, Lewis JS, Welch MJ. Minimally invasive method of determining blood input function from PET images in rodents. J Nucl Med. 2006;47:330–336. [PubMed] [Google Scholar]
- 36.Ferl GZ, Wu H, Zhang X, Huang S. Estimation of FDG input function in mice using a compartmental model fitted to dynamic microPET data and 2 blood samples. Journal of Nuclear Medecine. 2007;48 2:96P–97P. doi: 10.2967/jnumed.107.041061. [DOI] [PMC free article] [PubMed] [Google Scholar]
- 37.Huang S, Wu HM, Truong D, Prins M, Zhang X, Stout DB, Chatziionanou AF, Schelbert HR. A Public Domain Dynamic Mouse FDG MicroPET Image Data Set for Evaluation and Validation of Input Function Derivation Methods. IEEE Medical Imaging Conference Record. 2006 [Google Scholar]
- 38.Huang SC, Truong D, Wu HM, Chatziioannou AF, Shao W, Wu AM, Phelps ME. An Internet-based Kinetic Imaging System (KIS) for MicroPET. Molecular Imaging and Biology. 2005;7:330–341. doi: 10.1007/s11307-005-0014-3. [DOI] [PMC free article] [PubMed] [Google Scholar]