

Abstract
Magentic Reasonance Imaging for mouse phenotype study is one of the important tools to understand human diseases. In this paper, we present a fully automatic pipeline for the process of morphometric mouse brain analysis. The method is based on atlas-based tissue and regional segmentation, which was originally developed for the human brain. To evaluate our method, we conduct a qualitative and quantitative validation study as well as compare of b-spline and fluid registration methods as components in the pipeline. The validation study includes visual inspection, shape and volumetric measurements and stability of the registration methods against various parameter settings in the processing pipeline. The result shows both fluid and b-spline registration methods work well in murine settings, but the fluid registration is more stable. Additionally, we evaluated our segmentation methods by comparing volume differences between Fmr1 FXS in FVB background vs C57BL/6J mouse strains.
Keywords: segmentation, registration, atlas-based, bspline, fluid, mouse brain
1. Introduction
As genome sequencing and altering techniques advance, mouse phenotype models designed for studying human diseases have increasingly been developed, for example, Autism mouse models,1–3 the Reeler mouse4 and Shiverer mouse model.5 A good overview on the generation and analysis of mouse phenotype with imaging means has been written by Nieman.6 Several researchers have used Magnetic Reasonance Imaging (MRI) for phenotype studies employing volumetric measurement,7, 8 deformation field analysis,9 diffusion tensor based analysis,10, 11 3D shape analysis12 and more.
The regional segmentation of the mouse brain is an elementary step for such phenotype study. While the segmentation techniques for the human brain have reached a mature stage for many neuroimaging applications, the segmentation of the mouse brain has received thus far less attention.4, 13 As pointed out in,6, 13 however, the direct application of the human segmentation tools may not be successful as the settings of mouse brain segmentation differs in several ways:
The lower variance of murine structures as compared to human structures necessitates high fidelity segmentation algorithms that have a strong reliability and repeatability properties.
The scale of structures of rodents is smaller than human structure, and relative scales of the individual structures are different.
The murine neocortex is not folded and thus folding patterns cannot be used for establishing localized correspondence. Cortical thickness algorithms, for example, usually depend on the existence of such folding patterns.
The murine brain contains proportionally considerably less white matter than human brains, the same is true for the cerebro-spinal parts. Human brain based segmentation algorithms are often based on tissue segmentation methods for skull stripping, intensity inhomogeneity correction and intensity calibration.14 Such methods clearly need to be adapted to work with the murine brain.
In our study, we are presenting a fully automatic pipeline for brain morphometry analysis aiming at characterizing mouse phenotypes in regard to both brain structural volume and regional diffusion tensor properties. As a first step in this research, we adapted an atlas-based automatic segmentation technique used for segmenting human subcortical structures into murine full brain segmentation. Since the method was developed for human brain, it is necessary to evaluate the application results in quantitative and qualitative way in the murine setting. In following sections we briefly describe the pipeline of our segmentation method and present the evaluation results - the accuracy and repeatability tests. Finally, we compare the two methods by analyzing the volumetric differences of brain structures in FVB and C57BL/6J strains in order to evaluate the methods in a quantitative analysis framework.
2. Methods
In this paper, we adapt an existing human subcortical brain structure segmentation method14 to murine brain segmentation. The core of this approach is based on the registration of an atlas with prior probabilistic information of tissue and region of interest associations onto the each dataset to be segmented. As described in,14 the whole process can be separated into an atlas building step and segmentation step, which are both described in further detail below.
2.1 FVB mice Specimen Preparation & Image Acquisition
Mice for these studies were a subset of the subjects described in,15 and included 5 Fmr1 +/y (wildtype) and 5 Fmr1 −/y (knockout) males, all on a FVB/N-129/OlaHsd (FVB/129) strain background. Weights of mice ranged from 24-28 g at the time of testing. Mice were assayed for social behavior at the age of 2-3 months. For specimen preparation, mice were deeply anesthetized and then perfused through the left ventricle with 30 mL of phosphate-buffered saline (PBS, pH 7.4) at room temperature. This was followed by infusion with 30 mL of iced 4% paraformaldehyde (PFA) in PBS. The remaining skull structures containing the brain were allowed to postfix in 4% PFA at 4 degree for overnight. Following an rinse period of 5 days in PBS on shaker in coldroom without azide, the heads were sent to Mike Tyszka by FEDEX on ice in PBS. After transfer, the heads were removed along with the skin, lower jaw, ears and the cartilaginous nose tip, followed by soak in ProHance.
MRI diffusion images were acquired using a conventional pulsed-gradient spin echo (PGSE) sequence (TR/TE = 100ms/11.6ms, 256 × 128 × 128 matrix, 100μm isotropic voxel size, 1 average, δ = 3ms, Δ = 5ms, Gd = 750mT/m, nominal b-factor= 1450s/mm2). Twenty-five diffusion weighted images were acquired with directions evenly distributed over angular space by an approximate solution to the Thomson electrostatic repulsion problem. Additional 5 images without diffusion weighting were acquired. Total imaging time per brain was 13 hours and 40 minutes. This approach, while less efficient than EPI or RARE acquisitions, has a very low artifact level and high geometric fidelity.
2.2 Atlas Creation & Skull Stripping
For the atlas creation we employed an existing atlas published online as part of the Brookhaven's C57BL/6J mouse database*. The detailed information of its processing is described here.16 The atlas consists of skull stripped T2*-weighted MRI images from 10 C57BL/6J subjects, each with an individual manual segmentation of twenty brain structures, as well as the mean image and its segmentation computed from the 10 subjects. The high resolution images have 256×256×512 voxel dimensions and isotropic 0.047mm spacing. The computation of the atlas employed an approach of similar nature as used in our segmentation pipeline, but with a different deformable registration method. This atlas is designed to be in the geometric center of the population with average signal intensity. The atlas image computation is summarized as follows: 1) Choose a representative image as the initial average atlas 2) Register cases to the representative image using affine transformation 3) Find the elastic transformation registering the current average atlas to each case 4) Calculate the average transform and the updated average atlas from the transforms 5) Repeat step 4 until converge.
For our atlas-based pipeline, we need an atlas image, regional segmentations and probabilistic tissue maps. For the atlas image and the regional segmentations we use the information in the Brookhaven's C57BL/6J database, but no probabilistic tissue maps exist in this database. The main purpose of the probabilistic atlas maps is to provide prior knowledge at each voxel for the brain skull stripping step using our itkEMS tool, described in more detail in the next section. The tool requires prior probability information for the three tissue types, gray matter(GM), white matter(WM) and cerebro-spinal fluid(CSF). However, regions of white matter and especially CSF are quite small in murine brain and many regions have an image appearance in between white and gray matter. Thus, we defined our tissue probability maps by excluding CSF, and including a new third class representing intermediate GM/WM tissue. The following regions are modeled in this tissue class: striatum (caudate & putamen), thalamus, superior and inferior colliculi.
The probabilistic tissue maps were computed by categorizing the existing individual regional segmentations into WM, GM or intermediate GM. Then, each case was registered to the atlas image using affine transformation and the transformation was applied to the individual segmentation. On a voxel-by-voxel basis, we averaged the individual classes, and then smoothed the resulting maps with a Gaussian smoothing filter of σ = 0.025mm (about a half voxel). Finally, we normalized all images for the voxel-wise probabilities to sum to 1 over all tissue types and created an ”other” class for non-brain tissue locations.
2.3 Segmentation
Our segmentation pipeline for murine brain structure consists of a preprocessing, brain skull stripping and a registration step. The main purpose of preprocessing is to provide initial alignment for brain skull stripping and further deformable registration by bringing images into a common reference frame. Automatic initial alignment can be performed by matching the center of images, center of gravity, or second moments of images. However, since these methods assume the same orientation, we need reorientation beforehand. For automatic reorienation, we use geometric asymmetry of the mouse brain.
As a next step, brain skull stripping, we perform an affine registration of the atlas and its probabilistic prior maps to the dataset. Then, we employ the multichannel, atlas-based segmentation tool itkEMS for the skull stripping using the T2 weighted image, as well other available structural MR images. We employ the DTI derived Mean Diffusivity (MD) image and the isotropic diffusion weighted image (iDWI) as additional MR images for tissue classification in our studies (see also section 2.5). The itkEMS tool classifies images into brain tissue via an Expectation Maximization scheme that computes the tissue classification and performs intensity inhomogeneity correction at the same time. Brain stripping is straightforwardly computed using the hard tissue segmentations as a brainmask. It is noteworthy that any cerebrospinal fluid regions, such as the lateral ventricles, are not included in the brainmask.
Next, we perform the structural segmentation via deformable registration. In this paper, we investigated the use of two registration methods:
Fluid registration:17 This registration computes a fluid-model based deformation field via voxel-by-voxel diffeomorphic mapping from the atlas image to the input image. Since the fluid registration matches intensity directly, an intensity calibration step is important. Intensity calibration is done by quantile histogram matching with 1000 histogram quantiles and 100 matching control points†. We studied the method's sensitivity to the intensity calibration parameter setting further below.
Free-form b-spline registration:18 In this method, a mesh of control points defines a set of 3D b-splines and by adjusting the control points a full free-form space deformation is achieved. In contrast to fluid registration, which uses direct intensity match as a similarity term, b-spline registration employs normalized mutual information. No intensity calibration is required for b-spline registration.
3. Results
We applied to our automatic segmentation pipeline with the different registration methods in two sets of experiments. The first set of experiments assesses accuracy and stability by comparing our automatic segmentation in the individual datasets of the Brookhaven database with known manual segmentations. Figure 2 shows the comparison of the manual segmentations in a representative case from the C57BL/6J Brookhaven database with the segmentation results of the two registration method. Finally, we compare group differences in a comparative study of FVB vs C57BL/6J mouse strains.
Figure 2.

The segmentation result of fluid registration and b-spline registration methods. Each row shows axial, coronal, and saggital plane. In general, both registration methods show good results. Fluid registration tends to capture large deformation resulting in over-segmentation in Olfactory Bulb. In contrast to this, bspline registration shows smooth boundary in Olfactory Bulb but is not able to correctly follow Brain Stem due to its local deformation property.
Accuracy assessment
We tested the accuracy of the automated segmentations using a set of metrics19 calculate Hausdorff distance, average surface distance, and Tanimoto volumetric overlap error for each structure. The Hausdorff distance represents the maximum surface distance. We evaluated these metrics compared to the manual segmentation in all individual images of the C57BL/6J Brookhaven datasets. As one can see in Figure 3, both methods provide quite good results with a few exceptions, such as Brain Stem in the b-spline based segmentation. Most regions show less than 0.04 mm of average distance (less than a single voxel size) and less than 10 % of Tanimoto error.
Figure 3.
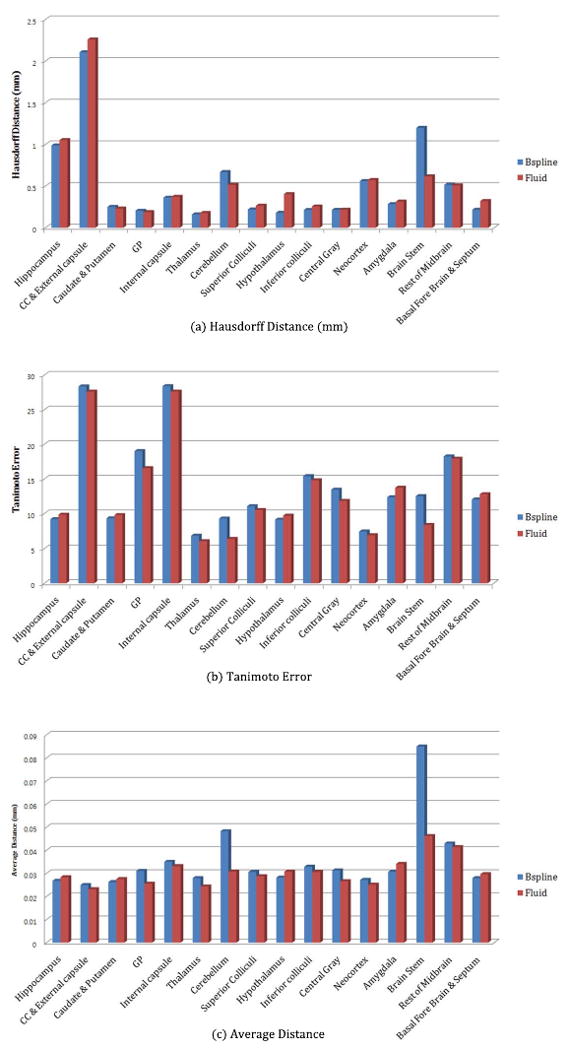
Hausdorff distance, Tanimoto error, and Average distance assessment: Left blue bar is for b-spline registration, and right red bar is the result of fluid registration. Horizontal axis represents the brain structures compared and vertical axis means corresponding measurements. As we see in Figure 3, Bspline registration results for Brain Stem show worse than fluid registration.
Stability against smoothing
We compared the stability of the segmentation results in presence of changes induced by image smoothing. We conducted the segmentations in two different smoothing setting using gradient anisotropic diffusion and curve evolution based smoothing. Both smoothing filter methods are widely used as preprocessing steps and have advantage in that they enhance edges while suppressing noise. We empirically decided on a set of smoothing parameters and used 0.01 and 0.05 time steps and up to 10 and 15 iterations for gradient anisotropic diffusion and curve evolution respectively. We assessed the stability by calculating the coefficients of variance (percent standard deviation over mean volume), which is a normalized measure of dispersion. The result (see Table 3) shows that fluid registration is surprisingly stable. The segmentation result using fluid registration show little variance in structural volume measurements having less than 0.2% COV in all structures. Compared to this, b-spline registration resulted in slightly different results with 0.2% up to 5% COV. When focusing purely on curve evolution smoothing, the two methods are comparably stable (not shown here), i.e., insensitive to smoothing. But the b-spline method shows higher differences in the segmentation when employing anisotropic diffusion based smoothing.
Stability against intensity calibration
In addition to smoothing, we tested the stability of the fluid registration method against changes in the intensity calibration parameters. Since the fluid registration method depends on direct intensity matching, different intensity calibration is likely to influence the result. Surprisingly, as in the above results, fluid registration shows stable results. For the stability against intensity calibration parameters, we varied histogram matching parameters, the number of histogram bins was set to be 32, 100, 1024 and 4096, and the number of quantile control points was changed by 5, 10, 100 and 1000. The computed segmentation volumes showed a coefficient of variance of less than 1% in all of our tests.
Quantitative comparison between FVB and C57BL6/J mice strains
As a last step of our evaluation battery, we applied our automatic segmentation methods in comparative study in FVB and C57BL/6J mouse strains. High resolution MRI images of 10 FVB mice were acquired in a post-mortem, fixed state. MR images consist of a high angular diffusion tensor imaging acquisition sequence and we employed the b=0 T2-weighted image for the regional segmentation. These images have been acquired at 128×99×248 voxel dimensions and 0.1mm voxel spacing.
For comparison we used the Brookhaven C57BL/6J datasets. This comparison is only for the purpose of evaluating the methods in our phenotype analysis framework. Due to differences in image acquisition regarding both protocol and scanner, as well as fixation methodology, the comparison cannot be considered an fully valid comparison of the two strains, but still provides a preliminary evaluation.
For the purpose of evaluating the strain differences in the different brain structures, we segment all images using both methods as described before and then conduct independent two-sample t-test on FVB and C57BL6/J mice. Finally, we compare the results to identify the agreement between the two methods(Table 1).
Table 1.
Two sample t-test results of FXS -/- and C57BL/6J database consisting of 10 subjects each. The volume was normalized by ICV to compare relative volume size by dividing ICV and then multiplying mean ICV. p, μ, and ΔV mean significant probability, mean volume of FXS -/- mice and mean volume difference. **, *, and Δ denote p-value less than 1%, 5%, and 10%
| Structure | B-spline Registration | Fluid Registration | ||||
|---|---|---|---|---|---|---|
| p | μbspline | ΔV | p | μfluid | ΔV | |
| Hippocampus | 0.046* | 27.03 | 1.279 | 0.009** | 27.41 | 1.659 |
| CC & External capsule | 0.000** | 17.49 | 2.716 | 0.045* | 15.91 | 1.139 |
| Caudate & Putamen | 0.047* | 27.81 | 1.234 | 0.102 | 27.61 | 1.030 |
| GP | 0.000** | 4.24 | 0.982 | 0.037* | 3.42 | 0.162 |
| Internal capsule | 0.002** | 3.02 | 0.422 | 0.361 | 2.72 | 0.119 |
| Thalamus | 0.083Δ | 27.91 | 1.067 | 0.696 | 27.08 | 0.232 |
| Cerebellum | 0.000** | 63.58 | 9.300 | 0.000** | 66.06 | 11.783 |
| Superior Colliculi | 0.733 | 8.56 | -0.058 | 0.000** | 9.41 | 0.785 |
| Hypothalamus | 0.000** | 10.44 | -1.398 | 0.011* | 12.80 | 0.962 |
| Inferior colliculi | 0.000** | 7.48 | 1.736 | 0.000** | 6.58 | 0.832 |
| Central Gray | 0.003** | 3.69 | -0.649 | 0.077Δ | 4.54 | 0.201 |
| Neocortex | 0.056Δ | 13.93 | 8.460 | 0.259 | 13.40 | 4.183 |
| Amygdala | 0.000** | 55.73 | 2.329 | 0.000** | 63.07 | 1.802 |
| Rest of Midbrain | 0.002** | 15.13 | 1.555 | 0.233 | 13.99 | 0.412 |
| Basal Fore Brain & Septum | 0.104 | 14.17 | 0.593 | 0.309 | 13.93 | 0.352 |
The two methods, b-spline and fluid registration, agreed on most of structures in regard to the group differences. Major differences were though detected for the superior colliculi and central gray. The superior colliculi region is the part of the intermediate gray matter regions of the brain as mentioned previously. The contrast of these regions with the surrounding regions is lower and this may have affected the segmentation results to be more variable across methods.
4. Conclusion
We adapted automatic human brain segmentation for use in murine brain scale and evaluated the segmentation regarding accuracy and repeatability with two different registration methods. Fluid and B-spline registration method employed in this paper showed similar performance in accuracy. Fluid registration showed better stability against smoothing. Finally, the comparison of FVB vs C57BL/6J mouse strains illustrated our driving application of using the presented segmentation pipeline for mouse phenotype quantification. Overall we can conclude from our evaluations that we can recommend the use of either method.
Figure 1.

Segmentation Framework Pipeline using Probabilistic Atlas and Registration. In the skull stripping step (2), the atlas template and individual labels are mapped to the target image using an affine transformation, which are reused in step (3) for the purpose of an initial registration.
Figure 4.
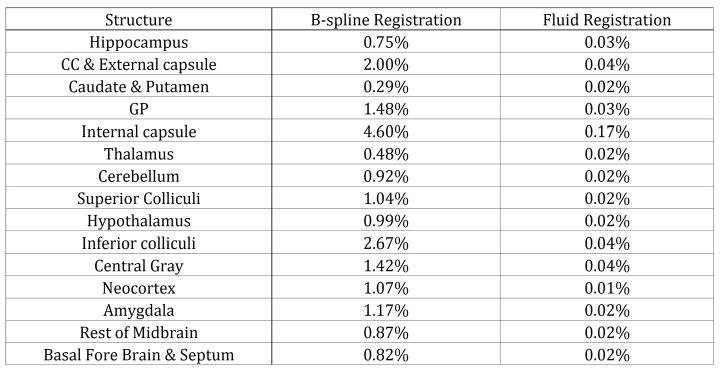
Stability against smoothing of b-spline and fluid registration. The value is the coefficient of variance(σv / μv) of the volume of structures.
Footnotes
The Brookhaven's C57BL/6J mouse database can be found at http://www.bnl.gov/CTN/mouse/
itkHistogramMatchingImageFilter
References
- 1.Moy SS, Nadler JJ, Young NB, Perez A, Holloway LP, Barbaro RP, Barbaro JR, Wilson LM, Threadgill DW, Lauder JM, Magnuson TR, Crawley JN. Mouse behavioral tasks relevant to autism: phenotypes of 10 inbred strains. Behav Brain Res. 2007 Jan;176:4–20. doi: 10.1016/j.bbr.2006.07.030. [DOI] [PMC free article] [PubMed] [Google Scholar]
- 2.Insel TR. Mouse models for autism: report from a meeting. Mammalian Genome. 2001 October;12:755–757. doi: 10.1007/s00335-001-4006. [DOI] [PubMed] [Google Scholar]
- 3.Murcia CL, Gulden F, Herrup K. A question of balance: a proposal for new mouse models of autism. International journal of developmental neuroscience : the official journal of the International Society for Developmental Neuroscience. 2005;23(2-3):265–275. doi: 10.1016/j.ijdevneu.2004.07.001. [DOI] [PubMed] [Google Scholar]
- 4.Badea A, Nicholls PJ, Johnson GA, Wetsel WC. Neuroanatomical phenotypes in the reeler mouse. NeuroImage. 2006 doi: 10.1016/j.neuroimage.2006.09.053. [DOI] [PMC free article] [PubMed] [Google Scholar]
- 5.Tyszka JM, Readhead C, Bearer EL, Pautler RG, Jacobs RE. Statistical diffusion tensor histology reveals regional dysmyelination effects in the shiverer mouse mutant. NeuroImage. 2006 Feb;29:1058–65. doi: 10.1016/j.neuroimage.2005.08.037. [DOI] [PMC free article] [PubMed] [Google Scholar]
- 6.Nieman BJ, Bock NA, Bishop J, Chen XJ, Sled JG, Rossant J, Henkelman RM. Magnetic resonance imaging for detection and analysis of mouse phenotypes. NMR in biomedicine. 2005 Nov;18:447–68. doi: 10.1002/nbm.981. [DOI] [PubMed] [Google Scholar]
- 7.Bock NA, Kovacevic N, Lipina TV, Roder JC, Ackerman SL, Henkelman RM. In vivo magnetic resonance imaging and semiautomated image analysis extend the brain phenotype for cdf/cdf mice. J Neurosci. 2006 April;26:4455–4459. doi: 10.1523/JNEUROSCI.5438-05.2006. [DOI] [PMC free article] [PubMed] [Google Scholar]
- 8.Niessen HG, Angenstein F, Vielhaber S, Frisch C, Kudin A, Elger CE, Heinze HJ, Scheich H, Kunz WS. Volumetric magnetic resonance imaging of functionally relevant structural alterations in chronic epilepsy after pilocarpine-induced status epilepticus in rats. Epilepsia. 2005 July;46:1021–1026. doi: 10.1111/j.1528-1167.2005.60704.x. [DOI] [PubMed] [Google Scholar]
- 9.Chen XJ, Kovacevic N, Lobaugh NJ, Sled JG, Henkelman RM, Henderson JT. Neuroanatomical differences between mouse strains as shown by high-resolution 3d mri. Neuroimage. 2006 January;29:99–105. doi: 10.1016/j.neuroimage.2005.07.008. [DOI] [PubMed] [Google Scholar]
- 10.Bockhorst KH, Narayana PA, Liu R, Ahobila-Vijjula P, Ramu J, Kamel M, Wosik J, Bockhorst T, Hahn K, Hasan KM, Perez-Polo JR. Early postnatal development of rat brain: In vivo diffusion tensor imaging. Journal of Neuroscience Research. 2008;86(7):1520–1528. doi: 10.1002/jnr.21607. [DOI] [PubMed] [Google Scholar]
- 11.Boska MD, Hasan KM, Kibuule D, Banerjee R, McIntyre E, Nelson JA, Hahn T, Gendelman HE, Mosley RL. Quantitative diffusion tensor imaging detects dopaminergic neuronal degeneration in a murine model of parkinson's disease. Neurobiology of disease. 2007 June;26:590–596. doi: 10.1016/j.nbd.2007.02.010. [DOI] [PMC free article] [PubMed] [Google Scholar]
- 12.Lerch JP, Carroll JB, Dorr A, Spring S, Evans AC, Hayden MR, Sled JG, Henkelman RM. Cortical thickness measured from mri in the yac128 mouse model of huntington's disease. NeuroImage. 2008 June;41:243–251. doi: 10.1016/j.neuroimage.2008.02.019. [DOI] [PubMed] [Google Scholar]
- 13.Ali AA, Dale AM, Badea A, Johnson GA. Automated segmentation of neuroanatomical structures in multispectral mr microscopy of the mouse brain. NeuroImage. 2005 Aug;27:425–35. doi: 10.1016/j.neuroimage.2005.04.017. [DOI] [PubMed] [Google Scholar]
- 14.Gouttard S, Styner M, Joshi S, Smith RG, Hazlett HC, Gerig G, Pluim JPW, Reinhardt JM. Subcortical structure segmentation using probabilistic atlas priors. Medical Imaging 2007: Image Processing. 2007;6512:65122J–11. [Google Scholar]
- 15.Moy S, Nadler J, Young N, Nonneman R, Grossman A, Murphy D, Crawley J, Magnuson T, Lauder J. Social approach in genetically-engineered mouse lines relevant to autism. Genes, Brain Behavior. 2008 doi: 10.1111/j.1601-183X.2008.00452.x. in press. [DOI] [PMC free article] [PubMed] [Google Scholar]
- 16.Ma Y, Hof PR, Grant SC, Blackband SJ, Bennett R, Slatest L, McGuigan MD, Benveniste H. A three-dimensional digital atlas database of the adult c57bl/6j mouse brain by magnetic resonance microscopy. Neuroscience. 2005;135:1203–15. doi: 10.1016/j.neuroscience.2005.07.014. [DOI] [PubMed] [Google Scholar]
- 17.Joshi S, Davis B, Jomier M, Gerig G. Unbiased diffeomorphic atlas construction for computational anatomy. NeuroImage. 2004 Jan;23 Suppl 1:S151–60. doi: 10.1016/j.neuroimage.2004.07.068. [DOI] [PubMed] [Google Scholar]
- 18.Rueckert D, Sonoda LI, Hayes C, Hill DL, Leach MO, Hawkes DJ. Nonrigid registration using free-form deformations: application to breast mr images. IEEE Transactions On Medical Imaging. 1999 Aug;18:712–21. doi: 10.1109/42.796284. [DOI] [PubMed] [Google Scholar]
- 19.van Ginneken B, Heimann T, Styner MA. 3d segmentation in the clinic: A grand challenge. Workshop on 3D Segmentation in the Clinic, MICCAI 2007; 2007. pp. 7–15. [Google Scholar]