

Abstract
Recently we have studied thermodynamics of membrane-mediated β-amyloid formation in equilibrium experiments using penetratin-lipid mixtures. The results showed that penetratin bound to the membrane interface in the α-helical conformation when the peptide/lipid (P/L) ratios were below a lipid-dependent critical value P/L∗. When P/L reached P/L∗, small β-aggregates emerged, which served as the nuclei for large β-aggregates. Here we studied the corresponding kinetic process to understand the potential barriers for the membrane-mediated β-amyloid formation. We performed kinetic experiments using giant unilamellar vesicles made of 7:3 DOPC/DOPG. The observed time behavior of individual giant unilamellar vesicles, although complex, exhibited the physical effects seen in equilibrium experiments. Most interestingly, a potential barrier appeared to block penetratin from translocating across the bilayer. As a result, the kinetic value for the critical threshold P/L∗ is roughly one-half of the value measured in equilibrium where peptides bind symmetrically on both sides of lipid bilayers. We also investigated the similarity and differences between the charged and neutral lipids in their interactions with penetratin. We reached an important conclusion that the bound states of peptides in lipid bilayers are largely independent of the charge on the lipid headgroups.
Introduction
In their seminal article that laid the fundamental concept for β-amyloid formation, Jarrett and Lansbury (1) pointed out that the state of proteins often reflects a kinetic effect rather than that of true thermodynamic equilibrium. In a previous study (2), we used penetratin as a model to study the membrane-mediated version of nucleation-dependent amyloid formation. Using peptide-lipid mixtures, we measured the peptide conformation as a function of the peptide/lipid ratio (P/L) and found a well-defined α→β conformation transition as P/L approaches a critical value P/L∗. The conformation transition correlated with peptide's effect on membrane thinning. The peptide thinned the membrane in its α-helix conformation but reversed the thinning effect when it began to form β-aggregates. We would like to ask the following questions:
Will the kinetic process of membrane-mediated amyloid formation follow the same P/L dependence?
Will the potential barriers of the kinetic process obscure the energy levels of peptide conformations seen in equilibrium?
This last question is relevant to the studies of membrane-active peptides in general, where disagreements between kinetic and equilibrium measurements are often the source of confusion. To answer these questions, we observed the kinetic transition of penetratin from its monomeric solution state to β-amyloid via its binding to a giant unilamellar vesicle (GUV). The results of kinetic experiments are usually complex, but with the reference to the equilibrium studies, the complex behavior can be made comprehensible. In particular, the difference on the P/L dependence between the kinetic and the equilibrium results reveals an important potential barrier for peptide translocation across the lipid bilayer.
As far as we know, there have not been many direct comparisons between kinetic experiments and corresponding equilibrium experiments in peptide-membrane interactions. To make such a comparison, a common quantity must be measured in both. The fractional membrane thickness changes that can be measured in equilibrium by x-ray diffraction and the fractional membrane area changes that can be measured in kinetics by GUV experiment are directly related. It is by this relation we were able to make a direct comparison between the kinetic and equilibrium measurements.
The peptide penetratin (3) and β-amyloid protein 1-40 (Aβ 1-40), the major component of Alzheimer's disease amyloid plaque (1) exhibited the same membrane-mediated conformation changes. Both peptides are random coils in solution but change to α-helical or β-like conformations in the presence of negatively charged lipid membranes. Both peptides change from α→β conformations as the lipid charge increases or as the peptide concentration increases (4–9). However, kinetic experiments with Aβ 1-40 are difficult due to two intrinsic properties of Aβ 1-40. The first is its small effective net charge (4), that makes its apparent partition coefficient to anionic lipids three-orders-of-magnitude smaller than that of penetratin (4,10). The second is its relatively low critical concentration in solution, ∼25 μM (5). As a result, the experimental concentration of Aβ 1-40 has to be kept below 25 μM. The combination of these two factors made the number of Aβ 1-40 bound to a GUV too small to have observable effect. In contrast, there is no apparent critical concentration for penetratin in solution, which makes the peptide convenient for performing GUV experiments. Because of their similar conformation changes induced by membrane binding, penetratin is a good representative for studying the membrane-mediated amyloid formation of Aβ 1-40.
Penetratin has long been studied as a cell-penetrating peptide (11–14). We found interesting contrast between the kinetic behavior of this cell-penetrating peptide and that of antimicrobial peptide melittin (15).
Experiment
Materials
Quantities of 1,2-dioleoyl-sn-glycero-3-phosphocholine (DOPC), 1,2-dioleoyl-sn-glycero-3-phospho-(1′-rac-glycerol) (DOPG), and 1,2-dioleoyl-sn-glycero-3-phosphoethanolamine-n-(Lissamine Rhodamine B Sulfonyl) (Rh-DOPE) were purchased from Avanti Polar Lipids (Alabaster, AL). Penetratin (acetyl-RQIKI WFQNR RMKWK K-amide) was synthesized by GenScript (Piscataway, NJ) to >95% purity. All materials were used as delivered.
Sample preparation for x-ray diffraction and circular dichroism
Penetratin was first dissolved in tetrafluoroethylene. Appropriate amounts of penetratin and lipid of chosen peptide/lipid molar ratio, P/L, were mixed in 1:1 (v/v) chloroform and tetrafluoroethylene, and deposited on a thoroughly cleaned flat substrate (0.3 mg of lipid on 1 cm2 of silicon wafer for x-ray or quartz plate for circular dichroism (CD)). After the solvent was removed in vacuum, the samples were hydrated by saturated water vapor at 35°C overnight (16). The results were well-aligned, parallel, hydrated bilayers as proven by x-ray diffraction. The samples were kept in a temperature humidity chamber during the measurement. All experiments were performed at 25°C.
X-ray lamellar diffraction
The ω-2θ diffraction was collected on a Diffractus 581 (Enraf-Nonius, Delft, The Netherlands) and a four-circle goniometer (Huber Diffraktionstechnik, Rimsting, Germany), with a line-focused Cu Kα source (λ = 1.542 Å) operating at 35 kV and 15–30 mA. The incident beam was collimated by a horizontal soller slit and two vertical slits on the front and the back sides of the soller slit. The horizontal and vertical divergences of the incident beam were 0.23° and 0.3°, respectively. The diffracted beam first passed through a vertical slit and then was discriminated by a bent graphite monochromator before entering a scintillation detector, which was biased to discriminate against higher harmonics and fluorescence. This diffractometer was designed to minimize the background signal, which in turn allowed the measurement of high diffraction orders.
An attenuator was used to prevent the first-order Bragg peak from saturating the detector. Each ω-2θ scan was performed from ω = 0.5° to ω = 6.5° with a step size of Δω = 0.01° (for details see (17)). The scan was repeated 3–5 times for each hydration level and then averaged for data analysis. To use the swelling method (18) for the determination of the diffraction phases, each sample was scanned at several different hydration levels. Unlike neutral lipids, charged lipids tend to absorb excessive water. Pure DOPC/DOPG 7:3 became fully hydrated at 96% relative humidity (RH). At higher RH, the diffraction pattern showed broaden peaks and diminished high Bragg orders, indicating undulation fluctuations of bilayers as in excessive water (19). For samples of P/L = 1:50 and 1:30, the full hydration was reached at 96% RH; P/L = 1:20 at 92% RH.
The procedure of data reduction was described in many of our previous works (17,20). Briefly, the measured diffraction intensity was first corrected for the attenuator absorption and for the detector's dead-time factor. After removing the background, data were corrected for sample absorption and diffraction volume. The integrated peak intensities were then corrected for the polarization and the Lorentz factors. The relative magnitude of the diffraction amplitude was the square-root of the integrated intensity. The phases were determined by the swelling method (18,20). With their phases determined, the diffraction amplitudes can be used to reconstruct the electron density profile of the bilayer.
CD spectra
Spectra were measured in a model No. J-810 Spectropolarimeter (JASCO, Tokyo, Japan). The substrates were oriented normal to the incident light as for the measurement of oriented circular dichroism (21); however, no change of peptide orientation was detected during the changes of temperature or humidity. The background spectrum for each sample was the spectrum for the same amount of lipid on the same substrate. After the background correction, the spectra of different P/L were normalized by the concentration of penetratin in each sample.
GUV experiment
The experiments were performed as described in Sun et al. (22). Briefly, GUVs of chosen lipid composition (7:3 DOPC/DOPG or pure DOPC) plus 0.5 mol % Rh-DOPE were produced in 210 mM sucrose solution by electroformation (22), and were transferred to a control chamber containing 200 mM glucose and 10 mM HEPES (pH 7.0). A GUV was aspirated by a micropipette with a small constant sucking pressure (∼100 Pa producing a membrane tension ∼0.4 mN/m) in the control chamber and then transferred, via a transfer pipette (22), to the observation chamber containing 200 mM glucose, 10 mM HEPES, and penetratin at specified concentrations. The osmolality of every solution used in the GUV experiment was measured by a model No. 5520 dew-point Osmometer (Wescor, Logan, UT). Equi-osmolality between the inside and outside of the GUV was maintained throughout the experiment. The experiment was recorded by fluorescence image using a CoolSNAP HQ2 camera (Nikon, Tokyo, Japan). The phase contrast between the sucrose solution inside the GUV and the glucose solution outside was inspected during many randomly chosen runs to ensure that no change occurred.
Each GUV was observed for ∼10 min after the transfer to the observation chamber, unless it was ruptured. However, the GUV response was analyzed only for the first 5 min, because the osmolality balance could not be guaranteed after ∼5 min due to water evaporation.
Results
Aggregations in multilayers
In previous experiments (2), the peptides aggregates in neutral lipid multilayers were not visible under the microscope. The β-aggregates were inferred by the CD spectra (2). In contrast, the aggregates in the multilayers of anionic lipid mixture DOPC/DOPG 7:3 were visible, at first under microscope (Fig. 1, top) and then, as their size grew bigger, by naked eyes. The aggregates appeared only in samples of P/L above the critical concentration P/L∗ ∼ 1:20. No aggregates were seen in the samples with P/L ≤ 1:20. One sample of P/L = 1:15 showed aggregations but another did not.
Figure 1.
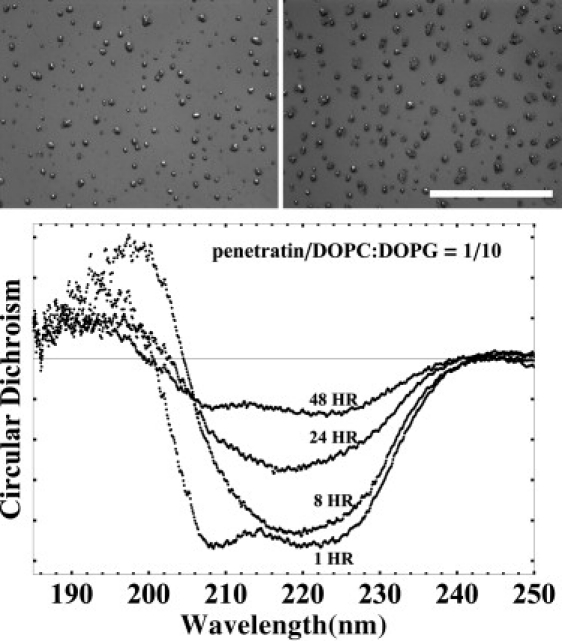
(Top) Microscopic (white light) images of DOPC/DOPG 7:3 multilayers containing penetratin at P/L = 1:12 (left) and at P/L = 1:10 (right). The images were taken two days after sample preparation. The scale bar = 1000 μm. (Bottom) The CD spectra changed with time: example, P/L=1/10, measured at the time shown after sample preparation.
Interestingly, the aggregations in anionic lipid multilayers progressed slowly. Small aggregates began to appear a few hours after the sample preparation, and grew larger with time. The CD spectrum of one sample was recorded continuously for two days (Fig. 1, bottom). At first, the spectrum was α-helical and no aggregates were seen. After a few hours, the spectrum changed to β-like and aggregates were visible under the microscope. Within the next day, the β-like spectrum kept losing its intensity and aggregates became bigger. Finally, the CD reappeared as an α-spectrum but its intensity was much smaller than the initial α-helical spectrum. Different samples changed at different time-rates and the aggregation size also varied, but the pattern of change remained the same as described. The samples seemed to stop changing after 2–3 days when the aggregates were spatially separated by an average distance larger than the size of the aggregates.
CD spectra
CD spectra for one series of DOPC/DOPG 7:3 with P/L = 1:50, 1:30, 1:20, 1:15, 1:12, and 1:10 are shown in Fig. 2 (top). The spectra were measured two days after the sample preparation. The aggregation patterns of P/L = 1:12 and 1:10 are shown in Fig. 1. This P/L = 1:15 sample (whose CD is shown in Fig. 2) did not show visible aggregations, although one other P/L = 1:15 sample did. None of the other samples showed aggregations. The CD spectra were all α-helical-like. In view of the evidence shown in Fig. 1, this indicated that β-aggregates did not contribute to the measured CD due to either light absorption or scattering by the aggregates (21). The intensities of the CD shown in Fig. 2 were normalized by the peptide concentration in each sample. Within the experimental error for CD intensity (∼10%, mainly due to the sample thickness variations), the spectra of penetratin for P/Ls below 1:20 are essentially the same, i.e., the peptides in these samples were all in the α-helical conformation. In P/L = 1:12 and 1:10; only a small fraction of the peptides were in the α-helical conformation, as indicated by their diminished intensities. The rest of the peptides formed β-aggregates that did not contribute to the CD. P/L = 1:15 might have small, invisible β-aggregates, hence somewhat smaller α-helical CD compared with P/L ≤ 1:20. In Fig. 2 (bottom), the P/L dependence of the penetratin conformation in DOPC/DOPG 7:3 is compared to that in pure DOPC (2). They are the same within measurement errors.
Figure 2.
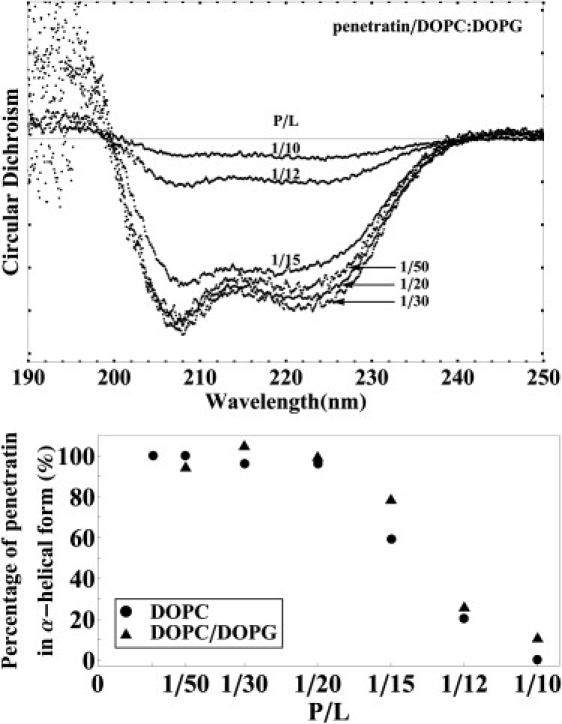
(Top) CD spectra for one series of DOPC/DOPG 7:3 with P/L = 1:50, 1:30, 1:20, 1:15, 1:12, and 1:10, measured two days after the sample preparation. After the removal of lipid background, spectra were normalized according to the peptide density. (Bottom) The fraction of penetratin in the α-helical conformation as a function of P/L. The peptides in β-aggregates did not contribute to the CD spectra due to the ultraviolet absorption or scattering by the aggregates. The average spectrum of P/L = 1:50, 1:30, and 1:20 spectra was taken as the spectrum for 100% in the α–helical state. The percentage was defined by the ratio of the spectral intensity relative to this 100% spectrum. The data for DOPC were reproduced from Lee et al. (2) for comparison.
X-ray diffraction
The electron density profiles constructed from x-ray diffraction are shown in Fig. 3 (top). Each profile peaks at the position of the phosphate group on each side of the bilayer, even if peptides are embedded in the bilayer. This is because diffraction originates from electron density correlations. The interface-bound peptides are poorly correlated in position from layer to layer, therefore do not contribute to the measured electron density profile (2). Thus, the peak-to-peak distance (PtP) corresponds to the phosphate-to-phosphate distance across the bilayer, which is used as a measure of the bilayer thickness. Fig. 3 (bottom) shows the PtP for P/L from 0 to 1:20. We did not measure x-ray diffraction for P/L ≥1:15, because once samples developed aggregates, they were no longer well defined for x-ray analysis (23). The error for PtP was estimated to be ∼±0.1 Å from reproducibility using multiple samples.
Figure 3.
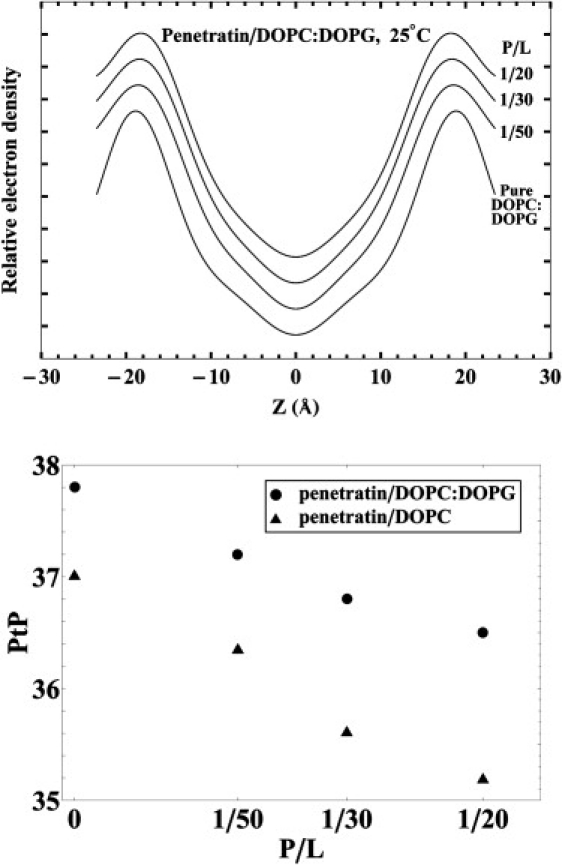
(Top) Electron density profiles across one unit cell obtained from x-ray diffraction for DOPC/DOPG 7:3 with P/L = 0, 1:50, 1:30, and 1:20. (Bottom) The peak-to-peak (PtP) distance of the electron density profile as a function of P/L. The data for DOPC were reproduced from Lee et al. (2) for comparison.
The bilayer of DOPC/DOPG 7:3 (PtP = 37.8 Å) is thicker than pure DOPC bilayer (PtP = 37.0 Å). The degree of thinning per peptide in the former is somewhat smaller than that in the latter (Fig. 3). However, the overall thinning pattern is similar in both cases.
The changes of bilayer thickness occur in the chain region (between the two interfaces of the bilayer). The thickness of the chain region h is obtained from PtP by h ≈ PtP − 10 Å (see (24) for detailed discussions on this relation). Because the volumetric compressibility of lipids is exceedingly small (∼5 × 10⁻⁵ atm−1 (25)), the fractional thickness decrease Δh/h is effectively equal to the fractional membrane area expansion ΔA/A. This relation will be used to relate the membrane-thinning to the area-expansion measured in the GUV experiment.
GUV experiments
The aspiration experiment was designed so that a change of the area/volume ratio in the GUV could be measured by the change of the protrusion length in the micropipette. A GUV was initially aspirated by a micropipette at a tension ∼0.4 mN/m. It was then transferred to the observation chamber and exposed to the penetration solution when the transfer pipe was removed (22). As penetratin diffused and bound to the GUV, we observed the response of the GUV as P/L increased in time. There were two definitive types of response for high and low penetratin concentrations, respectively.
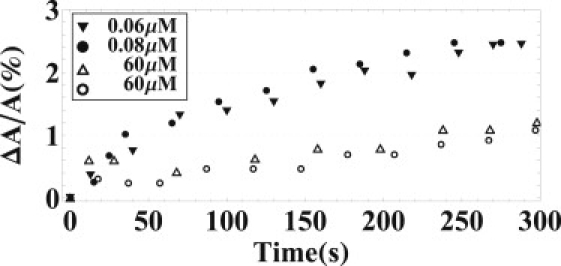
For low penetration concentrations ≤0.08 μM, the protrusion length in the micropipette simply increased with time and reached a plateau ∼200–300 s after the exposure to peptide solution (Fig. 4). The GUVs were observed for another 5 min. In all cases, the protrusion length did not decrease and no aggregations occurred. For high penetration concentrations ≥0.6 μM, the protrusion length first increased, but within ∼40 s (for 0.6 μM) or ∼5 s (for 6 μM), it began to decrease. Soon after the protrusion length began to decrease, aggregates appeared on the surface of the GUV (Fig. 5). After the protrusion length decreased to zero, the changes in the GUV surface area were no longer detectable (indicated by horizontal data points in ΔA/A versus time in Fig. 4).
Figure 4.
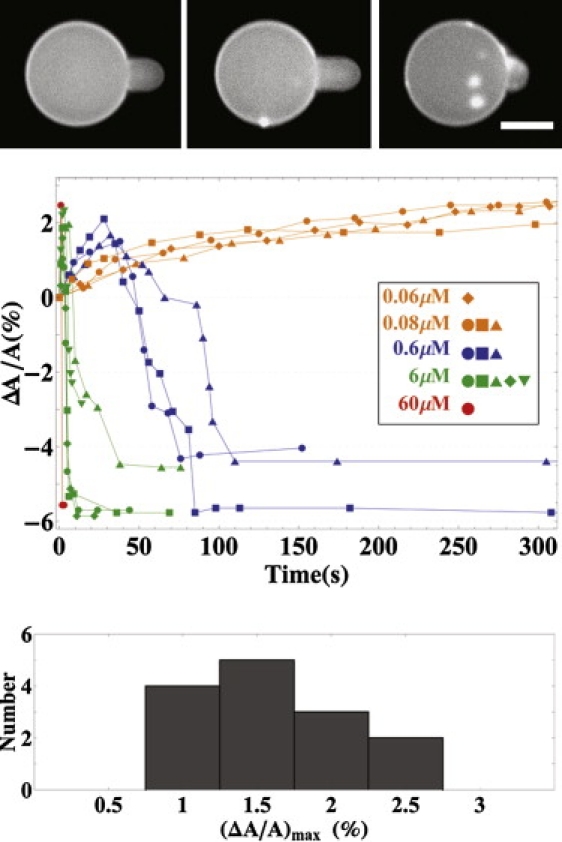
(Top panels) Fluorescence images of a GUV exposed to penetration concentration 0.6 μM in time sequence. (Top, left) For t = 0, the protrusion length was caused by aspiration; thereafter, the pressure inside the micropipette was held constant. (Top, center) For t = 68 s, the protrusion length reached the maximum. (Top, right) For t = 112 s, the protrusion length decreased and aggregates appeared on the GUV surface. (Center panel) The measured protrusion length was converted to the fractional area change ΔA/A plotted versus time for representative runs at penetratin concentrations ≥0.6 μM or ≤0.08 μM. (Bottom panel) Histogram for the maximum values of ΔA/A among 14 high concentration runs (≥0.6 μM). Each column represents the number of runs with the maximum value of ΔA/A falling in the range indicated by the x axis. The scale bar = 20 μm.
Figure 5.
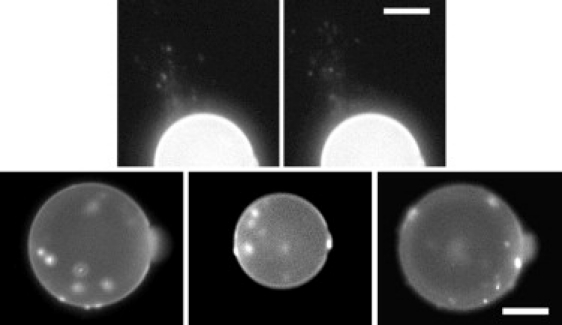
Images of aggregates. (Top) Two fluorescence images showing aggregates coming off the GUV. The right image was 5 s after the left image. (Bottom) Fluorescence images of aggregations appeared in three different GUVs. Because the aggregates moved around, from the time sequences of the images (not shown), one could tell they were all on the GUV surfaces. On the equators (the focal plane), one could tell they were on the outer surface. The scale bar = 20 μm.
For intermediate penetratin concentrations 0.1–0.3 μM, the GUV responses could be either of the low-concentration type or the high-concentration type, and sometimes a combination of the two. That is, the protrusion length increased, decreased, and increased again (not shown). Whenever the protrusion length decreased, concurrently aggregations appeared.
The aggregates moved around the surface of the GUV. Whenever the aggregates appeared on the equator of the GUV (where the microscopic focal plane was set), they could be seen clearly that they were on the outer surface, never on the inner surface (Fig. 5, bottom). This was most clear if seen in time-sequence as the aggregates moved around. Occasionally the aggregates came off the GUV and they always came off outside the GUV, never into the interior of the GUV (Fig. 5, top).
Discussion
Neutral lipid versus anionic lipids
In our previous equilibrium experiment on penetratin-lipid interactions (2), we investigated four different neutral lipids—i.e., DOPC, 1-stearoyl-2-oleoyl-sn-glycero-3-phosphocholine (SOPC), 1-oleoyl-2-myristoyl-sn-glycero-3-phosphocholine (OMPC), and DMPC. It would be desirable to study the corresponding kinetics of penetratin against these neutral lipids. Unfortunately, the binding of penetratin to neutral lipids was simply too slow for kinetic observation. Fig. 6 compared the response of GUVs made of DOPC to the response of GUVs made of DOPC/DOPG 7:3. Even at a peptide concentration 103 times higher, the response of DOPC is still several times smaller than the response of the charged lipid within the experimental time of ∼5 min.
Figure 6.
Comparison of the responses by neutral lipid (DOPC) GUVs (open symbols) and by charged lipid (DOPC/DOPG 7:3) GUVs (solid symbols) exposed to various penetratin concentrations. Note that the penetratin concentrations used for neutral lipid are 103 higher.
Isothermal titration calorimetry measurement by Persson et al. (10) showed that anionic headgroups served the function of attracting the cationic peptides to the vicinity of the GUV. However, the subsequent binding to the bilayer interface was essentially independent of whether the lipid was charged or neutral (10,26,27). We now compare the behavior of penetratin in DOPC and in DOPC/DOPG 7:3 after they bound to the bilayers. The CD and x-ray diffraction results show that the basic phenomenon was the same in both cases. The initial binding thinned the membrane linearly with P/L, and in this region the peptide was in the α-helical conformation (Figs. 2 and 3). There are small quantitative differences. The slope of PtP versus P/L or the degree of thinning per peptide is slightly larger in neutral lipid than in the charged lipid (Fig. 3). For neutral lipids, we found that the maximum thinning was coincidental with the critical P/L∗ above which β-aggregates began to appear. This is also the case for charged lipids. The points of maximum thinning were not determined precisely because only finite numbers of P/L values were measured. However, it is clear that the P/L∗ for both cases are above but close to 1:20. Above P/L∗, the fraction of peptide that remained in the α-helical form as a function of P/L (Fig. 2) is also similar between the neutral and anionic lipids.
The most interesting difference between neutral and charged lipids is in the formation of β-aggregations. In neutral lipids, we could detect the change of peptide conformation from α to β, but aggregates were not visible. In contrast, anionic lipids apparently became part of the aggregate. This process also included neutral lipids, as the lipid dye (0.5% in the lipid composition for GUV) was clearly accumulated in the aggregates (Figs. 4 and 5). As a result, the aggregates in anionic lipid bilayers grew to micron size.
From the similarity of CD and x-ray results between neutral and anionic lipids, we reach an important conclusion that after the initial binding, the peptide-lipid interaction is largely independent of the charge on the headgroup. In all the lipids we have studied, whether neutral or anionic, penetratin was bound to the bilayer interface and was in the α-helical form until P/L reached a lipid-dependent critical value P/L∗. This interfacial interaction facilitates the formation of β-amyloid (2).
Peptide aggregates in lipid multilayers
According to the concept of β-amyloid (1), once the peptides form a nucleus it is thermodynamically favorable for the peptide monomers to bind to the nucleus and subsequent aggregates. The larger the aggregates, the lower the binding energy becomes, due to the larger numbers of binding contacts. Thus, theoretically, once P/L exceeds the critical P/L∗, we should expect all peptides to be turned into β-aggregates (with the exception of a small number of monomers due to the entropic effect.) However, in lipid multilayers, the β-aggregation proceeded rather slowly due to the restricted mobility of the peptide molecules. The progress of aggregation in a P/L = 1:10 sample (of DOPC/DOPG 7:3) was monitored by its CD spectra shown in Fig. 1. (We found that the rate of aggregation varied with samples; the times shown in Fig. 1 could vary by a factor as much as 2 in different samples.) Directly after the sample preparation, the peptides were all still in the α-helical state. But within a few hours, the spectrum became β-like (or α-β mixture but strongly β-like; we do not believe that a standard CD spectral decomposition analysis is meaningful for short peptides (2)). At this point, no aggregates were visible under microscope. The intensity of this β-like spectrum decreased with time. This corresponded to the appearance of visible aggregates, which were at first of small size and which grew larger with time. Apparently large aggregates absorbed or scattered UV light and therefore did not contribute to the CD spectrum. Finally, after two days or so, the spectrum became α-helical with a much smaller intensity. Under the microscope, the sample showed evenly spaced large aggregates (Fig. 1, top). Thereafter, both the spectrum and the appearance of aggregates were stable.
This observation indicates that all penetratin molecules bound to lipid bilayers initially in the α-helical conformation, irrespective of the concentration. But if P/L was >P/L∗, the peptides then aggregated into the β-form. The aggregates apparently incorporated the lipid mixtures as pointed out in the Results. At first, aggregates were small. But as they accumulated more monomers and coalesced with each other, the aggregates finally separated by distances greater than their range of mobility. Therefore, the final aggregation size is determined by the local peptide concentration or P/L, as exampled in Fig. 1.
Kinetics of membrane-mediated β-aggregation
The GUV aspiration experiment was designed to measure the change of the area/volume ratio of the GUV (28). It is important to know that one of the two variables, area or volume, is constant during the change so that the other variable can be measured. We used a sucrose solution inside the GUV and an isotonic glucose solution outside to provide a refractive index contrast, and monitored the phase contrast for a possible change of the GUV content. In all the cases we have examined we did not detect a change of phase contrast during the experiment. We also performed the same experiment with isotonic sucrose solutions both inside and outside. If there were any leakage in the GUV, for instance by small pores, the effect of glucose-sucrose exchange must be stronger than the effect of sucrose-sucrose exchange due to the difference in the molecular weights of the two sugars (15). We found no difference in the GUV responses between these two experiments. We therefore concluded that there was no volume change in the GUVs during our kinetic experiments. This is consistent with previous studies (10,29,30) finding that penetratin did not cause leakage or form pores in membranes.
From the image of GUV we measured the protrusion length Lp inside the micropipette, the GUV radius Rv, and the pipette radius Rp. From the geometry of the GUV one finds the change of membrane area A by ΔA = 2πRpΔLp + 8πRvΔRv, and the change of the GUV volume V by (28)
Under the condition ΔV = 0, the value ΔLp is directly proportional to ΔA:
When a GUV is exposed to a penetratin solution at t = 0, the bound peptide/lipid ratio P/L will increase with time from the initial condition of P/L = 0. We found the responses of GUVs fell into two different types in high and low penetratin concentrations, as described in the Results. We first discuss the high concentration case (≥0.6 μM) in which aggregations occurred. Generally speaking, the kinetic behavior of GUVs was consistent with what we would expect from the equilibrium experiments. As P/L increased, Lp also increased, which implied an area increase. Because
as mentioned in the Results, the area increase corresponded to the membrane thinning measured by x-ray in the low P/L region (Fig. 3). Then Lp increase reached the maximum, corresponding to the maximum thinning at P/L∗. Further increase in P/L caused a decrease of Lp, corresponding to the decrease in membrane thinning, which was measured in neutral lipids (Fig. 6 of (2)) but could not be measured for charged lipids. Concurrently, aggregates appeared on the GUV surface, corresponding to β-aggregate formation as observed in multilayers when P/L exceeded P/L∗ (Fig. 1). The aggregates appeared on the outer surface of the GUV (Fig. 5); most stayed on the outer surface, but some came off the GUV outer surface (Fig. 5, top). This explained why the Lp decreased to a value shorter than its initial length at t = 0 (shown as ΔA/A in Fig. 4), because GUV lost some lipids to the aggregates.
On the other hand, when the penetratin concentrations were low (≤0.08 μM), Lp simply increased to a plateau value. Consistently, no subsequent Lp decrease was observed, nor did aggregation occur. Between the high and low concentration regions, the GUV response could be of either type, most likely due to the probabilistic nature of the actual P/L values on the GUV. Thus, in all cases, the kinetic behavior of the penetratin-GUV interaction was driven by the variable P/L, consistent with the changes of equilibrium state as a function of P/L.
Because the aggregates appeared on the outer surface or came off the outer surface of the GUVs, penetratin appeared not to have translocated across the bilayer. The maximum of the protrusion length increase corresponded to
averaged over 14 runs with penetratin concentrations ≥0.6 μM (Fig. 4). This ΔA/A value is smaller than the corresponding value at the maximum membrane thinning,
measured at P/L∗ in equilibrium (Fig. 3). This discrepancy is contrary to the experiments of melittin which formed pores at a lipid-dependent critical concentration P/L∗ (15,31). In this case, the values of ΔA/A when melittin formed pores in GUVs were consistent with the value of Δh/h at P/L∗ measured in equilibrium (15). The behavior of GUVs with melittin was also consistent with the assumption that melittin translocated across the bilayers and distributed symmetrically on both sides of the GUV bilayers (15). Thus, the asymmetric distribution of penetratin on the GUV might have caused an extra stress on the membrane that accelerated the β-formation at a value of ΔA/A that was smaller than the corresponding value ΔA/A for β-formation in equilibrium.
We now try to understand why the kinetic threshold of ΔA/A for α→β transition is smaller than its corresponding value in equilibrium. In our previous equilibrium studies (2), we analyzed the peptide transition from the α-state to the β-state by their respective chemical potentials,
and
where −εoα and −nεoβ are, respectively, the binding energy of the α-state and the formation energy of the minimum β-aggregate consisting of n monomers; the last term in each chemical potential is the entropic term with
where Nβn is the number of n-meric β-states. What makes the membrane-mediated β-nucleation different from the β-nucleation in solution (1) is the additional second term in μα in the membrane-mediated process, i.e.,
This is the elastic energy of expanding the monolayer area AS per peptide when the monolayer area A has already been stretched by ΔA. Kα/2 is the monolayer stretch coefficient. (Kα is the bilayer stretch coefficient; its value is ∼240 mN/m for most common phosphatidylcholines (32)). The monolayer expansion per peptide, AS = 68.3 Å2 for DOPC/DOPG 7:3, can be measured from the slope of Δh/h versus P/L. (Note that AS = dA/dP = AL (dA/A)/d(P/L) = − AL (dh/h)/d(P/L), where AL is the cross section area per lipid.)
In the equilibrium analysis, we found that the α→β transition occurred when this term reached a critical value at P/L∗. In the equilibrium measurements, the peptides were symmetrically bound to both sides of bilayers, so the peptide bindings were viewed as stretching the monolayer to which the peptides were bound. But in the kinetic experiment, the peptides were bound to the outer monolayer only, yet both leaflets were stretched. Therefore, for the GUV experiment, the stretch coefficient should be twice as large as the value used in equilibrium. That would imply that, in the GUV experiment, the α→β transition should occur at a ΔA/A value one-half of the critical value measured in equilibrium. This theoretical prediction is in marginal agreement with the experimental values given above.
On the other hand, at low penetratin concentrations, the protrusion length Lp increased to plateau values corresponding to (averaged over six runs), larger than the critical at high penetratin concentrations. Such GUV responses at low peptide concentrations were also found in melittin experiments (15); the ΔA/A values of GUVs could grow slowly past the critical value without pore formation. In our case, the ΔA/A values of GUVs grew slowly past the critical value without β-aggregations. We suspect that there might be rate-dependent potential barriers in the kinetics of peptide-membrane interactions. We recall that the rupture tension of GUVs was also found to be rate-dependent by Evans et al. (33). The origin of rate-dependent potential barriers is still poorly understood.
Conclusions
One important question about membrane-active peptides is how their interactions depend on the lipid properties, such as the lipid charge. Typical membrane-active peptides, e.g., antimicrobial peptides and cell-penetrating peptides, are cationic, whereas the charge on cell membranes is either neutral or anionic. Accumulated evidence has now clarified the role of the charge on the lipid headgroup. The charge on the lipid headgroup could increase the apparent partition coefficients to anionic lipids by three-to-five orders of magnitude over that of neutral lipids (26,34) (note that the apparent partition coefficients to anionic lipids are not constant in peptide concentration (26,34).) Persson et al. (10), Beschiaschvili and Seelig (26), and Wieprecht and Seelig (34) have shown that if one excludes the effect of the electrostatic attraction, the surface partition constants (i.e., that measured from the peptide concentration near the vesicle surface) to neutral and anionic lipids are almost the same. The next question is how the peptide interaction after binding depends on the lipid charge. Tamba and Yamazaki (35) have shown that the rate of pore formation by antimicrobial peptide magainin is the same on neutral or anionic lipids, if the peptide concentrations on the surface of the vesicles are the same. Our study here showed that penetratin interactions with DOPC and DOPC/DOPG, both inducing β-amyloid formation via membrane thinning, are closely similar. Peptide-lipid interactions after the interfacial binding typically manifest in membrane thinning and a transition of peptide from its interfacial binding state, to pore formation in the case of antimicrobial peptides or to β-aggregates in the case of penetratin. These after-binding peptide-lipid interactions are largely independent of the charge on the lipid headgroups.
Kinetic processes are often dominated by potential barriers that are absent in equilibrium measurements. Therefore, superficial comparison of kinetic and equilibrium results could lead to contradictions. Here we show that kinetic experiments with GUVs can be directly correlated to equilibrium measurements of peptide-lipid mixtures through the variable ΔA/A. The same correlated studies were previously performed with melittin. The comparison of these two cases revealed a striking difference between these two peptides. In the case of melittin, the critical value of ΔA/A when melittin formed pores in GUVs was the same as measured in the peptide-lipid mixtures (15). In the case of penetratin, the critical value of ΔA/A when penetratin changed from α-monomers to β-aggregates in GUVs is roughly one-half of the critical value measured in peptide-lipid mixtures. The crucial difference seems to be whether the peptide translocates across the bilayer after binding. Melittin seemed to have translocated and distributed symmetrically across the bilayer of the GUV. In contrast, penetratin appeared to have bound to the outer leaflet of the bilayer without translocation. As a result, the elastic energy of membrane expansion per peptide incurred by penetratin in asymmetric binding is twice as large as the value for symmetrically bound penetratin. Superficially, penetratin and melittin are similar except for their charge densities: 7+ out of 16 amino acids for penetratin and 6+ out of 26 for melittin. Melittin is a pore-forming peptide, penetratin is not (10,29,30). Whether the charge density is the key parameter that makes the properties of these two peptides so drastically different in their interactions with membranes is an intriguing question.
Acknowledgments
This work was supported by National Institutes of Health (US) grant No. GM55203 and Robert A. Welch Foundation grant No. C-0991.
References
- 1.Jarrett J.T., Lansbury P.T. Seeding “one-dimensional crystallization” of amyloid: a pathogenic mechanism in Alzheimer's disease and scrapie? Cell. 1993;73:1055–1058. doi: 10.1016/0092-8674(93)90635-4. [DOI] [PubMed] [Google Scholar]
- 2.Lee C.-C., Sun Y., Huang H.W. Membrane-mediated peptide conformation change from α-monomers to β-aggregates. Biophys. J. 2010;98:2236–2245. doi: 10.1016/j.bpj.2010.02.001. [DOI] [PMC free article] [PubMed] [Google Scholar]
- 3.Derossi D., Joliot A.H., Prochiantz A. The third helix of the Antennapedia homeodomain translocates through biological membranes. J. Biol. Chem. 1994;269:10444–10450. [PubMed] [Google Scholar]
- 4.Terzi E., Hölzemann G., Seelig J. Self-association of β-amyloid peptide (1-40) in solution and binding to lipid membranes. J. Mol. Biol. 1995;252:633–642. doi: 10.1006/jmbi.1995.0525. [DOI] [PubMed] [Google Scholar]
- 5.Terzi E., Hölzemann G., Seelig J. Interaction of Alzheimer β-amyloid peptide (1-40) with lipid membranes. Biochemistry. 1997;36:14845–14852. doi: 10.1021/bi971843e. [DOI] [PubMed] [Google Scholar]
- 6.Magzoub M., Eriksson L.E., Gräslund A. Conformational states of the cell-penetrating peptide penetratin when interacting with phospholipid vesicles: effects of surface charge and peptide concentration. Biochim. Biophys. Acta. 2002;1563:53–63. doi: 10.1016/s0005-2736(02)00373-5. [DOI] [PubMed] [Google Scholar]
- 7.Magzoub M., Eriksson L.E., Gräslund A. Comparison of the interaction, positioning, structure induction and membrane perturbation of cell-penetrating peptides and non-translocating variants with phospholipid vesicles. Biophys. Chem. 2003;103:271–288. doi: 10.1016/s0301-4622(02)00321-6. [DOI] [PubMed] [Google Scholar]
- 8.Lindberg M., Biverståhl H., Mäler L. Structure and positioning comparison of two variants of penetratin in two different membrane mimicking systems by NMR. Eur. J. Biochem. 2003;270:3055–3063. doi: 10.1046/j.1432-1033.2003.03685.x. [DOI] [PubMed] [Google Scholar]
- 9.Wong P.T., Schauerte J.A., Gafni A. Amyloid-β membrane binding and permeabilization are distinct processes influenced separately by membrane charge and fluidity. J. Mol. Biol. 2009;386:81–96. doi: 10.1016/j.jmb.2008.11.060. [DOI] [PubMed] [Google Scholar]
- 10.Persson D., Thorén P.E., Nordén B. Application of a novel analysis to measure the binding of the membrane-translocating peptide penetratin to negatively charged liposomes. Biochemistry. 2003;42:421–429. doi: 10.1021/bi026453t. [DOI] [PubMed] [Google Scholar]
- 11.Qian Y.Q., Billeter M., Wüthrich K. The structure of the Antennapedia homeodomain determined by NMR spectroscopy in solution: comparison with prokaryotic repressors. Cell. 1989;59:573–580. doi: 10.1016/0092-8674(89)90040-8. [DOI] [PubMed] [Google Scholar]
- 12.Melikov K., Chernomordik L.V. Arginine-rich cell penetrating peptides: from endosomal uptake to nuclear delivery. Cell. Mol. Life Sci. 2005;62:2739–2749. doi: 10.1007/s00018-005-5293-y. [DOI] [PMC free article] [PubMed] [Google Scholar]
- 13.Fischer R., Fotin-Mleczek M., Brock R. Break on through to the other side—biophysics and cell biology shed light on cell-penetrating peptides. ChemBioChem. 2006;6:2126–2142. doi: 10.1002/cbic.200500044. [DOI] [PubMed] [Google Scholar]
- 14.Duchardt F., Fotin-Mleczek M., Brock R. A comprehensive model for the cellular uptake of cationic cell-penetrating peptides. Traffic. 2007;8:848–866. doi: 10.1111/j.1600-0854.2007.00572.x. [DOI] [PubMed] [Google Scholar]
- 15.Lee M.T., Hung W.C., Huang H.W. Mechanism and kinetics of pore formation in membranes by water-soluble amphipathic peptides. Proc. Natl. Acad. Sci. USA. 2008;105:5087–5092. doi: 10.1073/pnas.0710625105. [DOI] [PMC free article] [PubMed] [Google Scholar]
- 16.Ludtke S., He K., Huang H. Membrane thinning caused by magainin 2. Biochemistry. 1995;34:16764–16769. doi: 10.1021/bi00051a026. [DOI] [PubMed] [Google Scholar]
- 17.Harroun T.A., Heller W.T., Huang H.W. Experimental evidence for hydrophobic matching and membrane-mediated interactions in lipid bilayers containing gramicidin. Biophys. J. 1999;76:937–945. doi: 10.1016/S0006-3495(99)77257-7. [DOI] [PMC free article] [PubMed] [Google Scholar]
- 18.Blaurock A.E. Structure of the nerve myelin membrane: proof of the low-resolution profile. J. Mol. Biol. 1971;56:35–52. doi: 10.1016/0022-2836(71)90082-9. [DOI] [PubMed] [Google Scholar]
- 19.Chen F.Y., Hung W.C., Huang H.W. Critical swelling of phospholipid bilayers. Phys. Rev. Lett. 1997;79:4026–4029. [Google Scholar]
- 20.Olah G.A., Huang H.W., Wu Y.L. Location of ion-binding sites in the gramicidin channel by x-ray diffraction. J. Mol. Biol. 1991;218:847–858. doi: 10.1016/0022-2836(91)90272-8. [DOI] [PubMed] [Google Scholar]
- 21.Wu Y., Huang H.W., Olah G.A. Method of oriented circular dichroism. Biophys. J. 1990;57:797–806. doi: 10.1016/S0006-3495(90)82599-6. [DOI] [PMC free article] [PubMed] [Google Scholar]
- 22.Sun Y., Lee C.C., Huang H.W. The bound states of amphipathic drugs in lipid bilayers: study of curcumin. Biophys. J. 2008;95:2318–2324. doi: 10.1529/biophysj.108.133736. [DOI] [PMC free article] [PubMed] [Google Scholar]
- 23.Warren B.E. Dover Publications; Mineola, NY: 1990. X-Ray Diffraction. [Google Scholar]
- 24.Huang H.W. Free energies of molecular bound states in lipid bilayers: lethal concentrations of antimicrobial peptides. Biophys. J. 2009;96:3263–3272. doi: 10.1016/j.bpj.2009.01.030. [DOI] [PMC free article] [PubMed] [Google Scholar]
- 25.Seemann H., Winter R. Volumetric properties, compressibilities, and volume fluctuations in phospholipid-cholesterol bilayers. Z. Phys. Chem. 2003;217:831–846. [Google Scholar]
- 26.Beschiaschvili G., Seelig J. Melittin binding to mixed phosphatidylglycerol/phosphatidylcholine membranes. Biochemistry. 1990;29:52–58. doi: 10.1021/bi00453a007. [DOI] [PubMed] [Google Scholar]
- 27.Wenk M.R., Seelig J. Magainin 2 amide interaction with lipid membranes: calorimetric detection of peptide binding and pore formation. Biochemistry. 1998;37:3909–3916. doi: 10.1021/bi972615n. [DOI] [PubMed] [Google Scholar]
- 28.Kwok R., Evans E. Thermoelasticity of large lecithin bilayer vesicles. Biophys. J. 1981;35:637–652. doi: 10.1016/S0006-3495(81)84817-5. [DOI] [PMC free article] [PubMed] [Google Scholar]
- 29.Drin G., Déméné H., Brasseur R. Translocation of the pAntp peptide and its amphipathic analogue AP-2AL. Biochemistry. 2001;40:1824–1834. doi: 10.1021/bi002019k. [DOI] [PubMed] [Google Scholar]
- 30.Thorén P.E., Persson D., Nordén B. The Antennapedia peptide penetratin translocates across lipid bilayers—the first direct observation. FEBS Lett. 2000;482:265–268. doi: 10.1016/s0014-5793(00)02072-x. [DOI] [PubMed] [Google Scholar]
- 31.Lee M.T., Chen F.Y., Huang H.W. Energetics of pore formation induced by membrane active peptides. Biochemistry. 2004;43:3590–3599. doi: 10.1021/bi036153r. [DOI] [PubMed] [Google Scholar]
- 32.Rawicz W., Olbrich K.C., Evans E. Effect of chain length and unsaturation on elasticity of lipid bilayers. Biophys. J. 2000;79:328–339. doi: 10.1016/S0006-3495(00)76295-3. [DOI] [PMC free article] [PubMed] [Google Scholar]
- 33.Evans E., Heinrich V., Rawicz W. Dynamic tension spectroscopy and strength of biomembranes. Biophys. J. 2003;85:2342–2350. doi: 10.1016/s0006-3495(03)74658-x. [DOI] [PMC free article] [PubMed] [Google Scholar]
- 34.Wieprecht T., Seelig J. Isothermal titration calorimetry for studying interactions between peptides and lipid membranes. Curr. Topics Membr. 2002;52:31–56. [Google Scholar]
- 35.Tamba Y., Yamazaki M. Magainin 2-induced pore formation in the lipid membranes depends on its concentration in the membrane interface. J. Phys. Chem. B. 2009;113:4846–4852. doi: 10.1021/jp8109622. [DOI] [PubMed] [Google Scholar]