

Abstract
We model the spectra and excitation dynamics in the phycobiliprotein antenna complex PE545 isolated from the unicellular photosynthetic cryptophyte algae Rhodomonas CS24. The excitonic couplings between the eight bilins are calculated using the CIS/6-31G method. The site energies are extracted from a simultaneous fit of the absorption, circular dichroism, fluorescence, and excitation anisotropy spectra together with the transient absorption kinetics using the modified Redfield approach. Quantitative fit of the data enables us to assign the eight exciton components of the spectra and build up the energy transfer picture including pathways and timescales of energy relaxation, thus allowing a visualization of excitation dynamics within the complex.
Introduction
Optimized excitonic interactions leading to efficient light absorption and energy transfer is particularly salient in those photosynthetic organisms that depend upon such physical interactions for survival. Marine photosynthesis relies heavily on efficient light harvesting throughout the visible part of the spectrum, to utilize most of the available spectral windows at various water depths where chlorophyll (Chl) absorption is minimal (450–640-nm region). In cryptophyte photosynthesis, however, the primary light harvesting for photon capture across this window is ensured by phycobiliproteins. These antennae can absorb a wide range of wavelengths but are typically optimized for the blue and green spectral regions. Recent studies have revealed the critical role of phycobiliproteins in the absorption of green light in the unicellular photosynthetic cryptophyte algae Rhodomonas CS24 and Chroomonas CCMP270 (1). Respectively, these algae contain, in addition to Chl a, Chl c2, and carotenoids, a water-soluble, accessory-antenna-pigment biliprotein complex—Phycoerythrin 545 (PE545) and Phycocyanin 645 (PC645).
In this report, we focus on structure-function relationships in the phycobiliprotein antenna complex PE545 isolated from the unicellular photosynthetic cryptophyte algae Rhodomonas CS24, the crystal structure of which has been determined at 1.63 Å (2) and later at 0.97 Å resolution (3). PE545 consists of four polypeptide chains: α1, and α2 plus two β-subunits, arranged in a complex known by convention as a dimer of αβ monomers. This complex is unusual in that it contains a deep, water-filled slot between the monomers. Each β-subunit is covalently linked to three phycoerythrobilin (PEB) chromophores, labeled PEB82C, PEB158C, PEB50/61C (for subunit C) and PEB82D, PEB158D, PEB50/61D (for subunit D), where the numbers indicate the cysteine residues to which the chromophores are linked. The PEB50/61 chromophores are linked to two cysteine residues, via their A and D pyrroles. Each α-subunit contains a covalently linked 15,16-dihydrobiliverdin (DBV) chromophore, DBVA and DBVB, respectively, which are spectrally red-shifted compared to the PEBs due to extended conjugation.
By following earlier spectroscopic studies of PE545 (4–6), a new series of steady-state and time-resolved experiments have been performed after the discovery of the structure (3,7). These experiments combine the absorption (OD), circular dichroism (CD), fluorescence (FL), and excitation anisotropy (EA) spectroscopies and ultrafast nonlinear techniques, i.e., transient grating (TG) and transient absorption (TA). Interpretation of the data was based on quantum chemical calculations that allowed an estimation of phycobilin excited states and electronic coupling between them using transition density cubes (1,3). A kinetic scheme of energy transfer has been proposed based on Förster theory (3) and generalized Förster theory (1). So far, to our knowledge, there was no consistent model found capable to explain, quantitatively, the observed spectral shapes together with the dynamics of the nonlinear responses. In light of recent work suggesting a role played by quantum-coherence in energy transfer within PE545 (8), it was important to elucidate a model Hamiltonian that could model, accurately, the spectroscopy of PE545, and thereby enable energy transfer to be examined more closely.
In this article, we bring the PE545 modeling to a quantitative level by using the modified Redfield approach. We propose the exciton model based on a quantitative simultaneous fit of seven steady-state spectra (77 K OD, FL, EA and 300 K OD, CD, FL, EA) and 77 K TA responses of the PE545 complex. We assign the eight exciton component of the spectra and determine the timescales of energy transfers among them. This gives insight into the pathways of ultrafast energy relaxation occurring after photoexcitation of PE545, thus allowing a visualization of excitation dynamics within the complex.
Model
The structure of the PE545 complex, from the high-resolution structural model reported in Doust et al. (3), is shown in Fig. 1. A notable feature of the structure is the large average center-to-center spacing between the bilin chromophores relative to the structure of other light-harvesting proteins. Transition dipole moments of each bilin and electronic couplings between the bilins were calculated using the CIS/6-31G method (1,9,10). Calculations were carried out using Gaussian03 (11), as previously described in Scholes et al. (9) and Curutchet et al. (10). The results, reported previously (9), include an account of the screening of the Coulombic couplings by the polarizable surroundings using the polarizable continuum model (PCM) as described by Iozzi et al. (12). We assumed an optical dielectric constant of ɛop = 2 (according to estimation of Jordanides et al. (13) and Renger et al. (14)), and a relative static dielectric constant of ɛst = 15. The latter is not known exactly, but its value has little effect on electronic couplings. The static dielectric constant is only important for the site energies (10); however, in this work we do not calculate the site energies, but instead estimate them by simulation of measured spectra. Because the transition dipole strength of the different pigments in the complex cannot be measured separately, no scaling of the couplings to correct for the expected overestimation of transition dipoles by the CIS method was attempted. However, the average magnitude of the transition dipole (12.51 D) obtained is only ∼10% overestimated with respect to the experimental value (11.25 D) reported in Doust et al. (1), thus indicating that no major corrections to the couplings are expected to occur. The results are listed in Tables 1 and 2.
Figure 1.
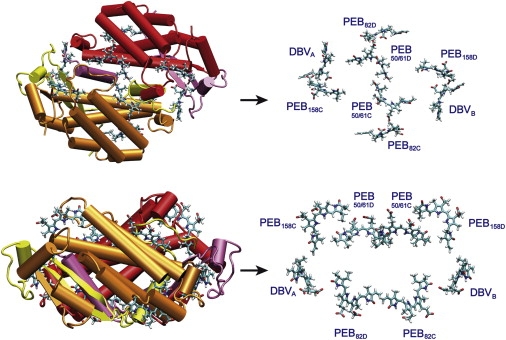
Structure of the PE545 complex, top view (top) and side view (bottom).
Table 1.
Transition dipole moment d (Debye), its components dx, dy, dz (arbitrary units), and center coordinates Rx, Ry, Rz (Å) for each of the eight pigments of PE545
| No. | Pigment | dx | dy | dz | d, Debye | Rx | Ry | Rz |
|---|---|---|---|---|---|---|---|---|
| 1 | PEB50/61C | −0.088 | −2.605 | −4.019 | 12.17 | 8.038 | 25.032 | 37.431 |
| 2 | DBVA | −4.506 | −2.670 | 0.200 | 13.32 | 5.368 | 24.566 | 5.915 |
| 3 | DBVB | 5.102 | 0.280 | 1.574 | 13.59 | −8.024 | 44.047 | 42.084 |
| 4 | PEB82C | 2.898 | 1.310 | −3.721 | 12.44 | 10.976 | 47.584 | 29.106 |
| 5 | PEB158C | 0.448 | −0.873 | 4.691 | 12.18 | 17.923 | 10.988 | 18.324 |
| 6 | PEB50/61D | 0.126 | 2.422 | 3.992 | 11.87 | −3.471 | 17.026 | 27.542 |
| 7 | PEB82D | −3.900 | 2.600 | 1.258 | 12.33 | −16.170 | 30.834 | 12.607 |
| 8 | PEB158D | 1.383 | −4.355 | −1.445 | 12.18 | −11.503 | 24.266 | 50.469 |
The data result from an ab initio calculation using the PCM-CIS/6-31G method with a relative static dielectric constant ɛst = 15 and optical dielectric constant of ɛop = 2.
Table 2.
Couplings between pigments (cm−1) calculated using the PCM-CIS/6-31G method with ɛst = 15 and ɛop = 2.0
| Pigment | PEB50/61C | DBVA | DBVB | PEB82C | PEB158C | PEB50/61D | PEB82D | PEB158D |
|---|---|---|---|---|---|---|---|---|
| PEB50/61C | — | 1 (3) | −37 (−42) | 37 (33) | 23 (29) | 92 (71) | −16 (−15) | 12 (10) |
| DBVA | 1 (3) | — | 4 (−7) | −11 (−17) | 33 (20) | −39 (−44) | −46 (−69) | 3(3) |
| DBVB | −37 (−42) | −4 (−7) | — | 45 (−69) | 3 (4) | 2 (4) | −11 (−17) | 34 (18) |
| PEB82C | 37 (33) | −11 (−17) | −45 (−69) | — | −7 (−7) | −17 (−17) | −3 (−4) | 6 (7) |
| PEB158C | 23 (29) | 33 (20) | 3 (4) | −7 (−7) | — | 18 (16) | 7 (8) | 6 (6) |
| PEB50/61D | 92 (71) | −39 (−44) | 2 (4) | 17 (−17) | 18 (16) | — | 40 (35) | 26 (32) |
| PEB82D | −16 (−15) | −46 (−69) | −11 (−17) | −3 (−4) | 7 (8) | 40 (35) | — | 7 (−7) |
| PEB158D | 12 (10) | 3 (3) | 34 (18) | 6 (7) | 6 (6) | 26 (32) | 7 (−7) | — |
Values predicted by the ideal dipole approximation assuming an effective screening and local field factor s = 0.72 are indicated in parentheses for comparison. The biggest couplings are indicated in bold. The factor s = 9ɛop/(2ɛop+1)2 = 0.72 scaling point dipole couplings is obtained by assuming a Förster screening term (1/ɛop) and Onsager local field factors 3ɛop/(2ɛop+1) for each chromophore (20).
As shown in Fig. 1, the eight pigments of the complex are arranged in two parallel layers. In the first layer (top in Fig. 1), there is strong coupling (92 cm−1) between PEB50/61C and PEB50/61D. In the bottom layer, there are two pairs with moderate coupling, i.e., DBVB-PEB82C and DBVA-PEB82D (45 and 46 cm−1). These two pairs are well separated and almost uncoupled, but they have sizable coupling (33–40 cm−1) with the nearest pigments from the top layer, in particular with the PEB50/61C-PEB50/61D dimer (see Table 2). As a result, it is impossible to find any pigment (or group of pigments) with weak (<30 cm−1) coupling to the remaining molecules of the complex. This means that there are no channels for the Förster-type transfer, so that the complex should be considered as a single strongly coupled cluster with the energy transfer rates calculated in the delocalized basis. To this end, we use the modified Redfield approach (15). Note that, in the presence of weakly coupled clusters within antenna, one should use a combined Förster-Redfield approach (more correct than the pure Redfield theory, which can give strongly overestimated rates for intercluster transfers due to neglect of dynamic localization effects). Relations among the Förster, Förster-Redfield, and Redfield theories are discussed elsewhere (16–19).
The linear and nonlinear spectral responses are calculated using the modified Redfield approach as described in the Supporting Material. The transition frequencies (ωkg and ωqk) and wavefunction amplitudes (cnk and cnmq) needed to calculate linear and nonlinear spectral responses (Eq. S1, Eq. S8, Eq. S9, Eq. S10, Eq. S11, Eq. S12, and Eq. S13 in the Supporting Material) are obtained by diagonalization of one-exciton and two-exciton Hamiltonians. The exciton Hamiltonians are determined by pigment-pigment couplings (Table 2) and any set of the site energies. The static disorder is modeled by uncorrelated shifts of the site energies randomly taken from a Gaussian distribution with a width (full width at half-maximum) of σ = 400 cm−1. This disorder in the chromophore transition energies is caused by slow fluctuations of the protein conformation that directly affects the bilin conformation and its interaction with the immediate protein environment. The unperturbed (unshifted) site energies are free parameters of our model that should be determined from the fit of the spectra using an evolutionary-based search.
Results
Simultaneous fit of spectra and kinetics
Simultaneous fit of the steady-state spectra (OD, CD, FL, and EA) at 77 K and 300 K is shown in Fig. 2. A similar quality of the fit can be obtained for several sets of the site energies. Fitting of the TA kinetics rules out most of them (giving poor TA shapes or wrong timescales of the TA evolution), leading us to one model with the best fit of the steady-state spectra (as shown in Fig. 2) and TA spectra (Fig. 3). The site energies E for this model (denoted below as the “working model”) are listed in Table S2 in the Supporting Material. Exciton structure and energy transfer scheme for this configuration will be discussed in the following sections.
Figure 2.
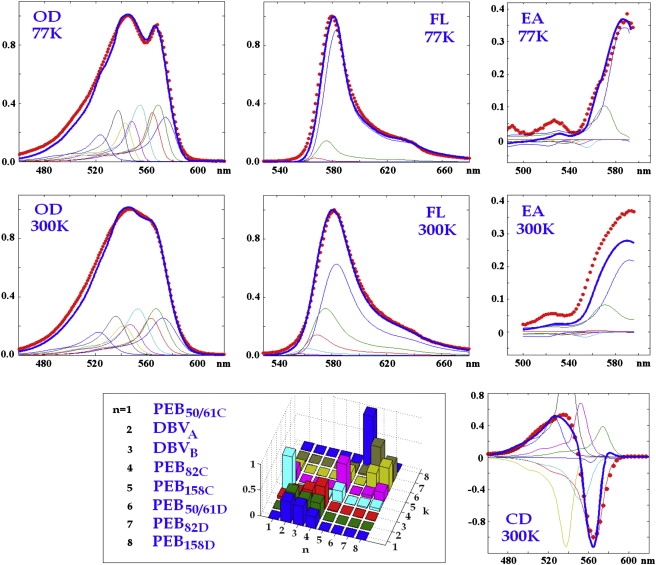
Simultaneous fit of steady-state spectra of PE545, including 77 K OD, FL, EA, and 300 K OD, FL, CD, EA. The spectra are normalized to unity (except EA). (Red points) Experimental data (3); (blue lines) calculated spectra. (Thin lines) Contributions from individual exciton components. Site energies correspond to the model E in Table S2 in the Supporting Material. (Inset) Squared wavefunction amplitudes (cnk)2 (giving participation of the nth pigment in the kth exciton state) are shown for the exciton levels from k = 1 to k = 8 (shown by the same colors as in the calculated spectra). Distribution of the amplitudes is averaged over disorder.
Figure 3.
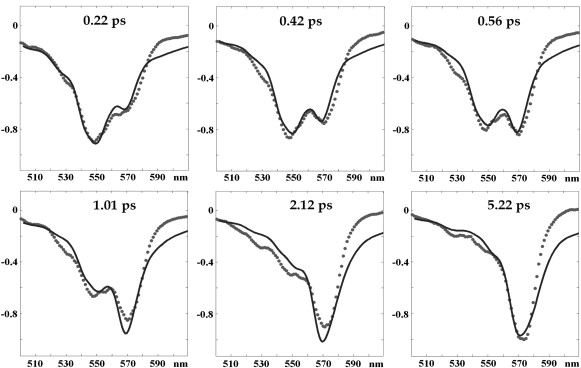
Fitting of the 77 K TA spectra upon 505-nm excitation at pump-probe delays of 0.22, 0.42, 0.56, 1.01, 2.12, and 5.22 ps. (Points) Experimental data (3); (solid lines) calculated spectra. Parameters are the same as in Fig. 2.
It is also useful to compare the working model with other configurations with alternative sets of the site energies. Note that, due to the twofold symmetry of the complex, a permutation of the PEB′C and PEB′D energies (together with permutation of the DBVA and DBVB energies) will have almost no effect on the spectra (although some small difference is still expected due to a little asymmetry revealed by Tables 1 and 2). To exclude analysis of such symmetric configurations, we restrict ourselves to the models with specific asymmetry, for example by fixing the asymmetry of the PEB50/61 dimer. Thus, we consider the models where the PEB50/61D is always higher in energy than PEB50/61C (bearing in mind that symmetric configurations where PEB50/61C is higher are spectroscopically identical). The site energies for alternative models are listed in Table S2.
Exciton structure of the complex
The origins of the eight exciton states of the complex are revealed by the bar plot in Fig. 2, displaying a disorder-averaged participation of the pigments in the exciton states. A character of the participation (i.e., coherent superposition versus noncoherent mixing due to inhomogeneity) can be explored by the density matrices ρ in the site representation calculated for each exciton state as shown in Fig. 4. Diagonal elements ρnn correspond to the site populations, whereas off-diagonal elements ρnm reflect the intersite coherences (between nth and mth site) in each exciton state. Note that the diagonal distributions ρnn for each exciton state are exactly the same as those shown in Fig. 2.
Figure 4.
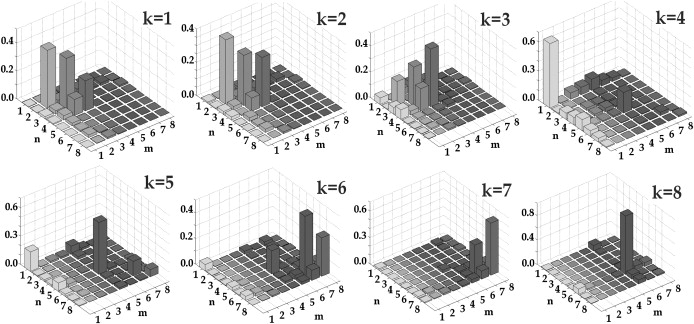
The density matrix ρnm of the pure exciton states, i.e., k = 1, 2, …8. Absolute values of ρnm = cnkcmk averaged over disorder are shown.
The three lowest states k = 1–3 responsible for the 567-nm spectral subband are determined by contributions from DBVA, DBVB, and PEB82C. Note the sizable coherence between DBVB, and PEB82C (off-diagonal elements ρ34 on the k = 1–3 panels), which appears due to the relatively strong coupling (45 cm−1) and small energy difference (Table S2) between these pigments. Coherence between them and DBVA is negligible. This means that, depending on the realization of the disorder, an excitation within the 567-nm band is localized either at DBVA or at the DBVB-PEB82C dimer. Note that DBVA has, on average, a bigger participation in the lowest exciton state (although DBVB has a lower site energy but its reorganization shift is not as large due to coupling to PEB82C).
We have found that DBVA and DBVB should be always on the red-edge to fit the spectra and kinetics, which is consistent with the extra conjugation length in these bilins, but to have enough dipole strength within the 560–575 nm region some other pigment should be also shifted to this region. Possible candidates (giving correct CD shape and right transfer rates) are PEB82C and PEB82D. These two possibilities are not identical, because we consider a specific asymmetry of the C- and D-subunits. In our working model, the PEB82C is red-shifted. An alternative model with the red-shifted PEB82D (model E47 in Table S2) also gives a satisfactory fit (see Discussion and Conclusions below).
The higher 545-nm subband (levels from k = 4 to k = 8) is determined by one of the PEB82 pigments (PEB82D in the working model), two PEB158 and two PEB50/61 pigments. The states k = 4 and 8 correspond to the exciton levels of the PEB50/61C-PEB50/61D heterodimer. Coherence between the two PEB50/61 sites is relatively small due to the big energy gap between them. The k = 5 state is mostly determined by PEB158C with a small contribution of PEB50/61C. A moderate coupling between these sites (23 cm−1) still produces sizable coherence due to the small energy gap between them. The levels k = 6 and 7 are determined by PEB82D and PEB158D with some coherence between them because they are also close in energy. Note, however, that due to weak coupling between these sites (7 cm−1) this coherence most probably will be destroyed by a dynamic localization (a feature that is not included in the modified Redfield approach).
In our model, the excitonic effects produce some redistribution of the dipole strength over the levels but without any significant superradiance. The differences between unperturbed site energies (further increased by the disorder-induced shifts) are much larger than the interpigment couplings, thus producing more or less localized states. Although in some rare realizations the exciton states can be delocalized over two or even three molecules, on average the delocalization size is no more than 1.2–1.3.
Excited-state population dynamics
Dynamics of the one-exciton populations is determined by the doorway amplitudes Dkk(τ) given by Eq. S13. Switching to the site representation we obtain the time-dependent population of the nth site as ρnn(τ) given by Eq. S15. Short-wavelength excitation (505 nm in the TA experiment) populates many exciton states through their vibrational wings. Predominantly excited are higher states of the 545-nm subband (k = 4–8) determined by PEB82D, two PEB158, and two PEB50/61. The highest level determined by PEB50/61D exhibits fast (180 fs) decay, due to relaxation within the PEB50/61 dimer in combination with transfer to other sites. Transfer to DBVA, DBVB, and PEB82C corresponding to energy flow from the 545-nm to 567-nm subband occurs within 2–4 ps. This is followed by slow redistribution within the 567-nm subband within 50 ps and even longer times. The amplitude of these slow components is dependent on the model (see following sections and examples in the Supporting Material).
The dynamics of the site populations can be viewed in relation to the location of the sites within the complex (Fig. 5). In such representation it is convenient to use special initial conditions fixing the excitation at any part of the complex to visualize the following redistribution of populations. This way one can see, simultaneously, the pathways (in real space) and timescales of energy transfers. For example, even upon blue-shifted excitation (i.e., 505 nm) we still excite many exciton states, so that many energy transfer pathways will become hidden. To get more selective excitation (and more directed energy transfer scenario), we suppose that initially only the higher exciton state (localized at PEB50/61D) is excited.
Figure 5.
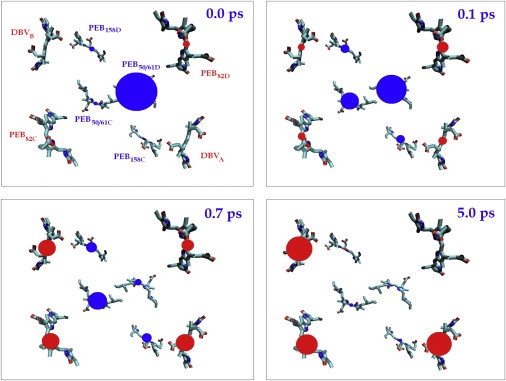
Evolution of the site populations related to their location in real space (with averaging over disorder). The four frames show populations at 0, 0.1, 0.7, and 5 ps delay. Time-dependent area of the circle is proportional to the population of the corresponding site. Initial conditions correspond to selective excitation of the high k = 8 state (mostly determined by PEB50/61D) whereas other (i.e., lower) exciton states are supposed to be nonpopulated (although in reality they would be effectively excited through their vibrational wings). (Red circles) Populations of the peripheral pigments (in bottom view, they appear bigger); (blue circles) other layer containing the initially excited PEB50/61 dimer.
The following history is shown in Fig. 5. The excitation is quickly redistributed within the PEB50/61 dimer in the center of the complex (the fast relaxation is seen already at 100-fs delay). Subsequently, the excitation more slowly migrates to the other layer (shown by red color). At 0.7 ps, population of this layer (DBV and PEB82 bilins) slightly exceeds population of the initially excited layer (the PEB50/61 and PEB158 bilins). After 5 ps, excitation is localized at DBVA, DBVB, and PEB82C. In the top view, this looks like motion from the central dimer to the peripheral sites. Keeping in mind that this picture is averaged over disorder (meaning over many complexes), in a single complex the excitation will be localized at DBVA or at the DBVB-PEB82C pair.
Relaxation rates
In the exciton representation, the relaxation rates are strongly dependent on the realization of the disorder. By arranging the exciton states in increasing order of their energies, we can find different sites participating in the same state (with the same number) depending on relative values of the perturbed site energies. This implies that, when analyzing the relaxation between any pair of exciton levels, one should always check which pigments participate in these states. We did such an analysis for a number of realizations and have found some typical situations briefly described below.
In most realizations, the fastest relaxation is from the highest level of the PEB50/61 dimer, corresponding to the 200–350 fs PEB50/61D → PEB50/61C transfer (the total PEB50/61D lifetime is ∼180 fs due to transfers to other sites). This fast intradimer relaxation is followed by slower transfer from PEB50/61C to DBVB and PEB82C with a time constant of 500–900 fs. However, in some realizations, due to disorder-induced shifts of the site energies, there may be resonance between some other pair of pigments that also produces fast (or even faster) channels. For instance, in ∼10% of the realizations, a resonance between PEB50/61C and DBVB or PEB82C produces the transfers with the 160–200-fs time constant instead of 500–900 fs for the out-of-resonance case.
Equilibration within the 567-nm subband can be faster in ∼20% of the realizations, when DBVB and PEB82C become strongly mixed. Then the relaxation between the corresponding levels can be as fast as 60 fs.
Fast relaxation can be present also within the upper 545-nm subband. Thus, in ∼10% of the realizations there is mixing of PEB50/61C and PEB158C. In these realizations their transition energies (perturbed by the disorder) become close enough to produce a coherent superposition of these sites. This gives rise to fast (sub-100 fs) relaxation between the corresponding levels. In some rare (∼5% of total) realizations there is a resonant mixing of the PEB50/61D and PEB82D sites producing sub-100-fs relaxation between the two higher levels.
The time constants of energy transfer from the nth site to the n′th one (for the working and alternative models) are shown in Table S3 and Table S4. The fastest channels (faster than 1.5 ps) for our working model are shown in Fig. 6, where they are related to the position of the pigments in a real space.
Figure 6.
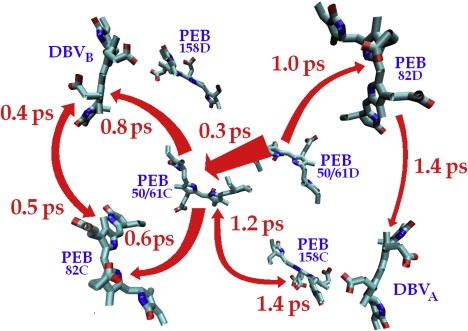
Time constants of energy transfer in the site representation (with averaging over disorder). Transfer pathways with the time constant <1.5 ps are shown.
Exploring models with alternative sets of the site energies
Now we switch to analysis of alternative exciton models (i.e., models with alternative sets of the site energies). First, we explore configurations with different site energies of the PEB50/61 dimer. In the working model the difference of the PEB50/61C and PEB50/61D energies is quite big, producing the two levels corresponding to the redmost (k = 8) and bluemost (k = 4) states of the 545-nm subband. Fixing the PEB50/61D position in the blue side, we can further increase an intradimer asymmetry by moving PEB50/61C to the red into the 567-nm band. After adjustment of the remaining site energies, we can find several models with a reasonable fit of OD, CD, and FL. However, in this case, the EA curves lie very much below the measured ones, giving no more than 0.15–0.2 in the red wing (instead of observed values of 0.37–0.39). Moreover, the interband 545→567 nm transfer becomes 4–5 times faster than measured, due to quick relaxation within the PEB50/61 heterodimer.
Thus, we conclude that both PEB50/61C and PEB50/61D sites should belong to the 545-nm pool. Variation of the site energies within this spectral region has led us to the models with smaller intradimer asymmetry (compared to a working model with very strong asymmetry). The energy gap between the PEB50/61 sites can be reduced by shifting the PEB50/61D to the red, i.e., closer to PEB50/61C. To compensate for this red shift of PEB50/61D, some other pigment must be shifted to the blue. This can be PEB158D, PEB82D, or PEB158C, giving the models E68, E67, and E65, respectively (Table S2). These models yield reasonable linear spectra, but too slow relaxation from the 530-nm region due to the red shift of the upper exciton level of the PEB50/61 dimer (in the working model the 530-nm subband was quickly depopulated due to fast relaxation of this level). An example of the TA fit with the E68 model is shown in Fig. S1.
Alternatively we can produce a configuration with smaller splitting by shifting the PEB50/61C to the blue closer to PEB50/61D. After compensating for this shift by a red shift of PEB82D, we obtain model E17. For this model, the steady-state spectra look good (data not shown), but now the fast intradimer transfer occurs on the blue side with very fast depopulation of the 530-nm band and quick formation of the 540-nm bleaching during the pump pulse. This bleaching must be at 547 nm, but after blue shift of PEB50/61C it moves to 540 nm (see Fig. S2).
We conclude that, to reproduce the initial bleach and ensuing dynamics in the 530–550-nm region, we need to keep the higher level of PEB50/61 heterodimer strongly shifted to the blue. Accordingly, the lowest level must be strongly red-shifted, but still higher in energy than the pigments of the 567-nm pool, otherwise the 545→567 nm transfer becomes too fast.
In work to be published elsewhere (C. Curutchet, J. Kongsted, A. Muñoz-Losa, G. D. Scholes, and B. Mennucci, unpublished), we have run molecular dynamics (MD) simulations of the PE545 protein in water. At each time step we calculated the site transition energy for each chromophore using a combined quantum mechanics and molecular mechanics method that includes, self-consistently, the interaction between the chromophore and solvent (protein-plus-water) polarization (21). We similarly calculated the screened electronic couplings between the chromophores. A result relevant to our work is that the transition energies of PEB50/61C and PEB50/61D are found to be different on average, as predicted by the spectroscopic fitting. Their transitions energies, moreover, were found to change ordering on a timescale of ∼100 ps, showing how the apparent symmetry of the protein is broken in a concerted fashion. The protein structural changes are strongly coupled to the conformations of both PEB50/61C and PEB50/61D owing to their double covalent attachment to the protein. This is shown in Fig. 7. Two snapshots from an MD trajectory are shown superimposed. They correspond to an example of the PEB50/61D chromophore transition being higher in energy than that for PEB50/61C by 100 meV (orange) and an example where that ordering is reversed (light gray). Note how the torsional disorder of both chromophores changes when the energy ordering is flipped. A more detailed report that includes technical details will be forthcoming.
Figure 7.
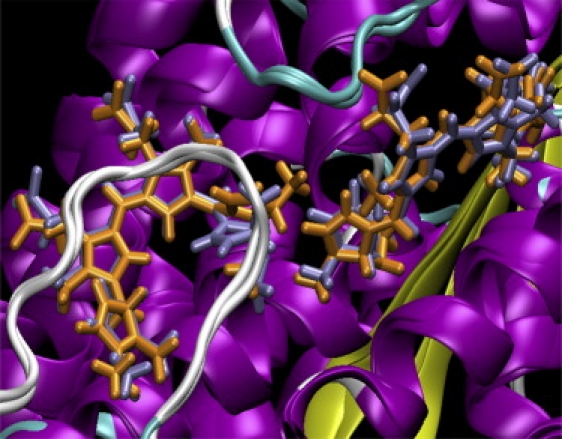
Superimposed representation of the PEB50/61 dimer as obtained in two snapshots from a molecular dynamics simulation of the PE545 complex. The structures illustrate a situation where the PEB50/61D chromophore transition is predicted to be higher in energy than that for PEB50/61C by 100 meV (orange), and an example where that ordering is reversed (light gray) due to a change in the torsional disorder of the chromophores.
By fixing the site energies of the 567-nm pool pigments and the heterodimer PEB50/61, we can further try 1), inversion of the energies of the pseudo-symmetric pairs PEB158C-PEB158D or PEB82C-PEB82D; and 2), a different order of energies for the three lowest pigments (DBVA, DBVB, and PEB82C). With our approach, we have found two alternative models capable of giving a satisfactory fit of the data (i.e., models E47 and E42 discussed in the Supporting Material).
Discussion and Conclusions
A quantitative simultaneous fit of the spectra and TA kinetics allows us to build up the exciton model and energy transfer scheme for the PE545 complex. A systematic study of possible alterations of this model (and analysis of many other configurations appearing in the evolutionary-based search) revealed that a different order of energy within the three redmost pigments (model E42) is possible. Furthermore, permutation of the site energies of PEB82C and PEB82D is not inconsistent with the experimental data (model E47). Although the working model (model E) gives the best fit, the quality of the E42 and E47 models is sufficiently good not to reject them. Additional experiments and calculations would be required to finally fix one of these models. To make the analysis more critical to the parameter choice, one can use a simultaneous fit of several nonlinear responses reflecting different aspects of the dynamics (isotropic and polarized TA, pump-probe and photon echo, etc.), as was demonstrated in our previous studies (22).
All three models give a final localization of the excitation on the peripheral DBVA, DBVB, PEB82C, or PEB82D sites with different (depending on model) contribution of these pigments to the lowest state. Note that models E and E42 differ significantly only in the final phase of slow (5–>50 ps) redistribution between the red pigments. In model E47 the transfers during the 0–5 ps phase are slower, and the final distribution (after a long 50-ps equilibration between DBVB and PEB82D) is more nonuniform than in model E. Thus, model E provides more effective light harvesting. Bearing in mind that model E also gives better fit of the data, we consider it as the working model.
An earlier model based on quantum chemical and exciton calculations (1) suggested a big exciton splitting (∼600 cm−1) between the pair of PEB50/61C and PEB50/61D pigments. The 545-nm band was supposed to consist of two exciton levels of the PEB50/61 dimer. The red 567-nm band is determined by two DBVs, and four states determined by PEB82 and PEB158 pigments were positioned between them. Our model coincides with the main features of this model. The difference is that one of the PEB82 pigments must be on the red together with DBVs.
We confirm a big splitting between exciton levels of the PEB50/61 dimer, but in our model this splitting is determined mostly by the difference in site energies, which significantly exceeds the pure exciton splitting. Note that, in this respect, we use intradimer coupling of 92 cm−1 (Table 2) instead of 300 cm−1 in earlier calculations (1). By comparing new and old sets of couplings, we found that old (bigger) couplings predict too-fast TA kinetics. In particular, conversion from 545 nm to 567 nm would occur on the subpicosecond timescale instead of the measured 2–3-ps kinetics. The main reason why the new set of couplings is smaller in magnitude is the inclusion of screening effects induced by the environment; these had been neglected in the previous calculations.
It can be concluded that the proposed model of the PE545 complex gives a consistent and quantitative picture of the energy transfer and its spectral signatures, thus leading to deeper and more detailed understanding of how this complex performs its function of light harvesting. We find, despite the large energy differences between excitations localized on each bilin in the complex and relatively small electronic couplings between bilins, that excitations are somewhat delocalized. This result provides a molecular-level interpretation of recent two-dimensional photon echo experiments (8). Still, it is striking that average delocalization sizes of only 1.2–1.3 are sufficient to support quantum-coherent energy transfer.
Supporting Material
Four tables, 15 equations, and eight figures are available at http://www.biophysj.org/biophysj/supplemental/S0006-3495(10)00537-0.
Supporting Material
Acknowledgments
V.N. was supported by a visitor's grant from the Netherlands Organisation for Scientific Research, and by grant No. 09-04-00605a from the Russian Foundation for Basic Research. G.D.S. and C.C. acknowledge financial support from the Natural Sciences and Engineering Research Council of Canada.
References
- 1.Doust A.B., Wilk K.E., Scholes G.D. The photophysics of cryptophyte light-harvesting. J. Photochem. Photobiol. Chem. 2006;184:1–17. [Google Scholar]
- 2.Wilk K.E., Harrop S.J., Curmi P.M. Evolution of a light-harvesting protein by addition of new subunits and rearrangement of conserved elements: crystal structure of a cryptophyte Phycoerythrin at 1.63-Å resolution. Proc. Natl. Acad. Sci. USA. 1999;96:8901–8906. doi: 10.1073/pnas.96.16.8901. [DOI] [PMC free article] [PubMed] [Google Scholar]
- 3.Doust A.B., Marai C.N.J., Scholes G.D. Developing a structure-function model for the cryptophyte Phycoerythrin 545 using ultrahigh resolution crystallography and ultrafast laser spectroscopy. J. Mol. Biol. 2004;344:135–153. doi: 10.1016/j.jmb.2004.09.044. [DOI] [PubMed] [Google Scholar]
- 4.Sidler W.A. Phycobilisome and phycobiliprotein structures. In: Bryant D.A., editor. The Molecular Biology of Cyanobacteria, Advances in Photosynthesis. Vol. 1. Kluwer Academic Publishers; Dordrecht, The Netherlands: 1994. [Google Scholar]
- 5.MacColl R., Lam I., Kim J. Exciton splitting in Phycoerythrin 545. J. Biol. Chem. 1994;269:25465–25469. [PubMed] [Google Scholar]
- 6.MacColl R., Eisele L.E., Marrone J. Fluorescence polarization studies on four biliproteins and a bilin model for Phycoerythrin 545. Biochim. Biophys. Acta. 1999;1412:230–239. doi: 10.1016/s0005-2728(99)00063-8. [DOI] [PubMed] [Google Scholar]
- 7.Doust A.B., van Stokkum I.H.M., Scholes G.D. Mediation of ultrafast light-harvesting by a central dimer in Phycoerythrin 545 studied by transient absorption and global analysis. J. Phys. Chem. B. 2005;109:14219–14226. doi: 10.1021/jp051173j. [DOI] [PubMed] [Google Scholar]
- 8.Collini E., Wong C.Y., Scholes G.D. Coherently wired light-harvesting in photosynthetic marine algae at ambient temperature. Nature. 2010;463:644–647. doi: 10.1038/nature08811. [DOI] [PubMed] [Google Scholar]
- 9.Scholes G.D., Curutchet C., Tomasi J. How solvent controls electronic energy transfer and light harvesting. J. Phys. Chem. B. 2007;111:6978–6982. doi: 10.1021/jp072540p. [DOI] [PubMed] [Google Scholar]
- 10.Curutchet C., Scholes G.D., Cammi R. How solvent controls electronic energy transfer and light harvesting: toward a quantum-mechanical description of reaction field and screening effects. J. Phys. Chem. B. 2007;111:13253–13265. doi: 10.1021/jp075411h. [DOI] [PubMed] [Google Scholar]
- 11.Frisch, M. J., G. W. Trucks, …, J. A. Pople. 2004. Gaussian 03, Rev. C.02. Gaussian, Inc., Wallingford, CT.
- 12.Iozzi M.F., Mennucci B., Cammi R. Excitation energy transfer (EET) between molecules in condensed matter: a novel application of the polarizable continuum model (PCM) J. Chem. Phys. 2004;120:7029–7040. doi: 10.1063/1.1669389. [DOI] [PubMed] [Google Scholar]
- 13.Jordanides X.J., Lang M.J., Fleming G.R. Solvation dynamics in protein environments studied by photon echo spectroscopy. J. Phys. Chem. B. 1999;103:7995–8005. [Google Scholar]
- 14.Renger T., Madjet M.E., Renger G. Thermally activated superradiance and intersystem crossing in the water-soluble chlorophyll binding protein. J. Phys. Chem. B. 2009;113:9948–9957. doi: 10.1021/jp901886w. [DOI] [PubMed] [Google Scholar]
- 15.Zhang W.M., Meier T., Mukamel S. Exciton-migration and three-pulse femtosecond optical spectroscopies of photosynthetic antenna complexes. J. Chem. Phys. 1998;108:7763–7774. [Google Scholar]
- 16.Yang M., Fleming G.R. Influence of phonons on exciton transfer dynamics: comparison of the Redfield, Förster, and modified Redfield equations. Chem. Phys. 2002;275:355–372. [Google Scholar]
- 17.Yang M., Damjanović A., Fleming G.R. Energy transfer in photosystem I of cyanobacteria Synechococcus elongatus: model study with structure-based semi-empirical Hamiltonian and experimental spectral density. Biophys. J. 2003;85:140–158. doi: 10.1016/S0006-3495(03)74461-0. [DOI] [PMC free article] [PubMed] [Google Scholar]
- 18.van Grondelle R., Novoderezhkin V.I. Spectroscopy and dynamics of excitation transfer and trapping in purple bacteria. In: Hunter C.N., Daldal F., Thurnauer M.C., Beatty J.T., editors. The Purple Phototrophic Bacteria, Advances in Photosynthesis and Respiration. Vol. 28. Springer; Dordrecht, The Netherlands: 2008. [Google Scholar]
- 19.van Grondelle R., Novoderezhkin V.I., Dekker J.P. Modeling light-harvesting and primary charge separation in photosystem I and photosystem II. In: Laisk A., Nedbal L., Govindjee, editors. Photosynthesis In Silico: Understanding Complexity from Molecules to Ecosystems. Springer; Dordrecht, The Netherlands: 2009. [Google Scholar]
- 20.Knox R.S. Refractive index dependence of the Förster resonance excitation transfer rate. J. Phys. Chem. B. 2002;106:5289–5293. [Google Scholar]
- 21.Curutchet C., Muñoz-Losa A., Mennucci B. Electronic energy transfer in condensed phase studied by a polarizable QM/MM model. J. Chem. Theory Comput. 2009;5:1838–1848. doi: 10.1021/ct9001366. [DOI] [PubMed] [Google Scholar]
- 22.van Grondelle R., Novoderezhkin V.I. Energy transfer in photosynthesis: experimental insights and quantitative models. Phys. Chem. Chem. Phys. 2006;8:793–807. doi: 10.1039/b514032c. [DOI] [PubMed] [Google Scholar]
Associated Data
This section collects any data citations, data availability statements, or supplementary materials included in this article.