

Abstract
i-Motif-forming sequences are present in or near the regulatory regions of >40% of all genes, including known oncogenes. We report here the results of a biophysical characterization and computational study of an ensemble of intramolecular i-motifs that model the polypyrimidine sequence in the human c-MYC P1 promoter. Circular dichroism results demonstrate that the mutant sequence (5′-CTT TCC TAC CCTCCC TAC CCT AA-3′) can adopt multiple “i-motif-like,” classical i-motif, and single-stranded structures as a function of pH. The classical i-motif structures are predominant in the pH range 4.2–5.2. The “i-motif-like” and single-stranded structures are the most significant species in solution at pH higher and lower, respectively, than that range. Differential scanning calorimetry results demonstrate an equilibrium mixture of at least three i-motif folded conformations with Tm values of 38.1, 46.6, and 49.5°C at pH 5.0. The proposed ensemble of three folded conformations includes the three lowest-energy conformations obtained by computational modeling and two folded conformers that were proposed in a previous NMR study. The NMR study did not report the most stable conformer found in this study.
Introduction
Tetraplex DNA structures, e.g., intermolecular and/or intramolecular G-quadruplex and i-motif structures have been known for some time (1,2). C-rich sequences located within 1 kb upstream of ∼40% of all genes (including >50% of the known oncogenes) may form intramolecular i-motif structures. A possible role for these structures in gene regulation represents an emerging area in nucleic acids research (3). It has been proposed that the expression of several oncogenes may be downregulated by the binding of small molecules that can stabilize either G-quadruplex or i-motif DNA structures thus create a silencer element (4–8). The majority of studies performed on non-B-form DNA structures in oncogene promoter regions have focused on the G-quadruplex due to its inherent structural stability at neutral pH. Numerous studies have focused on determining the folding topologies for G-quadruplex-forming sequences, and explored the interactions of small molecules and DNA-binding proteins with G-quadruplex motifs (9–13). In comparison, relatively few studies have been done on the complimentary C-rich i-motif-forming strand.
Because of the duplex nature of DNA in vivo, investigating only the single-stranded G-quadruplex structure represents an incomplete picture of the biologically relevant gene promoter target. We recently reported the results of a computational study in which theoretical structures for the c-MYC nuclease hypersensitivity element (NHE) and c-MYC-NHE complexes with TMPyP4 were described (14). The complete NHE was proposed as a new target for drug binding as it provides new binding pockets in the interface between the G-quadruplex and i-motif components. To better understand gene regulation, the biochemistry and biophysics of the i-motif-forming polypyrimidine strand (15,16) of the c-MYC (or other oncogene) promoter region and/or the i-motif component of the complete NHE must be better characterized. To date, the majority of the studies on i-motif DNA have focused on the formation and stability of a few model intermolecular and intramolecular i-motif structures (15–22). These studies have been successful in characterizing the folding patterns of i-motif structures using NMR (2,19,23,24), x-ray crystallography (20,25), or other spectroscopic techniques (21). Sequences have been identified that favor the formation of intramolecular i-motif structures (17,22,26–30). A recent NMR study by Dai et al. demonstrated that a mutant human c-MYC P1 polypyrimidine promoter sequence can adopt at least two different intramolecular i-motif structures (31). A few studies have explored the impact of solution conditions (e.g., pH, cation, etc.) on the formation and stability of intramolecular i-motif structures (15,23,25,32–34). All of these studies suggest that formation of an intramolecular i-motif is favored at slightly acidic pH where the cytosines are hemiprotonated (cytosine N3 pKa ∼4.58) (35).
In this study, we performed a biophysical characterization of a mutant c-MYC P1 promoter sequence using differentiail scanning calorimetry (DSC) and circular dichroism (CD). The initial focus of exploration was the structure and stability of a mutant i-motif-forming oligonucleotide under a variety of solution conditions, including a range of pH values. The mutant i-motif-forming sequence (5′-CTT TCC TAC CCT CCC TAC CCT AA-3′) was chosen for comparison with a previous NMR study by Dai et al. in which the same sequence was used in an attempt to force the formation of a single folded conformer in acidic solution at pH 5.0 (31). This polypyrimidine sequence was found to exist in solution as an ensemble of intramolecular i-motifs at a pH range from 4.2 to 5.2. We also performed computational studies on the model c-MYC i-motif-forming sequence that are consistent with the proposed ensemble of i-motif structures. The ensemble of intramolecular folded i-motifs includes the two structures found in the NMR study by Dai et al. (31) and at least one other more stable structure having an additional C-H+-C pair interaction.
Materials and Methods
Lyophilized deoxyoligonucleotide was obtained from Oligos Etc. (Wilsonville, OR). The model oligonucleotide was a 23-nt mutant of the c-MYC P1 promoter polypyrimidine sequence. The mutant oligonucleotide sequence (5′-CTT TCC TAC CCT CCC TAC CCT AA-3′) differs from the wild-type sequence in that three C→T and two C→A substitutions have been incorporated, as shown in Scheme 1. DNA samples were prepared by dissolving the oligonucleotide in 1 mL of 0.130 M [K+] BPES. This stock solution was exhaustively dialyzed against two changes of the same buffer (24 h each) at 4°C. DNA concentrations were verified using ultraviolet-visible spectroscopy and a molar extinction coefficient of ɛ260 = 2.15 × 10⁵ M−1 cm−1. The molar extinction coefficient was determined using a nearest-neighbor calculation, ultraviolet-visible thermal denaturation extrapolated back to 298 K (25°C), and/or a total phosphate-analysis technique (36).
Scheme 1.
| 1 | 2 | 3 | 4 | 5 | 6 | 7 | 8 | 9 | 10 | 11 | 12 | 13 | 14 | 15 | 16 | 17 | 18 | 19 | 20 | 21 | 22 | 23 | |||
|---|---|---|---|---|---|---|---|---|---|---|---|---|---|---|---|---|---|---|---|---|---|---|---|---|---|
| WT | 5′ | C | T | T | C | C | C | C | A | C | C | C | T | C | C | C | C | A | C | C | C | T | C | C | 3′ |
| ↓ | ↓ | ↓ | ↓ | ↓ | |||||||||||||||||||||
| WT | 5′ | C | T | T | T | C | C | T | A | C | C | C | T | C | C | C | T | A | C | C | C | T | A | A | 3′ |
The wild-type (WT) polypyrimidine 23mer i-motif-forming sequence of the human c-MYC NHEIII1 P1 promoter region and its mutant 23mer derivative. The mutant sequence was created by making C→T mutations at bases 4, 7, and 16, as well as C→A mutations at bases 22 and 23.
CD spectra were collected using a JASCO J-815 CD spectropolarimeter (Easton, MD). Oligonucleotide solutions were prepared with a nominal absorbance of 0.6 AU. CD spectra were collected at 298 K (25°C) over the wavelength range 210–500 nm. A typical pH titration covered a pH range of 2.5–7.0 and involved the injection of several 1- to 10-μl aliquots of a 0.2 M HCl solution into 2 mL of the dilute oligonucleotide solution in a standard cuvette. A constant sample solution volume was maintained in the cuvette during the titration by removing a volume of the buffered oligonucleotide solution equal to the volume of acid titrant added in each injection.
DSC thermal denaturation studies were performed using a Microcal VP-DSC (Northampton, MA). The DSC experiments were done in BPES buffer at a single potassium concentration, [K+] = 0.130 M, and at several pH values ranging from 4.0 to 6.0. The nominal oligonucleotide concentration used in these studies was 250 μM. Some studies were done at lower concentration (50–250 μM) to investigate the possible formation of self-associated complex structures (i.e., intermolecular i-motifs formed by the association of two or four separate oligonucleotide chains). The DSC experiments were typically done over a temperature range of 283–363 K (10–90°C) at scan rates ranging from 60 to 90°C/h. Each experiment included five up-scans to ensure reversibility of the folding (unfolding) processes. DSC thermograms were deconvoluted into the minimum number of two-state transitions required to fit the experimental thermogram within the expected error. In this study, all of the thermograms were well fit with either two or three overlapping two-state transitions, and the melting temperatures (Tms), as well as calorimetric (ΔHcal) and van't Hoff enthalpy changes (ΔHVH) were determined for each transition state using Origin 7 (Microcal, Northampton, MA).
Discovery Studio molecular modeling software (Accelrys, San Diego, CA) was used to construct i-motif molecular models having either four or five cytosine pairs in the i-motif core. The i-motif model structures were built using the NMR solution structure of a d(A2C4) i-motif (Protein Data Bank accession code 1ybl) as a scaffold, which was then modified to include the relevant bases and loops of the mutant c-MYC i-motif-forming sequence. The model A structure (see Fig. 5A) contains five cytosine pairs (C11-C20, C5-C14, C10-C19, C6-C15, and C9-C18), starting from the top of the structure. Two additional i-motif structures, models D and E (see Fig. 5, D and E), with five C-H+-C pairs were constructed with a different backbone topology in which base T12 crosses over the top of the i-motif core, resulting in cytosines in consecutive c-runs being paired (e.g., C11-C13 instead of C11-C20). In addition, two i-motif structures similar to model A but containing only four C-C pairs were obtained by 1), eliminating the C11-C20 cytosine pair at the top of the scaffold in model A to yield the model B structure (see Fig. 5 B), and 2), changing the cytosine pairing in the model B structure to include a C11-C19 pair and placing C10 in a bulge loop to yield the model C structure (see Fig. 5 C). A formal charge of +1 was added to one of the N3 atoms of each of the C-C basepairs in the five different i-motif cores, creating hemiprotonated cytosine-cytosine bonds.
Figure 5.
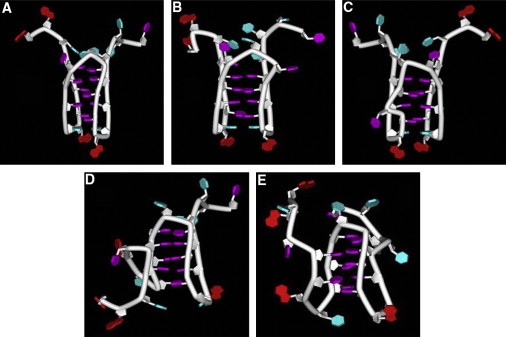
Schematic representations for five c-MYC mutant 23mer promoter sequence i-motifs with different folding topologies. (A–E) Models A–E, respectively. These possible structures for the polypyrimidine strand of the c-MYC silencer element were derived from molecular modeling. Model A shows a folded structure with five C-H+-C pairs involved in the formation of the i-motif core. Models D and E are two alternative structures that also have five C-H+-C pairs involved in the formation of the i-motif core. Models B and C depict two structures that are similar to model A but with only four C-H+-C basepair interactions. Model B is similar to model A, but with C11 kicked out at the top of the i-motif core. Model C is again similar to Model A, but with base C10 kicked out, resulting in a kink in the strand backbone.
A sphere of 8558 water molecules was added around the molecule using the C10 N3 atom as the center. The hydrogen-bonding atoms of each of the C-C+ basepairs was tethered in Insight-II using a force constant of 100.00 kcal mol−1, to prevent the basepairs from unwinding during the initial steps of energy minimization. The structure was subjected to 600 cycles of steepest-descent minimization followed by 2000 cycles of conjugate-gradient minimization using the CHARMM27 force field in Discovery Studio. The force constant was reduced to 50.0 kcal mol−1, and the structure was subjected to another 2000 cycles of conjugate-gradient minimization. Finally, the tethering was removed and the complex was subjected to conjugate-gradient minimization until the difference between subsequent steps was <0.01 kcal mol−1 (14).
Results
The gross solution structure of the mutant oligonucleotide is highly dependent on pH. Fig. 1 shows representative CD spectra for the mutant oligonucleotide in 0.130 M [K+]/BPES solution at pH 3.0, 5.0, and 7.0. The classic i-motif CD signature is only observed in the pH 5.0 solution (21,28). At pH 3.0, the CD spectrum is characteristic of an unstructured poly d-(Cn) single strand, whereas at pH 7.0, the CD spectrum shows some additional structure, presenting a CD signature that is between the single-strand spectrum and the classical i-motif spectrum seen at pH 5.0. A plot of the molar ellipticity at 280 nm versus pH exhibits three regions corresponding to three different gross structural conformations for the mutant c-MYC sequence (Fig. 2). The plateau region exhibiting the largest molar ellipticity values corresponds to the pH region between 4.2 and 5.2, in which the cytosines would be expected to be hemiprotonated and the classical i-motif structure most stable. This result is consistent with previous observations that hemiprotonation of cytosine bases favors formation of the i-motif structure, and that i-motif formation is dependent on solution pH (2,20). It should be noted that in each pH range, the mutant c-MYC sequence must be represented as an ensemble of folded structures existing in equilibrium. The CD spectrum obtained at each pH is the concentration weighted average of the CD spectra for the individual folded species present in solution at the experimental pH.
Figure 1.
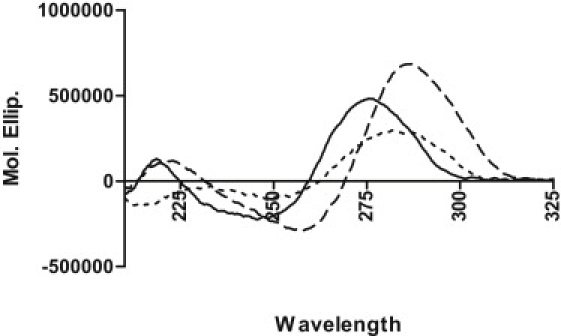
Circular dichroism spectra of the c-MYC mutant 23mer i-motif construct in 130 mM [K+] BPES. Typical CD spectra are shown for pH 7.0 (solid line), pH 5.0 (dashed line), and pH 3.0 (dotted line). The CD spectrum for the i-motif sequence at pH 5.0 shows the classic i-motif signature with a characteristic maximum in molar ellipticity at ∼288 nm and a characteristic minimum in molar ellipticity at ∼260 nm.
Figure 2.
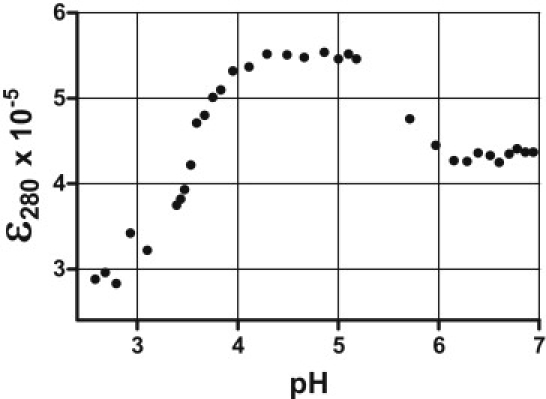
Circular dichroism spectra of the c-MYC mutant 23mer i-motif construct collected over the range of pH from 2.5 to 7.0 in 130 mM K+ BPES. The molar ellipticity at 280 nm varies with pH and is characterized by three different plateau regions. The central plateau region, pH ∼4.2–5.2, exhibits a molar ellipticity at 280 nm that is typical of the classic i-motif structure, whereas the molar ellipticity at 280 nm and the complete spectrum at pH >5.5 or <3.9 is clearly not typical for an i-motif. At the higher pH values, the spectrum is similar to the i-motif signature, or “i-motif-like,” whereas in the lower pH range, the spectrum is characteristic of an unstructured single DNA strand.
The structure and stability of the c-MYC mutant i-motif-forming sequence was further explored in DSC experiments carried out over the pH range 4.0–6.5 and at a single ionic strength, 0.130 M K+. In agreement with the CD data, the DSC results indicate that the ensemble of c-MYC mutant i-motif structures is strongly influenced by solvent pH. Fig. 3 shows that as the pH is reduced from 6.0 to 5.0, the average melting temperature, a measure of structure and stability, is increased. Further, as the solution is acidified below pH 5.0, the average melting temperature and stability of the structured oligonucleotide species begins to decrease. The complex nature of the DSC melting profiles (Figs. 3 and 4) suggests the presence of multiple folded conformers existing simultaneously in solution. At the pH extremes of 4.0 and 6.0, the solution must contain at least two structural conformations. At the intermediate pH values of 5.0 and 5.5, the solution must contain at least three different folded conformers (see Fig. 4).
Figure 3.
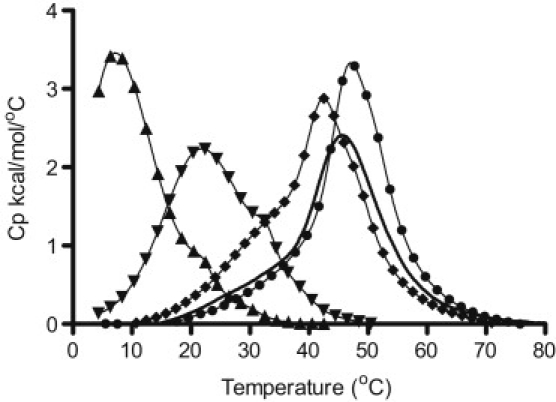
DSC thermograms are shown for the thermal denaturation of the c-MYC mutant 23mer construct in 130 mM K+ BPES buffer at five different pH values: pH 4.0 (black solid line), pH 5.0 (light gray solid line), pH 5.5 (black dotted line), pH 6.0 (dark gray solid line), and pH 6.5 (light gray dotted line). The raw excess heat capacity signal has been deconvoluted into two or three two-state processes. The melting temperature(s), Tms, observed for the denaturation of the structured or folded oligonucleotide increase with decreasing pH over this pH range.
Figure 4.
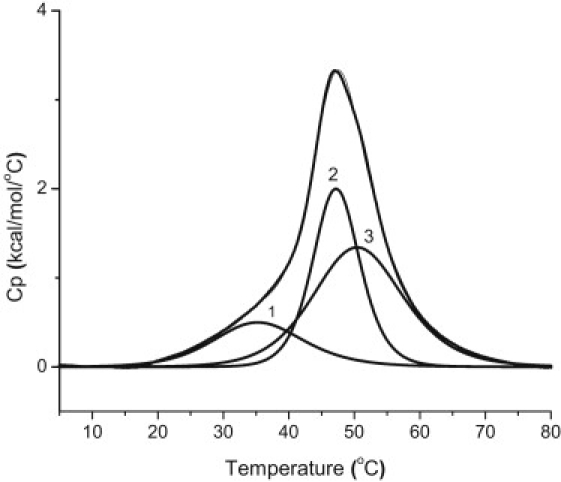
DSC thermogram for the thermal denaturation of the c-MYC mutant 23mer i-motif sequence in 130 mM K+ BPES at pH 5.0. The raw excess heat capacity has been deconvoluted into three two-state processes. The uppermost curve is for the raw thermogram superimposed with the composite curve for the three overlapping two-state transitions. These two curves are virtually indistinguishable. The melting profiles for the deconvolved two-state transitions are labeled 1–3. The Tm values for the three overlapping but independent melting transitions are 38.1°C (1), 46.6°C (2), and 49.5°C (3).
The minimum number of thermodynamically unique species in solution at each pH was determined by deconvolution of the DSC thermograms into the minimum number of overlapping two-state thermal transitions required to fit the overall thermogram. Table 1 summarizes the average enthalpy change and the Tm values for the unfolding of each thermodynamically unique structure in the ensemble of folded structures at pH 4.0, 5.0, 5.5, 6.0, and 6.5. For example, at pH 5.0, the three structurally unique species (perhaps those shown in Fig. 1) had melting temperatures of 38.1, 46.6, and 49.5°C (Fig. 4). Samples prepared at pH 4.0, 6.0, and 6.5 were best fit with only two transitions.
Table 1.
DSC-derived mole fractions and average enthalpy change for the thermal denaturation of the higher order structure formed by the mutant c-MYC 23-mer sequence at a range of pH values
| pH | Tm1°C | χ1 | Tm2°C | χ2 | Tm3°C | χ3 | ΔH(kcal mol−1) |
|---|---|---|---|---|---|---|---|
| 6.5 | 7.6 ± 0.5 | 0.93 ± 0.05 | 20.5 ± 0.2 | 0.07 ± 0.05 | NA | NA | 37 ± 1 |
| 6.0 | 21.7 ± 0.2 | 0.84 ± 0.05 | 32.5 ± 0.2 | 0.16 ± 0.05 | NA | NA | 43 ± 1 |
| 5.5 | 31.5 ± 0.2 | 0.38 ± 0.05 | 40.5 ± 0.2 | 0.54 ± 0.05 | 48.0 ± 0.2 | 0.08 ± 0.05 | 55 ± 2 |
| 5.0 | 38.1 ± 0.2 | 0.29 ± 0.05 | 46.6 ± 0.2 | 0.15 ± 0.05 | 49.5 ± 0.2 | 0.56 ± 0.05 | 54 ± 2 |
| 4.0 | 32.9 ± 0.2 | 0.26 ± 0.05 | 46.3 ± 0.2 | 0.74 ± 0.05 | NA | NA | 37 ± 1 |
Potassium concentration was 130 mM [K+] BPES, and pH values were 4.0, 5.0, 5.5, 6.0, and 6.5. DSC thermograms were fit with two overlapping two-state transitions at pH 4.0, 6.0, and 6.5, and with three overlapping two-state transitions at pH 5.0 and 5.5. NA, not applicable.
Hypothetical i-motif structures obtained by computational modeling experiments are shown in Fig. 5. Models B and C (Fig. 5, B and C) are essentially the same as the structures reported by Dai et al. (31). The configurational energy of each of the five hypothetical i-motifs was calculated using Discovery Studio by applying the CHARMM 27 force field to the energy-minimized structures after removing the 8000-plus water molecules. The configurational energies for the five model structures are given in Table 2. It is interesting to note that the model A structure (Fig. 5 A), the most stable structure by this analysis, is the only structure that has a favorable configurational energy (−168 kcal mol−1). The two structures reported by Dai et. al., models B and C (Fig. 5, B and C), have intermediate configurational energies (294 and 241 kcal mol−1, respectively), whereas the two structures that have more contorted folding topology (models D and E (Fig. 5, D and E) have the least favorable configurational energies (531 and 471 kcal mol−1).
Table 2.
Stability and configurational energies for five different i-motif structures
| i-Motifmodel∗ | Stability† | Number ofC-H+-C pairs | Configurational energy (kcal mol−1) | Observed by NMR (31) |
|---|---|---|---|---|
| A | 1 | 5 | −168 | No |
| B | 3 | 4 | 294 | Yes |
| C | 2 | 4 | 241 | Yes |
| D | 5 | 5 | 531 | No |
| E | 4 | 5 | 471 | No |
i-Motif models correspond to the structures in Fig. 5, A–E.
Stability order is based on calculated configurational energies, with model A the most stable and model D the least stable.
Discussion
As stated in the introduction, the initial focus of this study was to explore the structure and stability of a mutant i-motif-forming oligonucleotide under a variety of solution conditions, including a range of pH values. In comparison to the native c-MYC promoter sequence, the number of potential cytosine-cytosine pairings has been reduced in the mutant sequence by introducing three C→T mutations in the core sequence and two C→A mutations at the 3′ end of the 23mer (Scheme 1). The mutant sequence was expected to fold into a single i-motif structure stabilized by a thymine triplet near the top of the i-motif structure. Although the mutant sequence used in this study results in an ensemble of folded structures, as determined by DSC, it contains fewer significant species than would be predicted for the native c-MYC P1 promoter polypyrimidine sequence. Our microcalorimetric and spectroscopic studies indicate the presence of at least three unique i-motif conformations at pH values between 5.0 and 5.5. In the previous NMR work by Dai et al. (31), only two i-motif structures (shown in Fig. 5, B and C) were observed in solution at pH 5.0.
In low-pH solutions, those with pH between 2.5 and 4.0, CD and DSC data suggest that the i-motif structure begins to decrease in stability and the mutant oligonucleotide sequence is best represented as a single-stranded or random-coil structure (21,37). The CD spectra for the c-MYC mutant promoter sequence in this low pH range most closely resemble the spectra for a single-stranded poly d(C) sequence. The DSC data at the lowest pH values indicate the absence of any stable ordered DNA structure. The further protonation of cytosine bases below pH 4.0 appears to destabilize the i-motif structure by introducing C+-C+ repulsive interactions in the i-motif core.
In high-pH solutions, between 5.5 and 7.0, the c-MYC mutant promoter sequence appears to form lower-stability folded structures with melting temperatures (Tms) <30°C. The CD spectra obtained at neutral pH are not consistent with the signature presented by the classical i-motif structure (21,29). However, the larger positive molar ellipticity value near 275 nm and the more negative molar ellipticity value near 240 nm, in comparison to the CD signals for single-stranded DNA, indicate the presence of an intramolecular folded “i-motif-like” structure in this pH range (21,29). In addition, the presence of large endothermic denaturation peaks in DSC experiments done at pH 6.5 and 6.0 indicates that the mutant oligonucleotide sequence forms folded structures, presumably stabilized by weaker C-C pairing between unprotonated cytosine bases.
At the mid-pH range, between 4.0 and 5.5, a plateau is observed, exhibiting the largest molar ellipticity values, which corresponds to the pH region in which the cytosines would be expected to be hemiprotonated. In this pH range, the CD spectra are consistent with a classical i-motif higher-order DNA signature, indicating that the structures are most stable in this range (21,37). This pH range includes the pKa of cytosine (pKa ∼4.58) (35), as well as the most stable solution structure determined from the DSC experiments.
This observed increase in stability with the increase of acidity (down to pH 4.0) supports findings presented on other i-motif constructs (20). The thermal stability and the number of independently melting species (folded conformations) existing simultaneously in solution for the mutant oligonucleotide sequence were determined using DSC from pH 4.0 to 6.5. At pH 4.0, 6.0, and 6.5, the thermal denaturation curves were best modeled with two independent two-state melting transitions, whereas at pH 5.0 and 5.5, thermal denaturation curves were best fit with three independent two-state melting transitions. The number of transitions indicates the presence of at least two or three i-motif conformations existing simultaneously in solution, each with its own unique melting temperature. It appears that the mutant oligonucleotide sequence adopts an equilibrium between at least three different classical i-motif conformations in solution at pH 5.0.
Dai et al. previously reported an NMR study in which models B and C (Fig. 5, B and C) were shown to exist simultaneously in solution at pH ∼5.0 (31). We believe that the third species in the i-motif ensemble at pH 5.0 is model A (Fig. 5 A). This conformer has one additional cytosine-cytosine interaction, and our computational study suggests that this structure is more stable than either model B or model C. We propose that the three different Tm values can be assigned to models C, B, and A in order of increasing stability. The model A structure is stabilized by an additional cytosine-cytosine interaction compared to models B and C, with the model B the second most stable conformation, and model C destabilized due to the presence of a kink in the backbone folding pattern. This order of stability is not exactly as predicted by our computational modeling (see Table 2). However, the desolvated configurational energies are only estimates, and the real difference in the configurational energy between models B and C may not be significant.
In conclusion, the mutant c-MYC i-motif construct adopts several structured or folded conformations (pH 4.0–7.0) and one unstructured conformation (pH << 4.0) under the solvent conditions studied here. The absence of a stable classical i-motif structure at pH values >5.5 does not minimize the importance of these studies. Small molecules that are capable of driving i-motif formation under physiological conditions would be an area of great interest. In addition, the solution conditions within the cell nucleus are very different from those in water. The high protein and nucleic acid concentrations must contribute to molecular crowding and to a medium with a very different ionic strength and effective dielectric constant than would be experienced by the oligonucleotide in dilute aqueous solution. We speculate here that the i-motif could be stabilized at higher pH values under the solution conditions in the cell nucleus.
We have shown that solvent pH strongly influences the stability and conformation of the i-motif structure and that conditions can be established in which the model c-MYC polypyrimidine promoter sequence exists as an ensemble of classical i-motif structures. Under these conditions, the interaction of i-motif DNA with novel ligands or proteins that are able to drive the formation of the classical i-motif structure would be invaluable to the field of higher-order DNA structural studies. Small molecules that are able to drive the formation of classical i-motif structures at neutral pH would allow for i-motif DNA to be studied under a wider range of conditions. In theory, small molecules capable of stabilizing i-motif DNA might be able to modulate the expression of numerous genes, including oncogenes (11,14,38).
References
- 1.Wang Y., Patel D.J. Guanine residues in d(T2AG3) and d(T2G4) form parallel-stranded potassium cation stabilized G-quadruplexes with anti glycosidic torsion angles in solution. Biochemistry. 1992;31:8112–8119. doi: 10.1021/bi00150a002. [DOI] [PubMed] [Google Scholar]
- 2.Gehring K., Leroy J.L., Guéron M. A tetrameric DNA structure with protonated cytosine.cytosine base pairs. Nature. 1993;363:561–565. doi: 10.1038/363561a0. [DOI] [PubMed] [Google Scholar]
- 3.Huppert J.L., Balasubramanian S. G-quadruplexes in promoters throughout the human genome. Nucleic Acids Res. 2007;35:406–413. doi: 10.1093/nar/gkl1057. [DOI] [PMC free article] [PubMed] [Google Scholar]
- 4.Hurley L.H. Secondary DNA structures as molecular targets for cancer therapeutics. Biochem. Soc. Trans. 2001;29:692–696. doi: 10.1042/0300-5127:0290692. [DOI] [PubMed] [Google Scholar]
- 5.Grand C.L., Powell T.J., Hurley L.H. Mutations in the G-quadruplex silencer element and their relationship to c-MYC overexpression, NM23 repression, and therapeutic rescue. Proc. Natl. Acad. Sci. USA. 2004;101:6140–6145. doi: 10.1073/pnas.0400460101. [DOI] [PMC free article] [PubMed] [Google Scholar] [Retracted]
- 6.Riou J.F., Guittat L., Mergny J.L. Cell senescence and telomere shortening induced by a new series of specific G-quadruplex DNA ligands. Proc. Natl. Acad. Sci. USA. 2002;99:2672–2677. doi: 10.1073/pnas.052698099. [DOI] [PMC free article] [PubMed] [Google Scholar]
- 7.Herbert B.S., Pitts A.E., Corey D.R. Inhibition of human telomerase in immortal human cells leads to progressive telomere shortening and cell death. Proc. Natl. Acad. Sci. USA. 1999;96:14276–14281. doi: 10.1073/pnas.96.25.14276. [DOI] [PMC free article] [PubMed] [Google Scholar]
- 8.Hurley L.H., Von Hoff D.D., Yang D. Drug targeting of the c-MYC promoter to repress gene expression via a G-quadruplex silencer element. Semin. Oncol. 2006;33:498–512. doi: 10.1053/j.seminoncol.2006.04.012. [DOI] [PubMed] [Google Scholar]
- 9.Cerni C. Telomeres, telomerase, and myc. An update. Mutat. Res. 2000;462:31–47. doi: 10.1016/s1383-5742(99)00091-5. [DOI] [PubMed] [Google Scholar]
- 10.Han H., Langley D.R., Hurley L.H. Selective interactions of cationic porphyrins with G-quadruplex structures. J. Am. Chem. Soc. 2001;123:8902–8913. doi: 10.1021/ja002179j. [DOI] [PubMed] [Google Scholar]
- 11.Freyer M.W., Buscaglia R., Lewis E. Biophysical studies of the c-MYC NHE III1 promoter: model quadruplex interactions with a cationic porphyrin. Biophys. J. 2007;92:1–9. doi: 10.1529/biophysj.106.097246. [DOI] [PMC free article] [PubMed] [Google Scholar]
- 12.Han F.X., Wheelhouse R.T., Hurley L.H. Structural basis for the differential effects on telomerase inhibition. J. Am. Chem. Soc. 1999;121:3561–3570. [Google Scholar]
- 13.Phan A.T., Mergny J.L. Human telomeric DNA: G-quadruplex, i-motif and Watson-Crick double helix. Nucleic Acids Res. 2002;30:4618–4625. doi: 10.1093/nar/gkf597. [DOI] [PMC free article] [PubMed] [Google Scholar]
- 14.Cashman D.J., Buscaglia R., Lewis E.A. Molecular modeling and biophysical analysis of the c-MYC NHE-III1 silencer element. J. Mol. Model. 2008;14:93–101. doi: 10.1007/s00894-007-0254-z. [DOI] [PubMed] [Google Scholar]
- 15.Leroy J.L., Guéron M., Hélène C. Intramolecular folding of a fragment of the cytosine-rich strand of telomeric DNA into an i-motif. Nucleic Acids Res. 1994;22:1600–1606. doi: 10.1093/nar/22.9.1600. [DOI] [PMC free article] [PubMed] [Google Scholar]
- 16.Kanaori K., Shibayama N., Makino K. Multiple four-stranded conformations of human telomere sequence d(CCCTAA) in solution. Nucleic Acids Res. 2001;29:831–840. doi: 10.1093/nar/29.3.831. [DOI] [PMC free article] [PubMed] [Google Scholar]
- 17.Mergny J.L., Lacroix L., Helene C. Intramolecular folding of pyrimidine oligodeoxynucleotides into an i-DNA motif. J. Am. Chem. Soc. 1995;117:8887–8898. [Google Scholar]
- 18.Kumar P., Verma A., Chowdhury S. Tetraplex DNA transitions within the human c-myc promoter detected by multivariate curve resolution of fluorescence resonance energy transfer. Biochemistry. 2005;44:16426–16434. doi: 10.1021/bi051452x. [DOI] [PubMed] [Google Scholar]
- 19.Kanaori K., Maeda A., Makino K. 1H nuclear magnetic resonance study on equilibrium between two four-stranded solution conformation of short d(CnT) Biochemistry. 1998;33:13540–13546. doi: 10.1021/bi980492g. [DOI] [PubMed] [Google Scholar]
- 20.Chen L., Cai L., Rich A. Crystal structure of a four-stranded intercalated DNA: d(C4) Biochemistry. 1994;33:13540–13546. doi: 10.1021/bi00250a005. [DOI] [PubMed] [Google Scholar]
- 21.Kanehara H., Mizuguchi M., Makino K. Spectroscopic evidence for the formation of four-stranded solution structure of oligodeoxycytidine phosphorothioate. Biochemistry. 1997;36:1790–1797. doi: 10.1021/bi961528c. [DOI] [PubMed] [Google Scholar]
- 22.Völker J., Klump H.H., Breslauer K.J. The energetics of i-DNA tetraplex structures formed intermolecularly by d(TC5) and intramolecularly by d[(C5T3)3C5] Biopolymers. 2007;86:136–147. doi: 10.1002/bip.20712. [DOI] [PubMed] [Google Scholar]
- 23.Esmaili N., Leroy J.L. i-motif solution structure and dynamics of the d(AACCCC) and d(CCCCAA) tetrahymena telomeric repeats. Nucleic Acids Res. 2005;33:213–224. doi: 10.1093/nar/gki160. [DOI] [PMC free article] [PubMed] [Google Scholar]
- 24.Leroy J.L., Guéron M. Solution structures of the i-motif tetramers of d(TCC), d(5methylCCT) and d(T5methylCC): novel NOE connections between amino protons and sugar protons. Structure. 1995;3:101–120. doi: 10.1016/s0969-2126(01)00138-1. [DOI] [PubMed] [Google Scholar]
- 25.Guéron M., Leroy J.L. The i-motif in nucleic acids. Curr. Opin. Struct. Biol. 2000;10:326–331. doi: 10.1016/s0959-440x(00)00091-9. [DOI] [PubMed] [Google Scholar]
- 26.Han X., Leroy J.L., Gueron M. An intramolecular i-motif: the solution structure and base-pair opening kinetics of d(5mCCT3CCT3ACCT3CC. J. Mol. Biol. 1998;22:949–965. doi: 10.1006/jmbi.1998.1740. [DOI] [PubMed] [Google Scholar]
- 27.Weil J., Min T., Kang C. Stabilization of the i-motif by intramolecular adenine-adenine-thymine base triple in the structure of d(ACCCT) Acta Crystallogr. D Biol. Crystallogr. 1999;55:422–429. doi: 10.1107/s0907444998012529. [DOI] [PubMed] [Google Scholar]
- 28.Kaushik M., Suehl N., Marky L.A. Calorimetric unfolding of the bimolecular and i-motif complexes of the human telomere complementary strand, d(C(3)TA(2))(4) Biophys. Chem. 2007;126:154–164. doi: 10.1016/j.bpc.2006.05.031. [DOI] [PubMed] [Google Scholar]
- 29.Mathur V., Verma A., Chowdhury S. Thermodynamics of i-tetraplex formation in the nuclease hypersensitive element of human c-myc promoter. Biochem. Biophys. Res. Commun. 2004;320:1220–1227. doi: 10.1016/j.bbrc.2004.06.074. [DOI] [PubMed] [Google Scholar]
- 30.Simonsson T., Pribylova M., Vorlickova M. A nuclease hypersensitive element in the human c-myc promoter adopts several distinct i-tetraplex structures. Biochem. Biophys. Res. Commun. 2000;278:158–166. doi: 10.1006/bbrc.2000.3783. [DOI] [PubMed] [Google Scholar]
- 31.Dai J., Ambrus A., Yang D. A direct and nondestructive approach to determine the folding structure of the i-motif secondary structure by NMR. J. Am. Chem. Soc. 2009;131:6102–6104. doi: 10.1021/ja900967r. [DOI] [PMC free article] [PubMed] [Google Scholar]
- 32.Malliavin T.E., Gau J., Leroy J.L. Stability of the i-motif structure is related to the interactions between phosphodiester backbones. Biophys. J. 2003;84:3838–3847. doi: 10.1016/S0006-3495(03)75111-X. [DOI] [PMC free article] [PubMed] [Google Scholar]
- 33.Leroy J.L. Cytidine protonation and base-pair intercalation in nucleic acid structures: the i-motif. Nucleic Acids Res. Suppl. 2002;2:7–8. doi: 10.1093/nass/2.1.7. [DOI] [PubMed] [Google Scholar]
- 34.Fedoroff O.Y., Rangan A., Hurley L.H. Cationic porphyrins promote the formation of i-motif DNA and bind peripherally by a nonintercalative mechanism. Biochemistry. 2000;39:15083–15090. doi: 10.1021/bi001528j. [DOI] [PubMed] [Google Scholar]
- 35.Christensen J.J., Rytting J.H., Izatt R.M. Thermodynamics of proton dissociation in dilute aqueous solution. 8. pK, change in heat content, and change in entropy values for proton ionization from several pyrimidines and their nucleosides at 25°. J. Phys. Chem. 1967;71:2700–2705. doi: 10.1021/j100867a047. [DOI] [PubMed] [Google Scholar]
- 36.Plum G.E. Determination of oligonucleotide molar extinction coefficients. Curr. Protoc. Nucleic Acid Chem. 2000;73:1–17. [Google Scholar]
- 37.Xu Y., Sugiyama H. Formation of the G-quadruplex and i-motif structures in retinoblastoma susceptibility genes (Rb) Nucleic Acids Res. 2006;34:949–954. doi: 10.1093/nar/gkj485. [DOI] [PMC free article] [PubMed] [Google Scholar]
- 38.Haq I., Trent J.O., Jenkins T.C. Intercalative G-tetraplex stabilization of telomeric DNA by a cationic porphyrin. J. Am. Chem. Soc. 1999;121:1768–1779. [Google Scholar]