

Abstract
Multiscale whole-cell models that accurately represent local control of Ca2+-induced Ca2+ release in cardiac myocytes can reproduce high-gain Ca2+ release that is graded with changes in membrane potential. Using a recently introduced formalism that represents heterogeneous local Ca2+ using moment equations, we present a model of cardiac myocyte Ca2+ cycling that exhibits alternating sarcoplasmic reticulum (SR) Ca2+ release when periodically stimulated by depolarizing voltage pulses. The model predicts that the distribution of junctional SR [Ca2+] across a large population of Ca2+ release units is distinct on alternating cycles. Load-release and release-uptake functions computed from this model give insight into how Ca2+ fluxes and stimulation frequency combine to determine the presence or absence of Ca2+ alternans. Our results show that the conditions for the onset of Ca2+ alternans cannot be explained solely by the steepness of the load-release function, but that changes in the release-uptake process also play an important role. We analyze the effect of the junctional SR refilling time constant on Ca2+ alternans and conclude that physiologically realistic models of defective Ca2+ cycling must represent the dynamics of heterogeneous junctional SR [Ca2+] without assuming rapid equilibration of junctional and network SR [Ca2+].
Introduction
The phenomenon of cardiac alternans—mechanical or electrical oscillations that alternate in magnitude on a beat-to-beat basis—has received considerable attention in the past years, because it is closely related to an increase in the risk of cardiac arrhythmias and is a good marker for sudden cardiac death. Because up to 50% of deaths related to heart failure can be attributed to these arrhythmias, understanding the underlying mechanisms that lead to cardiac alternans is of grave relevance.
Many cardiac arrythmias are linked to spatially discordant repolarization alternans, which themselves are causally connected with changes in action potential duration (APD) (1). These variations in APD are due to irregularities in the mechanisms of Ca2+ cycling in the cell, given the bidirectional coupling between membrane potential and intracellular [Ca2+] (2–4). In general, the coupling from membrane potential to intracellular Ca2+ is a positive one, since the voltage-dependent activity of L-type (dihydropyridine receptor (DHPR)) Ca2+ channels tends to increase the intracellular Ca2+ by triggering Ca2+ release from the sarcoplasmic reticulum (SR) via Ca2+-induced Ca2+ release (CICR). On the other hand, the coupling from intracellular [Ca2+] to membrane potential can be either positive or negative (2,3) depending on the net effect of Ca2+ on regulation of the activity of the DHPR (Ca2+ influx), the Na+-Ca2+ exchanger (NCX) (Ca2+ efflux), and other Ca2+-regulated currents. As action potential duration can be either prolonged or shortened, depending on the magnitude of SR Ca2+ release, beat-to-beat alternations in the size of SR Ca2+ release may underlie the mechanisms leading to repolarization alternans in cardiac myocytes. It is interesting to note that recent experimental evidence indicates that Ca2+ release alternans can occur independently of action potential duration alternans (2,5).
What are the mechanisms underlying SR Ca2+ release alternans? One possible cause is cellular Ca2+ cycling properties that limit the amount of released Ca2+ that can be resequestered back into the SR before the next voltage pulse or action potential occurs, leading to alternations in the SR content and subsequent SR release. Other proposed mechanisms include the generation of Ca2+ waves, the time course of ryanodine receptor (RyR) inactivation and refractoriness, and dysfunctions in the release mechanism of the RyR (reviewed in Laurita and Rosenbaum (3)). Both modeling and experimental studies indicate that two important aspects of cellular Ca2+ dynamics favor the occurrence of Ca2+ release alternans: 1), a strong dependence of Ca2+-release amplitude on the SR content before the voltage pulse; and 2), a strong relationship between the cytoplasmic [Ca2+] and the amount of Ca2+ extruded from the cell in a given cycle.
Some prior computational studies have formulated minimal dynamic models that represent these features of Ca2+ cycling using discrete-time maps that can be analyzed using bifurcation theory (2,4,6,7). In such models, the load-release function specifies how the amount of SR release depends on SR content, and the release-uptake function specifies the subsequent process of Ca2+ uptake into the SR. These specified functional relationships are sometimes fitted to experimental data and usually assumed to be either linear (2) or sigmoidal (6); however, they are not derived from biophysical properties of Ca2+ currents and pumps. On the other hand, detailed compartmental models that take into account the Ca2+ dynamics of large numbers of junctional SR (jSR) compartments have been proposed (8,9). These models utilize a minimal description of Ca2+ release through RyRs, focusing mainly on a nonlinear relationship between SR content and release (8) or describing it through a Hill equation dependent only on the local (diadic subspace) [Ca2+] (9), without taking into account the dynamics of stochastic gating of RyRs or the L-type Ca2+ channel (DHPR).
This study investigates features of Ca2+ alternans from a computational perspective with an emphasis on a novel whole-cell modeling approach that has been applied successfully to the simulation of local control mechanisms in excitation-contraction coupling (10). The modeling approach utilizes a probability density formulation and an associated moment-closure technique to represent the stochastic activity of Ca2+ release units (CaRUs) composed of a single L-type Ca2+ channel (DHPR) and RyR megachannel, with Ca2+-dependent dynamics that depend on the local [Ca2+] in a large number of dyadic-subspace and jSR compartments. It is important to note that the moment-based formalism accounts for the heterogeneous distribution of local [Ca2+] across the population of CaRUs, a feature that sets this modeling approach apart from prior work that assumes that local Ca2+ concentrations are an instantaneous function of CaRU state (8,11–13).
Model Formulation
The whole-cell model of Ca2+ cycling used here is consistent with (and derived from) a multicompartment local-control formulation that represents the dynamics of bulk myoplasmic [Ca2+] (cmyo), network SR [Ca2+] (cnsr), N diadic subspace Ca2+ concentrations ( ), and N jSR domain Ca2+ concentrations () using a system of N + 2 concentration balance equations (14,10). These take the form , where x is an index over compartments, λx = Vx/Vmyo is the effective volume ratio for the compartment using the myoplasm as a reference, cx is the [Ca2+] in compartment x, and each is a Ca2+ flux (see Fig. S1 and Eq. S1, Eq. S2, Eq. S3, Eq. S4, Eq. S5, Eq. S6, and Eq. S7 in the Supporting Material). These equations are coupled to N Markov chains, each of which represents the stochastic gating of a single CaRU composed of a (two-state) L-type (DHPR) Ca2+ channel and a (six-state) RyR megachannel. Note that these channels do not gate independently of one another, because they are coupled via changes in cds occurring in the restricted diadic subspace. Thus, a single CaRU is described by a 12-state transition-state diagram
| (1) |
where the first character (C or O) indicates the state of the DHPR and the second character ( or O) refers to the state of the RyR megachannel (see Supporting Material for rate constants). The transitions , where j = i + 1 are mediated by cds. The transitions depend on cjsr, so that depletion of luminal Ca2+ decreases the open probability of the RyR megachannel. The transitions are voltage-dependent, whereas the reverse reactions , , and are independent of both voltage and Ca2+.
Under the physiologically realistic assumption of a large number of CaRUs (N ≈ 20,000), the ordinary differential equations (ODEs) for the jSR Ca2+ concentrations (Eq. S3) can be replaced by a set of probability density functions,
| (2) |
where i is an index over the M = 12 CaRU states, is the state of a randomly sampled CaRU, and is the associated jSR [Ca2+]. These densities satisfy a system of advection-reaction equations (Eq. S18) (10,14–16).
The moment-based description of jSR [Ca2+] begins by defining the qth moment of ρi(cjsr, t) as
| (3) |
The first three moments (q = 0, 1, 2) have simple interpretations: is the probability that a randomly sampled CaRU is in state i; is proportional to the expected value of the jSR [Ca2+] conditioned on CaRU state (), and is related to the conditional variance of the jSR [Ca2+] through . Using the definition in Eq. 3 and the evolution equation for the probability density ρi(cjsr, t), one can derive an infinite system of ODEs for the time evolution of these moments. The system is truncated to include equations for , , and . The equations are closed by expressing as an algebraic function of the lower moments, , that would be strictly correct if the probability density functions were scaled β-distributions.
In summary, the whole-cell model of Ca2+ cycling that is the focus of this article utilizes concentration balance equations for myoplasmic and network SR [Ca2+] and a moment-based description of heterogeneous diadic subspace and jSR [Ca2+] that assumes rapid equilibration of diadic subspace Ca2+, but accounts for slow dynamics of jSR Ca2+ associated with a large population of CaRUs. The moment-based whole-cell modeling approach has been validated as an alternative to Monte Carlo simulation and shown to be capable of reproducing important electrophysiological properties of cardiac myocytes (10). Parameters consistent with prior modeling and experiments are presented in Table S1, Table S2, and Table S3.
Results
To initiate this investigation of Ca2+ alternans, parameters consistent with prior modeling and experiment (17–20) were adjusted to qualitatively fit experimental data from postinfarction models of ventricular fibrillation in the dog (21), resulting in the standard parameters used here (Table S1, Table S2, and Table S3). Although parameters leading to Ca2+ alternans are not unique, the standard parameters of the model retain the high-gain graded Ca2+ release (see Fig. S2 and Fig. S3) that was the focus of prior work (10). In addition, the standard parameters result in simulated Ca2+ cycling that is consistent with the following experimental observations from postinfarction models of ventricular fibrillation in the dog: 1), the presence of alternating Ca2+ responses during periodic stimulation of 100-ms voltage pulses; 2), myoplasmic Ca2+ transients with 200- to 500-ms duration; 3), an onset stimulation frequency for Ca2+ alternans of ∼1 Hz; and 4), the absence of Ca2+ alternans at stimulation frequencies >5 Hz.
Alternating Ca2+ responses in the moment-based whole-cell model
Fig. 1 A is an example of alternating SR Ca2+ release (i.e., Ca2+ alternans) when the moment-based whole-cell model is periodically stimulated by 100-ms depolarizing voltage pulses at 1 Hz. The thick solid line shows the time course of the total myoplasmic [Ca2+] starting at its steady-state concentration (dotted line) and progressing through several stimulation cycles. The total myoplasmic and SR [Ca2+] ( and , respectively) are given by the expressions
| (4) |
where λds and λjsr are volume ratios and and are expected values, e.g., , where i is an index of CaRU states and is the first moment of the jSR [Ca2+] probability density ρi(cjsr, t) (see Eq. 3, Eq. S32, and associated text).
Figure 1.
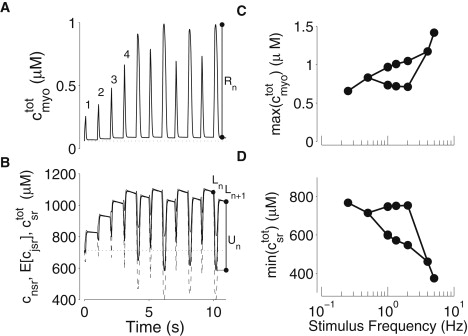
Representative Ca2+ alternans exhibited by the moment-based model when stimulated by periodic 100-ms voltage pulses from −80 to 0 mV. (A) Total myoplasmic [Ca2+] (Eq. 4) during 1 Hz stimulation (solid line) and in the absence of stimulation (dotted line). (B) Network SR [Ca2+] (thin solid line), expected jSR [Ca2+] (; dashed line), and total SR [Ca2+] (; heavy solid line) during 1 Hz stimulation and in the absence of stimulation (dotted line). The quantities Rn, Ln and Un in A and B define the Ca2+ release, SR load, and SR uptake, respectively, for the nth stimulus cycle. (C and D) Frequency dependence of Ca2+ alternans. The maximum total myoplasmic [Ca2+] (C) and corresponding minimum total SR [Ca2+] (D) during stimulation at various frequencies.
Note that in Fig. 1 A, the onset of alternans is apparent only after the fourth voltage pulse, before which a gradual increase in Ca2+ transient amplitude is observed. Fig. 1 B shows the corresponding dynamics of total SR [Ca2+] (heavy solid line). Before the onset of alternans, increases in a stepwise fashion to ∼1100 μM during the first four pulses. After the onset of alternans, larger SR Ca2+ depletion events are associated with the larger increases in myoplasmic Ca2+. During Ca2+ release events, the average jSR [Ca2+] (; Fig. 1 B, dashed line) is often far more depleted than the network SR [Ca2+] (cnsr; Fig. 1 B, thin solid line), whereas between pulses, junctional and network SR [Ca2+] equilibrate. Because is a weighted average of and cnsr (Eq. 4), the thick solid line is between the thin solid and dashed lines.
The circles in Fig. 1, C and D, show that the moment-based whole-cell model exhibits Ca2+ alternans when periodically stimulated at 2–5 Hz. These traces and Fig. 1, C and D, correspond reasonably well to experiments in postinfarction models of ventricular fibrillation in the dog (cf. Figs. 1 D and 2 A of Belevych et al. (21)). When two symbols are plotted in Fig. 1 for a particular frequency, these represent the two different maximum myoplasmic Ca2+ concentrations (or minimum SR Ca2+ concentrations) observed during the alternating response. When one symbol is plotted, Ca2+ alternans were not observed. The bubble in these plots indicates the range of stimulation frequencies leading to Ca2+ alternans.
Distribution of jSR [Ca2+] during alternans
Although the joint distributions defined in Eq. 2 are not calculated in the moment-based simulation, they can be constructed post hoc from the computed moments , , and as scaled β-distributions with integrated area of and mean and variance consistent with and (Eq. S21 and Eq. S22) (10). Fig. 2 A shows the overall distribution of jSR [Ca2+] irrespective of CaRU state, given by at two times during a 0.5-Hz stimulus cycle that does not result in Ca2+ alternans. The jSR [Ca2+] distribution (I) corresponds to the beginning of the 100-ms depolarizing voltage pulse (cf. Fig. 2 C). It has little dispersion, indicating that most jSR compartments have similar [Ca2+]. In contrast, distribution II corresponds to the phase of the stimulus cycle when reaches its maximum (cf. Fig. 2 C) and is quite dispersed, indicating a wide range of jSR depletion. The value of for these distributions is indicated by the black triangles.
Figure 2.
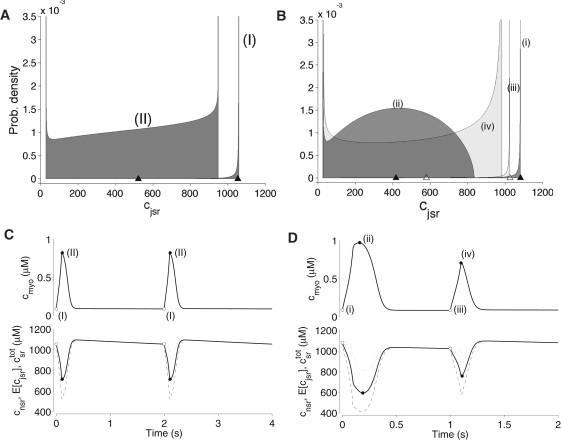
(A and B) Distribution of jSR [Ca2+] irrespective of CaRU state in the absence (A) and presence (B) of Ca2+ alternans, at 0.5 Hz and 1 Hz stimulation, respectively, as computed from the moments of jSR [Ca2+] (, , and ) in the whole-cell model. The probability densities labeled I and i and iii correspond to the onset of the voltage pulse; those labeled II and ii and iv correspond to the phase of the stimulus cycle when the total myoplasmic [Ca2+] reaches its maximum value. Triangles indicate the expected jSR [Ca2+] (). (C and D) Upper traces show myoplasmic Ca2+ for the nonalternating and alternating cases, respectively, with labels I and II and i–iv corresponding to the probability density regions in A and B. Lower traces show the network SR [Ca2+] (dashed line), the expected jSR [Ca2+] (, dashed line), and the total SR [Ca2+] (, solid line).
Fig. 2 B shows jSR distributions obtained using 1-Hz stimulation that results in Ca2+ alternans. The timing of these snapshots is identical to that for Fig. 2 A, but here there are four distributions, because the Ca2+ responses are different on consecutive cycles. In Fig. 2 B, distributions i and iii are both quite focused, indicating that the jSR compartments have similar [Ca2+] at the onset of the voltage pulse on alternating cycles. However, distributions ii and iv differ significantly from each other, indicating that jSR [Ca2+] is distinct on alternating cycles at the time the maximum myoplasmic [Ca2+] is observed. Fig. 2 D shows that distribution ii corresponds to the large Ca2+ transient in which nearly all the jSR compartments have [Ca2+] <850 μM, whereas distribution iv corresponds to the small Ca2+ transient in which a broader distribution of jSR [Ca2+] is observed, with a large fraction of jSR compartments only slightly depleted relative to the network SR. Fig. S4 shows these jSR [Ca2+] distributions dependent on the RyR megachannel being closed/open.
Discrete-time map of alternating Ca2+ responses
Prior computational studies have formulated minimal dynamic models of Ca2+ cycling and used discrete-time maps to analyze the bifurcations that give rise to alternating SR Ca2+ release (4,6,8,22). The moment-based whole-cell model used here provides an opportunity to explore how these relations depend on specific Ca2+ fluxes and heterogeneous jSR [Ca2+].
Fig. 3 B defines the SR load (Ln) as the total SR [Ca2+] ( in Eq. 4) at the onset of the nth voltage pulse. Fig. 3 A shows the discrete-time map, H, that relates the size of Ln with Ln+1 of the subsequent cycle, Ln+1 = H(Ln). The solid line in Fig. 3 B is computed by integrating the model equations over one cycle for various initial SR loads, under the assumption that at the beginning of the nth cycle, and . This is justified by the observation that before a voltage pulse, the junctional and network SR [Ca2+] are often approximately in equilibrium (Fig. 1 D, dashed and solid lines). The equilibrium point of the discrete-time map satisfies L∗ = H(L∗) and corresponds to a balance of SR fluxes over the stimulus cycle. In Fig. 3 A, the fixed point is unstable (|H′(L∗)| < 1) and consecutive values of Ln are alternately larger and smaller than L∗. The black circles and dotted lines obtained from the moment-closure simulation (Fig. 3) cobweb the discrete-time map, H. Thus, we conclude that the map accurately represents the dynamics of the alternating response.
Figure 3.
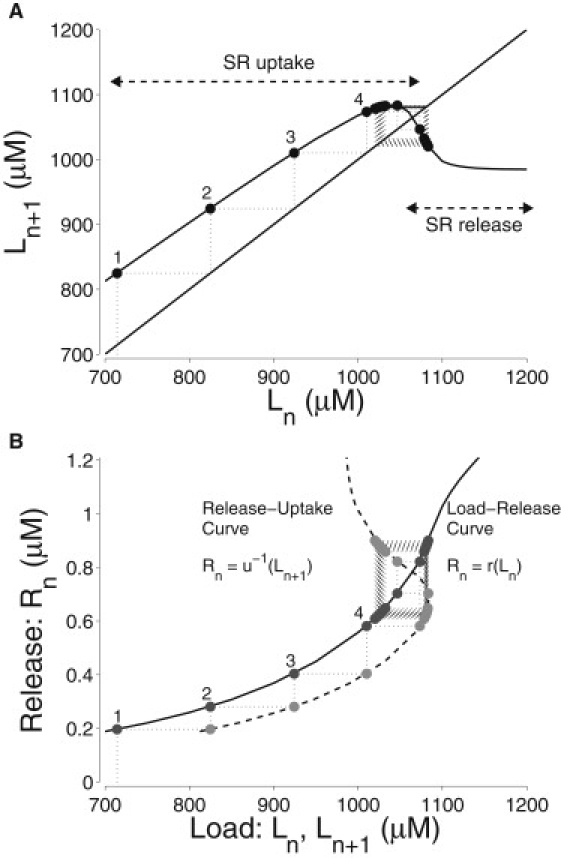
(A) Return map of the moment-based whole-cell model that relates the total SR load in a given cycle, Ln, to that of the following cycle Ln+1. Numbered circles correspond to peaks in Fig. 1A. The solid curve is obtained by integrating the model equations over the 1-Hz stimulus cycle under the assumption that jSR compartments are in equilibrium with the network SR at the beginning of the voltage pulse (see text). (B) Corresponding load-release (solid line) and release-uptake (dashed line) functions. Black and gray circles show values obtained directly from the simulation shown in Fig. 1, where the quantities Rn, Ln, and Ln+1 are defined.
Load-release and release-uptake functions
A related approach to analyzing Ca2+ alternans (2,7) begins by defining the release (Rn) as the difference between the maximum total myoplasmic [Ca2+] (; Eq. 4) observed in the nth stimulus cycle and that observed at the beginning of the depolarizing voltage pulse (Fig. 4 A). In a similar way, the uptake on the nth cycle (Un) is defined as the difference between the SR load of the subsequent cycle (Ln+1) and the minimum SR [Ca2+] of cycle n (Fig. 4 B). These quantities are used to define a load-release (Rn = r(Ln)) and a release-uptake function (Ln+1 = u(Rn)). When composed, these functions yield the discrete-time map of the previous section,
| (5) |
Figure 4.
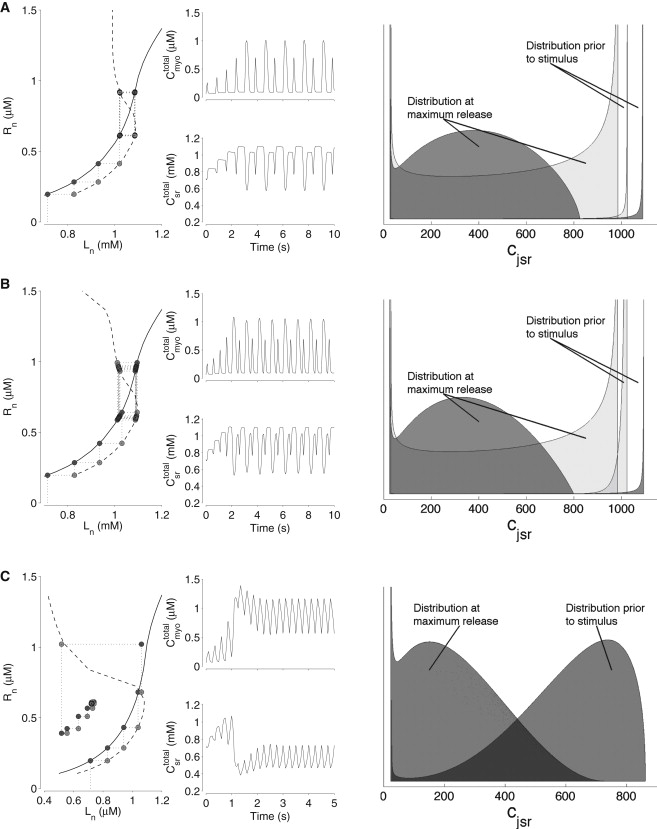
Periodic responses of the moment-based whole-cell model at successively higher stimulation frequencies (1.33, 2, and 4 Hz in A–C, respectively). The leftmost panels show the load-release (solid lines) and release-uptake (dashed lines) curves and values obtained from on-going moment-based simulation (dark and light circles). Middle panels show the total myoplasmic (upper trace) and SR (lower trace) [Ca2+] as a function of time. Rightmost column shows distributions of jSR [Ca2+].
In agreement with prior experimental (23,24) and modeling (6) studies, the calculated load-release curve is a monotonic increasing function of the SR load (see Fig. S5 A). However, the release-uptake curve is not monotonic (see Fig. S5 B). When release events are small, increasing release leads to increased resequestration by SERCA pumps. Large release events can lead to accelerated extrusion of Ca2+ by NCX and decreased resequestration of Ca2+ into the network SR.
Fig. 3 B combines the load-release function (solid curve) and the inverse of the release-uptake function, Rn = u−1(Ln+1) (dashed curve) to construct a two-step discrete-time map (Eq. 5) analogous to maps that have been used to analyze minimal models of alternating Ca2+ responses (2,7). The black and gray circles show the SR load and release from the moment-based simulation of Fig. 1. Similar to the one-step map (Fig. 3 A), these values are consistent with cobwebbing the computed load-release and release-uptake curves. Because the stability condition |H′| = |u′r′| < 1 is not satisfied, the intersection of the load-release and release-uptake curves correctly predicts an unstable equilibrium and alternating Ca2+ response.
Stimulus frequency shifts the release-uptake function
The left columns of Fig. 4, A and B, show load-release and release-uptake curves similar to those in Fig. 3 B, but with the stimulation frequency increased to 1.33 and 2 Hz, respectively. At these stimulation frequencies, the load-release and release-uptake curves (solid and dashed lines, respectively) correctly predict the Ca2+ alternans observed in the moment-based simulations (circles). Note that the load-release function does not change significantly as the stimulation frequency is changed (see also Fig. S7 A). Conversely, the release-uptake curve, Rn = u−1(Ln+1), changes shape and shifts to the right, reflecting the frequency dependence of the steady-state SR load determined by the balance of Ca2+ influx during the voltage pulse and Ca2+ extrusion via NCX during the interpulse interval. The loss of stability that occurs between 0.5 and 1 Hz and results in Ca2+ alternans (see Figs. 1 and 2) is due to the changing slopes at the intersection of the load-release and release-uptake curves as the latter curve moves rightward.
When the stimulation frequency is increased to 4 Hz, the load-release and release-uptake curves predict the presence of alternans, though none are observed in simulation (Fig. 4 C). In this case, the load-release and release-uptake curves do not accurately predict the model response, because the assumptions made for their computation are no longer valid, i.e., and . Note the increased dispersion of the distribution of jSR [Ca2+] during high-frequency stimulation.
Ca2+ fluxes and load-release/release-uptake functions
Fig. 5 shows how two important parameters of the moment-based whole-cell model influence the load-release and release-uptake functions at 1 Hz (solid and dashed lines, respectively; for additional examples, see Fig. S6, A–C). The four black circles in each panel correspond to the alternating Ca2+ response observed with standard parameters (cf. Fig. 2 B). The open and gray circles of Fig. 5, A and B, and those in Fig. S6, A–C, show that Ca2+ alternans can be eliminated by either increasing or decreasing each of five parameters studied: the SERCA pump rate (vserca), the NCX pump rate (), the cytosolic Ca2+ activation rate constant of the RyR megachannel (), the rate constant for luminal Ca2+ regulation of the RyR megachannel (), and the network-to-junctional-SR Ca2+ transfer rate (vrefill).
Figure 5.
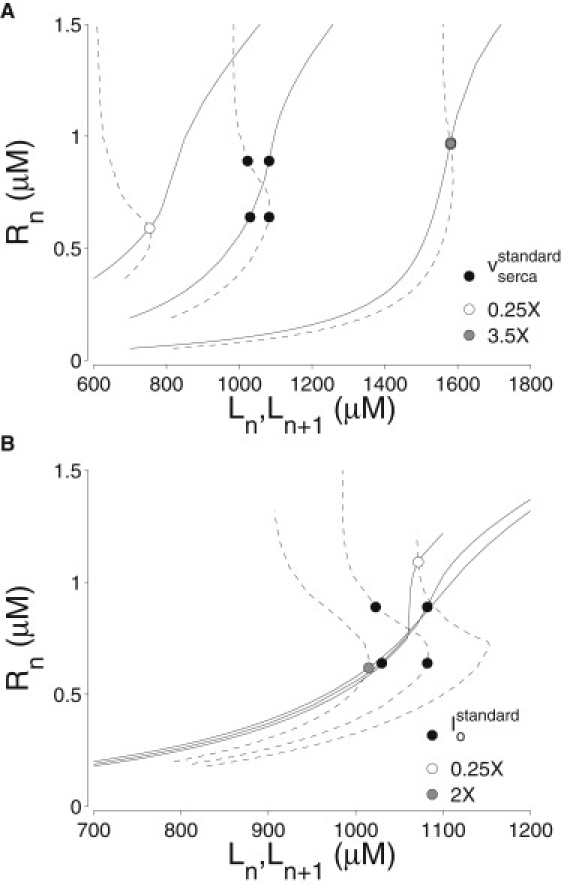
Effect of various model parameters on the load-release (solid lines) and release-uptake (dashed lines) curves computed from the moment-based whole-cell model. Solid circles indicate period-1 or -2 oscillatory responses during 1 Hz stimulation. (A) SERCA pump rate (vserca) at standard value (see Table S1, Table S2, and Table S3), 0.25× (decreased), and 3.5× (increased). (B) NCX pump rate () at standard value, 0.6×, and 1.2×.
Increasing either vserca or vrefill shifts both curves rightward into the region corresponding to high SR loads. The load-release curve also becomes steeper as the SERCA pump rate increases, reminiscent of experimental observations during β-adrenergic stimulation (25,26). Desensitizing the RyR megachannel through changes in either cytosolic or luminal Ca2+ regulation results in a similar shift of both curves to higher SR loads. Increasing also shifts the release-uptake curve to higher SR loads, but has little effect on the load-release curve. In general, the steepness of the load-release function (viewed in isolation from the release-uptake curve) cannot be used to predict the presence or absence of Ca2+ alternans.
Fig. 6, A and B, also shows how the alternating Ca2+ response exhibited by the model with standard parameters can be eliminated by increasing or decreasing both vserca and . The maximum bulk myoplasmic [Ca2+] (circles) is an increasing function of vserca and a decreasing function of ; consequently, these two parameters can be played off one another. For example, the range of vserca leading to alternans shifts to greater values when is increased (not shown). The black circles of Fig. 4 C show that different network-to-junctional-SR transfer rates (vrefill) can also change the dynamics of alternating Ca2+ responses.
Figure 6.
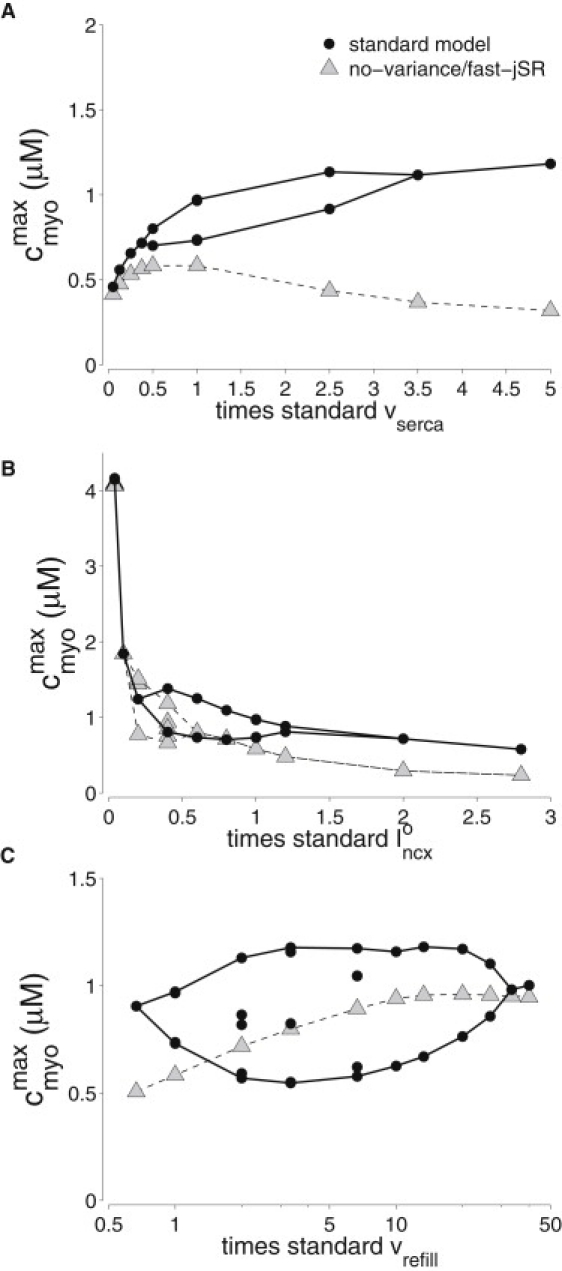
Maximum of the myoplasmic [Ca2+] transient during stable oscillations is plotted as a function of SERCA pump rate, vserca (A), NCX pump rate, (B), and network-to-junctional-SR Ca2+ transfer rate, vrefill (C). One, two, or four distinct maxima for a given parameter value indicate period-1, -2, and -4 cycles, respectively. Results from the standard model that uses moment-based simulation to represent heterogeneous jSR [Ca2+] (circles) are compared to those from the no-variance fast-jSR model simplifications (triangles).
Variance and slow dynamics of jSR [Ca2+] influence alternans
To investigate the functional significance of the variance and slow dynamics of jSR [Ca2+] in alternating Ca2+ responses, the standard model was compared to a simplified model that assumes rapid refilling of jSR compartments (Eq. S36). In this no-variance/fast-jSR model simplification, balance of release () and refill () fluxes enslaves jSR [Ca2+] to the diadic subspace and network SR [Ca2+] (the relationship depends on the CaRU state). The triangles in Fig. 6 B show that the no-variance/fast-jSR model exhibits alternating Ca2+ responses at 1 Hz (note bubble when is 50% of the standard value). On the other hand, for most parameter values surveyed in Fig. 4, the response of the no-variance/fast-jSR model is dramatically different from that of the standard model (compare triangles and circles). The observation that this model simplification often does not exhibit Ca2+ alternans for the same parameter values as the standard model holds over a wide range of stimulation frequencies (Fig. S8). The calculated load-release and release-uptake curves of the no-variance/fast-jSR model are also quite distinct from the standard model (see Fig. S7 B). The lack of agreement between these two models underscores the importance of accounting for heterogeneous jSR [Ca2+] in whole-cell simulations of Ca2+ alternans.
Discussion
Ca2+ alternans, beat-to-beat variations in Ca2+ transients, are recognized as an important factor in the development of cardiac arrhythmias. Ca2+ alternans are generally thought to arise from inherent instability of myocyte Ca2+ handling that can be probed using discrete-time maps and bifurcation theory. For example, Ca2+ alternans are associated with an unstable equilibrium of the map relating SR Ca2+ loads on subsequent cycles (Fig. 3 A). Alternating and nonalternating responses can be further dissected by considering how the amount of SR release depends on SR content (the load-release function) and how the process of Ca2+ uptake into the SR depends on the myoplasmic Ca2+ transient (release-uptake function; see Fig. 3 B).
In this study, we used a recently introduced moment-based modeling formalism to explore the dynamics of Ca2+ alternans in a whole-cell model that represents heterogeneous diadic subspace and jSR [Ca2+] and the consequences of this heterogeneity on Ca2+ cycling (10,14). Although the moment-based modeling approach is not explicitly spatial, the formalism takes into account the translocation of Ca2+ between the diadic subspace and the bulk myoplasm, as well as the network and junctional SR. The collective behavior includes coupling of CaRUs that occurs when diadic subspace Ca2+ from an activated CaRU diffuses through the bulk myoplasm into the diadic subspaces of other CaRUs. The description of the CaRU presented here is based on our previous work (10,14) and does not include a mechanism for Ca2+ or voltage inactivation of DHPRs or refractory RyR states. However, the luminal dependence of RyR open probability introduces a refractory time, because the jSR needs to replenish before the RyR megachannel is capable of opening again.
The moment-based approach to representing heterogeneous jSR [Ca2+] requires far less computer time than a traditional Monte Carlo approach. This computational efficiency greatly facilitates our parameter studies, exploring the effects on Ca2+ alternans of both stimulation frequency and manipulations of key Ca2+ handling processes, including SERCA-mediated SR Ca2+ uptake, sensitivity of RyR-mediated release, NCX activity, and the network-to-jSR Ca2+ transfer rate. We find that Ca2+ alternans occur within specific windows of stimulation frequency and values for the above-mentioned Ca2+ handling parameters. We also found that the steepness of the load-release function is not by itself a good predictor of Ca2+ alternans. Rather, the loss of stability of period-1 oscillations and the transition to Ca2+ alternans arises from the interrelation of SR Ca2+ load-release and release-uptake functions (Fig. 5). Although both curves can be manipulated by parameter changes that influence the dynamic interplay between cellular Ca2+ fluxes, the release-uptake function is more sensitive to stimulation frequency (Fig. S7 A) and NCX activity (Fig. 5 B).
Junctional SR [Ca2+] heterogeneity and Ca2+ alternans
The moment-based modeling approach encourages detailed analysis of heterogeneous jSR [Ca2+] during Ca2+ alternans. Stimulation at 0.5 Hz results in normal Ca2+ cycling (a stable period-1 oscillation) with Ca2+ release heterogeneity manifesting itself as a broad u-shape distribution of jSR [Ca2+] (Fig. 2 A). At 1–2 Hz, alternating Ca2+ responses (stable period-2 oscillations) were associated with two distinct jSR [Ca2+] distribution patterns on subsequent cycles: 1), a broad, nearly normal u-shape distribution associated with the small Ca2+ transient; and 2), an n-shape distribution skewed toward lower jSR [Ca2+] associated with the large Ca2+ transient (Figs. 2 B and 4, A and B). At 0.5–2 Hz, the jSR [Ca2+] distribution is focused near the network SR [Ca2+] at the beginning of the stimulus pulse, and distributed more broadly and with a lower mean at the end of the stimulus. During 4-Hz stimulation, the period-1 oscillation is again stable and the jSR [Ca2+] distribution pattern before the stimulus also becomes broadly distributed (Fig. 4 C).
These results are intuitively straightforward. During normal Ca2+ transients the broad u-shaped jSR [Ca2+] distribution at the end of the stimulus pulse reflects the nonuniform probability of CaRU recruitment and stochastic RyR-megachannel open dwell times, leading to varying extents of jSR depletion. During Ca2+ alternans, activation of CaRUs in the cycle with larger SR Ca2+ release leads to excessive depletion of jSR [Ca2+] and diminished CaRU activation in the subsequent cycle. Conversely, the cycle with smaller SR Ca2+ release results in less extensive jSR [Ca2+] depletion and greater CaRU activation on the next cycle. Differences in activation of CaRUs during the large versus small Ca2+ transient are a consequence of both the fidelity of triggered release as well as the extent of cross-activation of CaRUs coupled via the bulk myoplasm (Fig. S4). These observations are consistent with a recent analysis of period-doubling bifurcations in a two-dimensional array of coupled stochastically excitable elements (27) and traditional Monte Carlo simulations of spatially explicit local control models (9,28,29).
Myocyte Ca2+ handling parameters and Ca2+ alternans
The computational efficiency of the moment-based whole-cell model permitted us to investigate the relationship between alternans and parameter values for key Ca2+ handling systems including SERCA-mediated SR Ca2+ uptake, Ca2+ regulation of the RyR megachannel, and NCX-mediated Ca2+ removal. Slowed SR Ca2+ uptake by SERCA is generally considered to be conducive to alternans, whereas accelerated uptake is believed to stabilize Ca2+ cycling (2,3,5,7,30). Reports on the consequences of alterations in RyR function have been conflicting; some studies show alternans after partial inhibition of RyRs (7,31), and others link alternans to enhanced RyR activity (21,32). The impact of changes of NCX on Ca2+ alternans has, to our knowledge, not been explored. This study demonstrates that alternans occurs within a certain window of parameter values for these different Ca2+ transport systems (Figs. 5 and 6). This behavior is analogous to the frequency dependence of alternans observed in whole-cell models using traditional Monte Carlo simulation (9,28,29), minimal formulations of Ca2+ cycling (2,4,6–8,22), and to that observed here (Fig. 1, C and D), in which a band of intermediate stimulation frequencies leads to alternans. This biphasic dependence of Ca2+ alterans on Ca2+-handling parameter values could account for some of the apparent discrepancies in reports regarding the functional consequence of changes in certain Ca2+ transport systems. For example, differences in the set point for cytosolic and luminal Ca2+ regulation of RyRs could explain why alternans was caused by RyR inhibition in some studies and linked to enhanced RyR activity in others (Fig. S6, A and B).
Dynamic interactions between load-release and release-uptake functions
Our analysis of Ca2+ alternans closely follows the approach used to probe minimal models of Ca2+ cycling for period-doubling bifurcations (2,4,6,7). To our knowledge, this is the first time such techniques have been methodically applied to a whole-cell model that accurately represents heterogeneous jSR [Ca2+] (Fig. 3). At low stimulation frequencies, load-release and release-uptake functions calculated from the moment-closure model under the assumption that junctional and network SR Ca2+ are equilibrated at the beginning of the voltage pulse are consistent with the simulations of Ca2+ alternans that do not make this assumption (Fig. 4, A and B). However, at higher stimulation frequencies, load-release and release-uptake functions calculated in this fashion do not correctly predict the onset of Ca2+ alternans, because the jSR does not equilibrate with the network SR during the interpulse interval (Fig. 4 C).
A steep relationship between SR Ca2+ content and Ca2+ release is often considered to be a crucial factor accounting for the generation of Ca2+ alternans (2,5,9). Our moment-based whole-cell simulations show that the load-release relationship by itself is an inadequate predictor of Ca2+ alternans. For example, conditions such as increasing pacing frequency or reducing NCX-mediated Ca2+ extrusion cause alternans without modifying the load-release function (Fig. 5 B and Fig. S7 A). In addition, changes in RyR parameters that led to a steepened load-release function diminished, rather than promoted, Ca2+ alternans (Fig. 5 B and Fig. S6, A and B). The reason alternans cannot be understood entirely by the slope of the load-release function is, of course, the dynamic linkage between SR Ca2+ release and uptake. Just as SR load determines release, the amplitude of release effects SR Ca2+ uptake and load on subsequent cycles by activating various amounts of cellular Ca2+ extrusion (Fig. 3 D). Consequently, release and uptake mutually determine the onset of Ca2+ alternans (Fig. 3, A and B). For example, both increased stimulation frequency (Fig. S7 A) and reduced NCX activity (Fig. 5 B) shift the release-uptake function to higher SR loads and thereby change the intersection of this curve with the load-release function. The slope of these curves at the fixed point also changes and, as discussed above and in previous studies (7), this aspect of the load-release and release-uptake functions determines the stability of the period-1 oscillation. In a similar way, lowering RyR Ca2+ sensitivity increases the steepness of the load-release curve and shifts this curve to the right, but it also drastically alters the slope of the release-uptake function, thereby stabilizing Ca2+ cycling (Fig. S6 A).
Limitations of the model
The compartmental structure of the whole-cell model and the functional form of the Ca2+ fluxes are consistent with prior work and do not warrant extensive discussion (10,14). On the other hand, the 12-state Ca2+ release unit used in this modeling study (Eq. 1) is quite minimal. Following procedures in our previous work (10), we used a six-state RyR megachannel model with essentially all-or-none gating (33–35) and a two-state model of the L-type Ca2+ channel that includes voltage-dependent activation but, for simplicity, not voltage- and Ca2+-dependent inactivation. Neglecting these features of stimulated Ca2+ influx is a model limitation that will be overcome in future work. Note that use of more complex and realistic stochastic models of the L-type Ca2+ channel or RyR cluster will result in a CaRU model with far more than 12 states, which reduces the efficiency of moment-based simulations compared to Monte Carlo simulations. Therefore, an important avenue of future research is the automated reduction of CaRU models for multiscale simulation of local and global Ca2+ responses in myocytes and other cell types (36).
Because the dynamics of each CaRU is responsive to the associated diadic subspace and jSR [Ca2+], the moment-based modeling formalism is properly described as a stochastic local-control whole-cell model. However, the specifics of the formalism presented here assume that the diadic subspace [Ca2+] associated with each CaRU rapidly equilibrates with the corresponding jSR [Ca2+] and the bulk myoplasmic [Ca2+] (10). This rapid equilibrium assumption is reasonable given the small effective volume of the diadic subspace and does not represent a significant model limitation. On the other hand, the failure of the no-variance/fast-jSR model simplification to recapitulate Ca2+ alternans exhibited by the full model (Fig. 6 and Fig. S7) demonstrates that an assumption of rapid equilibration of jSR [Ca2+] is debilitating.
The most important caveat to this modeling approach is that one must consider the trade-off between 1), the computational efficiency of using moment equations to represent heterogeneous local Ca2+; and 2), the limitations of using a mathematical formalism that is not explicitly spatial. The formalism takes into account heterogeneous diadic subspace and jSR [Ca2+], the (fast) translocation of Ca2+ between the diadic subspace and the bulk myoplasm, and the (slow) translocation of Ca2+ between network and junctional SR. On the other hand, the CaRUs influence each other only through their contribution to increases in bulk myoplasmic [Ca2+] and decreases in network SR [Ca2+]. This global coupling of local Ca2+ signals represents an intriguing balance between computational efficiency and physiological realism. However, it is exact only in the limit of fast diffusion of myoplasmic and network SR Ca2+ and cannot be used to study the possible role of subcellular Ca2+ waves in the genesis of Ca2+ alternans.
The importance of accounting for heterogeneous jSR Ca2+
Our calculations show that it is important to account for heterogenous jSR [Ca2+] in whole-cell simulations of Ca2+ alternans. This heterogeneity can be simulated using the moment-based approach chosen here (10), the original population density formulation (14), or other computationally less efficient simulation techniques that involve integration of ODEs coupled to Markov chains (37). Comparison of the moment-based standard model with the no-variance/fast-jSR simplification suggests that—whatever modeling approach may be preferred in a given context—it is essential for physiological realism to represent the slow dynamics of jSR [Ca2+], as well as CaRU state-dependent heterogeneity (Fig. 6). That is, if the dynamics of jSR refilling is indeed on the order of 10–200 ms, as suggested by prior modeling and experiment (17–20), then multiscale modeling approaches that assume rapid equilibration of jSR [Ca2+] cannot be expected to correctly reproduce alternating Ca2+ responses, despite the fact that such an approach has been successfully employed in previous studies of cardiac CICR (11–13).
Our standard parameter set corresponds to a jSR refilling time constant of τrefill = = 32 ms (see Table S1). In this case, the no-variance/fast-jSR model simplification does not even qualitatively agree with the standard model until jSR refilling has been accelerated 50-fold (Fig. 4 C). When vrefill is chosen so that τrefill < 1 ms, the jSR in the standard model is essentially in a CaRU state-dependent quasistatic equilibrium with the bulk myoplasmic and SR [Ca2+], and the no-variance/fast-jSR model simplification agrees with the standard model (no alternans at a stimulation frequency of 1 Hz). This suggests that slow jSR dynamics is an aspect of local Ca2+ signaling that has consequences for global Ca2+ responses that may be difficult to predict. In particular, Fig. 6 A shows that it may not be possible to compensate for an assumption of fast jSR refilling by decreasing SERCA activity, regardless of how intuitive this suggestion may seem.
Supporting Material
Eight figures, three tables, and further details of the model formulation are available at http://www.biophysj.org/biophysj/supplemental/S0006-3495(10)00530-8.
Supporting Material
Acknowledgments
G.D.S. and S.G. jointly mentored M.A.H. Some of these results previously appeared in abstract form (38).
This material is based upon work supported by the National Science Foundation (grants 0133132 and 0443843 to G.D.S.) and the National Institutes of Health (grants HL074045 and HL063043 to S.G.). G.D.S. gratefully acknowledges a research leave during academic year 2007–2008 supported by the College of William and Mary and a long-term visitor position at the Mathematical Biosciences Institute at Ohio State University.
References
- 1.Myles R.C., Burton F.L., Smith G.L. The link between repolarisation alternans and ventricular arrhythmia: does the cellular phenomenon extend to the clinical problem? J. Mol. Cell. Cardiol. 2008;45:1–10. doi: 10.1016/j.yjmcc.2008.03.024. [DOI] [PubMed] [Google Scholar]
- 2.Weiss J.N., Karma A., Qu Z. From pulsus to pulseless: the saga of cardiac alternans. Circ. Res. 2006;98:1244–1253. doi: 10.1161/01.RES.0000224540.97431.f0. [DOI] [PubMed] [Google Scholar]
- 3.Laurita K.R., Rosenbaum D.S. Cellular mechanisms of arrhythmogenic cardiac alternans. Prog. Biophys. Mol. Biol. 2008;97:332–347. doi: 10.1016/j.pbiomolbio.2008.02.014. [DOI] [PMC free article] [PubMed] [Google Scholar]
- 4.Shiferaw Y., Sato D., Karma A. Coupled dynamics of voltage and calcium in paced cardiac cells. Phys. Rev. E Stat. Nonlin. Soft Matter Phys. 2005;71:021903. doi: 10.1103/PhysRevE.71.021903. [DOI] [PMC free article] [PubMed] [Google Scholar]
- 5.Eisner D.A., Li Y., O'Neill S.C. Alternans of intracellular calcium: mechanism and significance. Heart Rhythm. 2006;3:743–745. doi: 10.1016/j.hrthm.2005.12.020. [DOI] [PubMed] [Google Scholar]
- 6.Qu Z., Shiferaw Y., Weiss J.N. Nonlinear dynamics of cardiac excitation-contraction coupling: an iterated map study. Phys. Rev. E Stat. Nonlin. Soft Matter Phys. 2007;75:011927. doi: 10.1103/PhysRevE.75.011927. [DOI] [PubMed] [Google Scholar]
- 7.Xie L.H., Sato D., Weiss J.N. Intracellular Ca alternans: coordinated regulation by sarcoplasmic reticulum release, uptake, and leak. Biophys. J. 2008;95:3100–3110. doi: 10.1529/biophysj.108.130955. [DOI] [PMC free article] [PubMed] [Google Scholar]
- 8.Shiferaw Y., Watanabe M.A., Karma A. Model of intracellular calcium cycling in ventricular myocytes. Biophys. J. 2003;85:3666–3686. doi: 10.1016/S0006-3495(03)74784-5. [DOI] [PMC free article] [PubMed] [Google Scholar]
- 9.Tao T., O'Neill S.C., Zhang H. Alternans of cardiac calcium cycling in a cluster of ryanodine receptors: a simulation study. Am. J. Physiol. Heart Circ. Physiol. 2008;295:H598–H609. doi: 10.1152/ajpheart.01086.2007. [DOI] [PMC free article] [PubMed] [Google Scholar]
- 10.Williams G.S.B., Huertas M.A., Smith G.D. Moment closure for local control models of calcium-induced calcium release in cardiac myocytes. Biophys. J. 2008;95:1689–1703. doi: 10.1529/biophysj.107.125948. [DOI] [PMC free article] [PubMed] [Google Scholar]
- 11.Hinch R., Greenstein J.L., Winslow R.L. A simplified local control model of calcium-induced calcium release in cardiac ventricular myocytes. Biophys. J. 2004;87:3723–3736. doi: 10.1529/biophysj.104.049973. [DOI] [PMC free article] [PubMed] [Google Scholar]
- 12.Greenstein J.L., Hinch R., Winslow R.L. Mechanisms of excitation-contraction coupling in an integrative model of the cardiac ventricular myocyte. Biophys. J. 2006;90:77–91. doi: 10.1529/biophysj.105.065169. [DOI] [PMC free article] [PubMed] [Google Scholar]
- 13.Hinch R., Greenstein J.L., Winslow R.L. Multi-scale models of local control of calcium induced calcium release. Prog. Biophys. Mol. Biol. 2006;90:136–150. doi: 10.1016/j.pbiomolbio.2005.05.014. [DOI] [PubMed] [Google Scholar]
- 14.Williams G.S.B., Huertas M.A., Smith G.D. A probability density approach to modeling local control of calcium-induced calcium release in cardiac myocytes. Biophys. J. 2007;92:2311–2328. doi: 10.1529/biophysj.106.099861. [DOI] [PMC free article] [PubMed] [Google Scholar]
- 15.Mazzag B., Tignanelli C.J., Smith G.D. The effect of residual Ca2+ on the stochastic gating of Ca2+-regulated Ca2+ channel models. J. Theor. Biol. 2005;235:121–150. doi: 10.1016/j.jtbi.2004.12.024. [DOI] [PubMed] [Google Scholar]
- 16.Huertas M.A., Smith G.D. The dynamics of luminal depletion and the stochastic gating of Ca2+-activated Ca2+ channels and release sites. J. Theor. Biol. 2007;246:332–354. doi: 10.1016/j.jtbi.2007.01.003. [DOI] [PubMed] [Google Scholar]
- 17.Luo C.H., Rudy Y. A dynamic model of the cardiac ventricular action potential. I. Simulations of ionic currents and concentration changes. Circ. Res. 1994;74:1071–1096. doi: 10.1161/01.res.74.6.1071. [DOI] [PubMed] [Google Scholar]
- 18.Brochet D.X., Yang D., Cheng H. Ca2+ blinks: rapid nanoscopic store calcium signaling. Proc. Natl. Acad. Sci. USA. 2005;102:3099–3104. doi: 10.1073/pnas.0500059102. [DOI] [PMC free article] [PubMed] [Google Scholar]
- 19.Sobie E.A., Song L.S., Lederer W.J. Local recovery of Ca2+ release in rat ventricular myocytes. J. Physiol. 2005;565:441–447. doi: 10.1113/jphysiol.2005.086496. [DOI] [PMC free article] [PubMed] [Google Scholar]
- 20.Jafri M.S., Rice J.J., Winslow R.L. Cardiac Ca2+ dynamics: the roles of ryanodine receptor adaptation and sarcoplasmic reticulum load. Biophys. J. 1998;74:1149–1168. doi: 10.1016/S0006-3495(98)77832-4. [DOI] [PMC free article] [PubMed] [Google Scholar]
- 21.Belevych A.E., Terentyev D., Györke S. Redox modification of ryanodine receptors underlies calcium alternans in a canine model of sudden cardiac death. Cardiovasc. Res. 2009;84:387–395. doi: 10.1093/cvr/cvp246. [DOI] [PMC free article] [PubMed] [Google Scholar]
- 22.Shiferaw Y., Qu Z., Weiss J.N. Nonlinear dynamics of paced cardiac cells. Ann. N. Y. Acad. Sci. 2006;1080:376–394. doi: 10.1196/annals.1380.028.x. [DOI] [PubMed] [Google Scholar]
- 23.Bassani J.W., Yuan W., Bers D.M. Fractional SR Ca release is regulated by trigger Ca and SR Ca content in cardiac myocytes. Am. J. Physiol. 1995;268:C1313–C1319. doi: 10.1152/ajpcell.1995.268.5.C1313. [DOI] [PubMed] [Google Scholar]
- 24.Shannon T.R., Ginsburg K.S., Bers D.M. Potentiation of fractional sarcoplasmic reticulum calcium release by total and free intra-sarcoplasmic reticulum calcium concentration. Biophys. J. 2000;78:334–343. doi: 10.1016/S0006-3495(00)76596-9. [DOI] [PMC free article] [PubMed] [Google Scholar]
- 25.Callewaert G., Cleemann L., Morad M. Epinephrine enhances Ca2+ current-regulated Ca2+ release and Ca2+ reuptake in rat ventricular myocytes. Proc. Natl. Acad. Sci. USA. 1988;85:2009–2013. doi: 10.1073/pnas.85.6.2009. [DOI] [PMC free article] [PubMed] [Google Scholar]
- 26.Hussain M., Orchard C.H. Sarcoplasmic reticulum Ca2+ content, L-type Ca2+ current and the Ca2+ transient in rat myocytes during β-adrenergic stimulation. J. Physiol. 1997;505:385–402. doi: 10.1111/j.1469-7793.1997.385bb.x. [DOI] [PMC free article] [PubMed] [Google Scholar]
- 27.Cui X., Rovetti R.J., Qu Z. Period-doubling bifurcation in an array of coupled stochastically excitable elements subjected to global periodic forcing. Phys. Rev. Lett. 2009;103:044102. doi: 10.1103/PhysRevLett.103.044102. [DOI] [PMC free article] [PubMed] [Google Scholar]
- 28.Restrepo J.G., Weiss J.N., Karma A. Calsequestrin-mediated mechanism for cellular calcium transient alternans. Biophys. J. 2008;95:3767–3789. doi: 10.1529/biophysj.108.130419. [DOI] [PMC free article] [PubMed] [Google Scholar]
- 29.Restrepo J.G., Karma A. Spatiotemporal intracellular calcium dynamics during cardiac alternans. Chaos. 2009;19:037115. doi: 10.1063/1.3207835. [DOI] [PMC free article] [PubMed] [Google Scholar]
- 30.Kameyama M., Hirayama Y., Takano T. Possible contribution of the sarcoplasmic reticulum Ca2+ pump function to electrical and mechanical alternans. J. Electrocardiol. 2003;36:125–135. doi: 10.1054/jelc.2003.50021. [DOI] [PubMed] [Google Scholar]
- 31.Díaz M.E., Eisner D.A., O'Neill S.C. Depressed ryanodine receptor activity increases variability and duration of the systolic Ca2+ transient in rat ventricular myocytes. Circ. Res. 2002;91:585–593. doi: 10.1161/01.res.0000035527.53514.c2. [DOI] [PubMed] [Google Scholar]
- 32.Lehnart S.E., Terrenoire C., Marks A.R. Stabilization of cardiac ryanodine receptor prevents intracellular calcium leak and arrhythmias. Proc. Natl. Acad. Sci. USA. 2006;103:7906–7910. doi: 10.1073/pnas.0602133103. [DOI] [PMC free article] [PubMed] [Google Scholar]
- 33.Stern M.D. Theory of excitation-contraction coupling in cardiac muscle. Biophys. J. 1992;63:497–517. doi: 10.1016/S0006-3495(92)81615-6. [DOI] [PMC free article] [PubMed] [Google Scholar]
- 34.Rice J.J., Jafri M.S., Winslow R.L. Modeling gain and gradedness of Ca2+ release in the functional unit of the cardiac diadic space. Biophys. J. 1999;77:1871–1884. doi: 10.1016/s0006-3495(99)77030-x. [DOI] [PMC free article] [PubMed] [Google Scholar]
- 35.Sobie E.A., Dilly K.W., Jafri M.S. Termination of cardiac Ca2+ sparks: an investigative mathematical model of calcium-induced calcium release. Biophys. J. 2002;83:59–78. doi: 10.1016/s0006-3495(02)75149-7. [DOI] [PMC free article] [PubMed] [Google Scholar]
- 36.Hao Y., Kemper P., Smith G.D. Reduction of calcium release site models via fast/slow analysis and iterative aggregation/disaggregation. Chaos. 2009;19:037107. doi: 10.1063/1.3223663. [DOI] [PubMed] [Google Scholar]
- 37.Greenstein J.L., Winslow R.L. An integrative model of the cardiac ventricular myocyte incorporating local control of Ca2+ release. Biophys. J. 2002;83:2918–2945. doi: 10.1016/S0006-3495(02)75301-0. [DOI] [PMC free article] [PubMed] [Google Scholar]
- 38.Huertas M.A., Smith G.D., Györke S. Analysis of calcium alternans in a cardiac myocyte model that uses moment equations to represent heterogenous junctional SR calcium 2009 Biophysical Society Meeting Abstracts. Biophy. J. 2009;(Supplement 1) doi: 10.1016/j.bpj.2010.04.032. Abstract, 1414-Pos. [DOI] [PMC free article] [PubMed] [Google Scholar]
Associated Data
This section collects any data citations, data availability statements, or supplementary materials included in this article.