Abstract
IL15 and its receptors in cerebral microvascular endothelial cells play an important role in mediating neuroinflammatory signaling across the blood-brain barrier (BBB). Although alternative splice variants of IL15Rα receptor are seen in immune cells, the presence and functions of splice variants have not been studied in the cerebral endothelia that compose the BBB. In this study, we identified five splice variants from mouse cerebral capillaries by RT-PCR, cloning, and DNA sequencing, and performed domain analysis. Four of these isoforms have never been described in any tissue. All isoforms were detected by qPCR in enriched mouse cerebral microvessels and their expression was increased by in-vivo TNF treatment. To determine their functions, plasmids encoding individual isoforms were transfected into RBE4 cerebral endothelial cells. All of these predicted alkalinic proteins were expressed and most showed post-translational modifications. There were variations in their subcellular distribution. Only the full length IL15Rα and to a lesser degree isoform α1 were trafficked to the cell surface 24 h after overexpression. As shown by a luciferase reporter for Signal Transducter and Activator of Transcription (STAT)-3, overexpression of isoforms α2 and α4 reduced basal STAT3 activation. In comparison with the control, overexpression of the full length IL15Rα had a greater effect in increasing IL15-induced STAT3 transactivation than other isoforms. The results show that IL15 signaling in cerebral endothelia is probably an orchestrated effect of all IL15Rα splice variants that determine the eventual outcome by differential regulation.
Keywords: IL15, IL15Rα, splice variants, brain, blood-brain barrier, endothelial cells, STAT3
Introduction
Interleukin (IL)-15 is an unusual cytokine in that it shows multi-level regulatory controls in protein synthesis of both the ligand and its specific receptor IL15Rα. This includes multiple splice variants, post-translational modifications, and acute regulation of protein turnover. In this study, we identified several novel splice variants of IL15Rα in cerebral endothelial cells, tested their regulatory changes, and determined their signaling functions.
The full length IL15Rα contains seven domains: signal peptide, Sushi, linker, two threonine/proline rich regions, transmembrane sequence, and cytoplasmic tail. The Sushi domain has a typical size of 60–70 amino acid residues, contains two cysteine bridges (Perkins et al. 1988), and has been shown to be essential for ligand binding of IL15Rα (Dubois et al. 1999). Multiple IL15Rα splicing variants have been identified in both human and mouse tissues and cell lines (Anderson et al. 1995;Dubois et al. 1999;Bulanova et al. 2003). There are eight different splicing variants of human IL15Rα, differing by either the presence or absence of exon 2 (which encodes the Sushi domain), exon 3 (which encodes the linker region), and the alternative use of exons 7 and 7' (which encode the cytoplasmic tail) (Dubois et al. 1999). Mouse bone marrow-derived mast cells have another three novel IL15Rα splicing variants that lack exon 4 (Δ4), exons 3 and 4(Δ3,4), or exons 3, 4 and 5 (Δ3,4,5) (Bulanova et al. 2003). The IL15Rα isoforms show several patterns of subcellular localization. In the COS-7 cell model, the full length human IL15Rα (IL15Rα WT) is mainly associated with nuclear membrane. When exon 2 is depleted, the isoform is present in the endoplasmic reticulum (ER), Golgi, and cytoplasmic vesicles (Dubois et al. 1999). By contrast, isoforms Δ4, Δ3, 4, or Δ 3, 4, 5 are predominantly associated with the Golgi and ER (Bulanova et al. 2003).
Functional differences have also been found among the IL15Rα isoforms. Isoforms Δ4 or Δ3, 4 show similar functions to promote BA/F3 cells proliferation as WT IL15Rα. However, the isoform without exons 3, 4, and 5 is only 50 % effective in promoting survival. The functional differences suggest a tightly regulated IL15Rα system by the presence and combination of different isoforms, which are naturally occurring splice variants. The IL15 signaling complex involves heterotrimerization of IL15Rα, IL2Rβ and IL2Rγ. One of the major signaling elements downstream of the IL15-receptor complex is the signal transducer and activator of transcription (STAT) protein (Johnston et al. 1995;de Totero et al. 2008). Therefore, we used a STAT3-luciferase reporter to determine the signaling properties of the IL15Rα isoforms.
We focus on cerebral microvascular endothelial cells in this study because specialized endothelia are the major component of the blood-brain barrier (BBB), providing an interface between the central nervous system and peripheral circulation. The BBB is a three-dimensional capillary structure, and specialized microvascular endothelial cells are the main component regulating permeation of substances and transmission of cellular signals and secondary mediators. Few studies have focused on the functions of the IL15 system at the BBB and in the brain. The complexity of this regulation can be illustrated by the multi-level control of IL15 transport and signaling in cerebral endothelial cells shown by our recent studies. In a microarray analysis, we unexpectedly found that IL15Rα has robust upregulation in response to tumor necrosis factor α (TNF) treatment in rat brain endothelial (RBE)-4 cells, an immortalized cerebral microvascular endothelial cell line that shows many features of the in-vivo BBB. Further qPCR and western blotting studies showed that the upregulation of IL15Rα is evident 2 – 24 h after treatment with 5 ng/ml TNF. TNF treatment also increases cell surface binding and endocytosis of IL15 in RBE4 cells (Pan et al. 2009). These results indicate an important role of IL15 and its receptors in cerebral microvascular endothelial cells. The presence of IL15Rα isoforms in these cells may have as yet unknown functional implications. Even in human umbilical vein endothelial cells (HUVEC) of peripheral endothelial origin, IL15 and IL15Rα can be upregulated by TNF or interferon γ at the cell surface (Liu et al. 2009). In this study, we isolated and characterized five IL15Rα splicing variants from mouse cortical microvessels and introduced them into RBE4 endothelial cells to determine their subcellular distribution and signaling functions.
Materials and Methods
1. Cloning and expression of IL15Rα splicing variants
Brain microvessels were freshly prepared from C57/B6 mice as described previously (Pan et al, 2008). Total RNA was extracted with an RNeasy mini kit (Qiagen, Valencia, CA), and trace amounts of DNA were removed by DNase I digestion and RNA clean-up steps (Zymo Research, Orange, CA). After reverse transcription by use of a High Capacity cDNA Transcription Kit (Applied Biosystems, Foster City, CA), the cDNA of IL15Rα splicing variants was amplified with GoTaq Green Master Mix (Promega, Madison, WI) with primers targeting the start and stop codon of the full length IL15Rα sequence. The primers used were: Forward: 5'-ATGGCCTCGCCGCAGCTCCGGGGCTAT; and Reverse: 5'-TTAGGCTCCTGTGTCTTCATCCTCCT. The PCR products were directly ligated into the TOPO TA cloning vector (Invitrogen, Carlsbad, CA), sequenced, and subcloned into the pcDNA3.1™ directional TOPO expression vector for use in transient transfection into RBE4 cells.
2. TNF treatment, cerebral microvessel enrichment, and real-time RT-PCR (qPCR)
The study was conducted following a protocol approved by the Institutional Animal care and Use Committee. Female C57 mice (n = 5/group, 3 m old, Jackson Laboratories, Bar Harbor, ME) were treated intraperitoneally with either TNF (4.5 μg/mouse) dissolved in the vehicle of phosphate-buffered saline (PBS) for 4 h. After anesthesia and decapitation, cortical microvessels were obtained as described previously (Yu et al. 2007a). qPCR was performed as described previously, by use of the SYBR Green PCR master mix (Pan et al. 2008). The primers used for amplification are listed in Table 1. Standard curves for quantification were generated with template plasmids containing fragments of the respective target genes. The level of expression of the target genes was normalized to that of glyceraldehydes-3-phosphate dehydrogenase (GAPDH) in the same sample.
Table 1.
Sequences of primers for qPCR
| Variant | Forward primer | Reverse primer |
|---|---|---|
| α1 | TCCACCCTGATTGAGTGTG | TAGAGATGGCCATGATGCAC |
| α2 | AGGGAGAGTGGCCATCTCT | GAGAAGGCTGCCTTGATTTG |
| α3 | TCCACCTCCCGTATCTATTG | AGGGAGGGGTCTCCTCT |
| α4 | TTCCAAAATGACGAAAGCCA | TGTCTAAGGAGCCAATGAGC |
| αf | CTCAAGTGCATCAGAGACC | AAAGCTTCTGGCTCTTTTGC |
|
| ||
| GAPDH | TGTGTCCGTCGTGGATCTGA | CCTGCTTCACCACCTTCTTGA |
3. Transient transfection, immunocytochemistry (ICC), and western blotting (WB)
RBE4 cerebral microvessel endothelial cells were provided by Dr. Pierre-Olivier Couraud (Institute of Cochin, Paris, France) and cultured as described previously (Roux et al. 1994;Roux and Couraud 2005;Yu et al. 2007b). At 90 % confluency, RBE4 cells were transfected with one of the IL15Rα splicing variants by use of Lipofectamine 2000 (Invitrogen). Twenty-four hours later, the cells were either fixed with 4 % paraformaldehyde or lysed in ice-cold Cell Lytic buffer (Sigma) containing complete protease inhibitor cocktail (Pierce, Rockford, IL) for further ICC or WB analysis. For signaling pathway studies, RBE4 cells were starved for 3 h after transfection. Then, the cells were stimulated with IL15 for 15 min and lysed in ice-cold Cell Lytic buffer with complete protease inhibitor cocktail for WB analysis. For ICC, cells were permeabilized, blocked, incubated with a goat anti-IL15α primary antibody (Santa Cruz Biotechnology, Santa Cruz, CA) along with an organelle marker. The organelle markers were rabbit anti-calnexin (Santa Cruz Biotechnology) for the ER, rabbit anti-β-COP (Pierce, Rockford, IL) for the Golgi, and mouse anti-LAMP1 (Calbiochem, San Diego, CA) to mark lysosomes. After overnight incubation at 4 °C, the cells were further incubated with the respective Alexa 488 or Alexa 594 labeled secondary antibodies.
To determine post-translational modifications, deglycosylation was performed with the Enzymatic CarboRelease Kit (QA-Bio, Palm Desert, CA). Proteins were denatured in a boiling water bath for 5 min with subsequent addition of detergent. Either N- or O-glycosidase was added to the mixture and incubated at 37 °C for 3 h. This was followed by WB for IL15Rα, thorough washes with PBS, and incubation with horseradish peroxide-conjugated secondary antibodies (Amersham Bioscience, Piscataway, NJ) in PBS containing 0.1 % Tween 20 and 5 % milk. The signals were visualized with enhanced chemiluminescence and WB detection reagents (Amersham Biosciences, Pitscataway, NJ).
4. STAT3 luciferase assay
The pAH-luc-STAT3 reporter plasmid was kindly provided by Dr. Charles Rosenblum (Merck Research Laboratories, Rahway, NJ). STAT3 luciferase assays were conducted as described previously (Rosenblum et al. 1996;Pan et al. 2007;Zhang et al. 2009). IL15Rα splicing variants were transfected into RBE4 cells seeded on 24-well plates at a density of 2×10⁶ /ml. Twenty-two hours after transfection and serum-starvation, the cells were stimulated with IL15 (100 ng/ ml, Peprotech, Rocky Hill, NJ) for 6 h and subjected to STAT3 luciferase assay. Each group had four replicates. All transfections also included a Renilla luciferase vector as an internal reference plasmid.
5. Statistics
Group means are expressed with their standard errors. Comparison within groups was conducted by Student's t-test and differences between control and experimental groups was analyzed by analysis of variance followed by Dunnett's multiple comparison test.
Results
1. Identification of IL15Rα splicing variants in mouse brain cortical microvessels
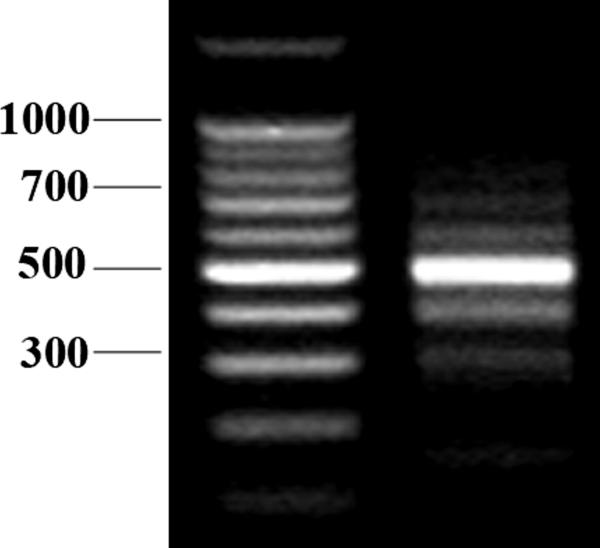
Enriched microvessels from the cerebral cortex were analyzed to avoid interference from circumventricular organs that are outside the BBB and have higher permeability. We detected multiple PCR products by amplification of full-length IL15Rα using a set of primers targeting the start and stop codons. With these primers, five splicing variants were identified, and denoted as α1, α2, α3, α4 and αf, with a size ranging from 352 bp to 792 bp (Fig.1A). DNA sequencing showed similarities between the variants in addition to their 5' and 3' sequences. However, because of frame shift by alternative splicing, the C- terminal amino acid sequences of some variants were different from that of the full-length IL15Rα.. All of the isoforms were predicted to encode alkalinic proteins with an isoelectric focusing point (pI) greater than 8.8 and a molecular weight between 9.9 and 28.1 kD (Table 2).
Fig 1A.
RT-PCR analysis of IL15Rα splicing variants from enriched mouse brain microvessels. The left lane is the 100 bp DNA ladder. The right lane shows PCR products with molecular weights ranging from 200 bp to 800 bp that represent different IL15Rα transcripts.
Table 2.
Basic features of IL15Rα splicing variants and their predicted protein products
| Variant | Length (bp) | Predicted isoforms | ||
|---|---|---|---|---|
| Residue (a.a) | PI | M.W. (kD) | ||
| α1 | 465 | 154 | 9.10 | 16.8 |
| α2 | 352 | 92 | 8.86 | 9.9 |
| α3 | 676 | 200 | 8.90 | 22.4 |
| α4 | 665 | 177 | 9.98 | 19.7 |
| αf | 792 | 263 | 9.26 | 28.1 |
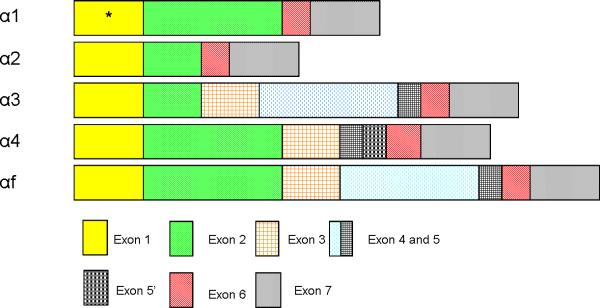
Further sequence analysis showed different splicing patterns of these mRNA variants. The full length IL15Rα (αf) contains all exons (1 – 7). Variant α1 does not contain exons 3, 4, and 5, and is missing one codon encoding leucine in exon1. Variant α2 lacks exons 3, 4, and 5, and half of exon 2. Variant α3 has only half of exon 2. Variant α4 does not have exon 4 but an additional sequence is inserted between exon 5 and exon 6 (Fig.1B).
Fig 1B.
Schematic diagram of IL15Rα splicing variants from mouse brain microvessel endothelial cells. In total, five splicing variants were isolated. Variant αf encodes the full length IL15Rα and contains all exons (1 = signal peptide, 2 = ligand-binding Sushi domain, 3 = linker domain, 4/5 = Thr/Pro rich domain, 6 = transmembrane domain, and 7 = cytoplasmic domain). Variant α1 does not have exons 3,4 and 5, and a codon in exon 1 encoding Leu was absent (marked by *). Variant α2 lacks exons 3, 4, 5 and half of exon 2. Variant α3 lacks half of exon 2. Variant α4 does not have exon 4, but has an additional sequence inserted between exons 5 and 6 denoted as exon 5'.
It is known that exons 1 to 7 encode 7 domains of full length IL15Rα: signal peptide, Sushi domain, linker domain, two threonine/proline rich domains, transmembrane, and cytoplasmic domains of IL15Rα. The alternative splicing resulted in distinct IL15Rα primary sequences as shown in figure S1. All of the variants contain a signal peptide sequence. With the exception of isoforms α1 and αf, the splicing pattern was different. The reading-frame shift resulted in changes in the coding sequences for the isoforms. Isoforms α1, α4 and αf contain a complete Sushi domain capable of ligand binding. By contrast, isoforms α2 and α3 have only half of the Sushi domain, suggesting a reduced efficiency of binding to IL15.
2. Induction of IL15Rα isoforms by TNF in mouse cerebral cortical microvessels
We have shown previously that TNF induces the expression of IL15Rα in mouse cerebral microvessels (Pan et al. 2009). To further determine the regulatory changes of individual IL15Rα isoforms, we performed qPCR on cDNA from enriched mouse cerebral microvessels with or without 4 h of systemic TNF treatment before decapitation. To distinguish the variants, at least one of the primers used to amplify each variant was designed to align with sequences bridging exon-exon junctions. For variant α1, the reverse primer encodes a sequence at the junction between exons 2 and 6 (Fig. 1B). The forward primer for variant α2 encodes a sequence bridging the partial exon 2 and exon 6. Similarly, the reverse primer for variant α3 aligns with a sequence bridging the junction of the partial exon2 and exon 3. The reverse primer for variant α4 encodes a sequence within exon 5'. For the full length IL15Rα, the forward primer encodes the junction of exon 2 and 3 whereas the reverse primer is located at the junction of exons 3 and 4.
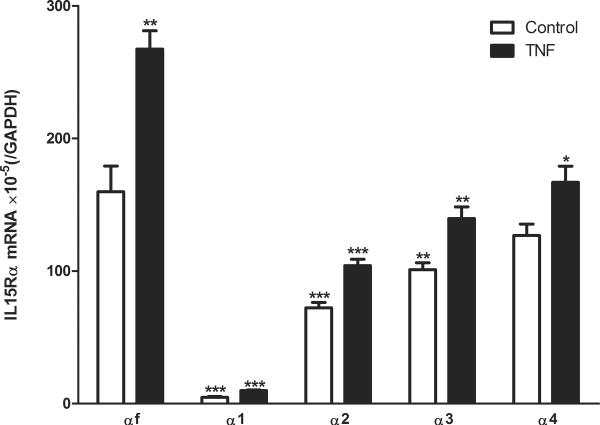
The results show that in the enriched cerebral microvessel from the control mice, the most abundant isoform was IL15Rαf. Isoforms α1, α2, and α3 had significantly lower levels of expression. The least abundant isoform was α1. However, isoform α4 was expressed in a quantity comparable to αf. After TNF stimulation, the expression of all isoforms was significantly increased. The mRNA for isoform αf was significantly higher than that for any other isoforms in the TNF-treated group (Fig.2). Overall, the increase induced by TNF was 1.3–2 fold. IL15Rα1 showed the highest level of induction whereas IL15Rα4 had the least.
Fig. 2.
qPCR of brain microvessels from mice treated with vehicle or TNF. In the control mouse, the most abundant isoform was the full length IL15Rα (αf). Isoforms α1, α2, and α3 were significantly less, but isoform α4 was comparable. The least abundant form was α1. After TNF stimulation, all isoforms showed a significant increase of mRNA. Isoform αf was significantly higher than any others in treated withTNF. Asterisks over the control group (clear bar) show differences in comparison with the αf isoform. Asterisks over the TNF group (solid bar) show differences of the particular isoform with the vehicle treated control. *: p < 0.05; **: p < 0.01; ***: p < 0.005.
3. Subcelluar distribution of the IL15Rα isoforms (Fig.3 and Fig.S2)
Fig 3.
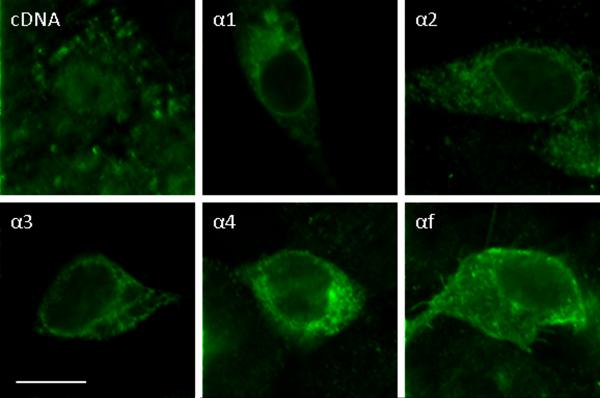
ICC of RBE4 cells transfected with IL15Rα splicing variants. All these isoforms were localized in the cytoplasm. Isoform α1 also showed perinuclear membrane distribution. Scale bars: 10 μm.
At 24 h after transient transfection, about 0.5 – 1 % of the RBE4 cells showed a robust increase of immunofluorescence of IL15Rα, indicating overexpression of the introduced isoforms in these cells. The endogenous IL15Rα was also present, and it mainly showed punctate cytoplasmic distribution (Fig.3). Partial co-localization of endogenous IL15Rα with the ER was seen by confocal microscopic analysis after co-immunostaining with the ER marker calnexin (Fig.S2-A). Isoform α1 showed a prominent perinuclear distribution. There was also weak plasma membrane staining and punctate, diffuse, filamentous distribution in the cytoplasm. Isoform α1 partially co-localized with the Golgi marker β-COP (Fig. S2-B). Isoform α2 showed weak perinuclear distribution and vesicular cytoplasmic staining. Similar to isoform α2, isoforms α3 and α4 were mainly present in cytoplasmic vesicles, and showed partial co-localization with the ER marker calnexin (Fig.S2-A). In addition, isoform α4 showed partial co-localization with the Golgi marker β-COP (Fig.S2-B). By contrast, the full length isoform αf was localized both on the plasma membrane and in the cytoplasm. Both endogenous IL15Rα and the transfected IL15Rα1 also displayed some nuclear distribution. Neither the endogenous nor the transfected IL15Rα isoform co-localized with the lysosomal marker Lamp1 (Fig.S2).
4. WB of IL15Rα isoforms (Fig.4 and Fig.S3)
Fig 4.
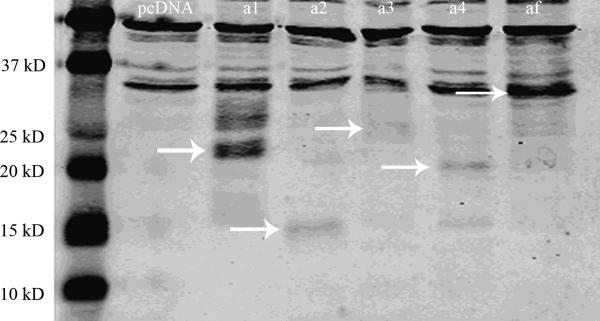
WB of IL15Rα in RBE4 cells transfected with IL15Rα variants. Endogenous IL15Rα was seen in pcDNA and isoform plasmid-transfected cells (33 kD). The overexpressed isoforms are shown by arrows. For isoform α1, there was a 20 kD main signal and a 27 kD protein of lower abundance.
To determine whether the IL15Rα splicing variants encode functional proteins, WB analysis was performed 24 h after transient transfection of the isoforms into RBE4 cells. The RBE4 endothelial cells were chosen because they express endogenous IL15Rα (33 kD, Fig.4), thus containing all the cellular machinery for IL15Rα mRNA and protein processing. All variants were expressed, and the protein signals corresponded to slightly more than the predicted molecular weights, suggesting post-translational modifications. Using a deglycosylating agent, we confirmed the presence of N- glycosylation but not O-glycosylation in most variants. In addition to the main signal of about 20 kD, the cells transfected with isoform α1 showed a second protein of about 27 kD, suggesting additional post-transcriptional modification of this isoform (Fig.4).
5. Signaling functions of IL15Rα splicing variants in RBE4 cells
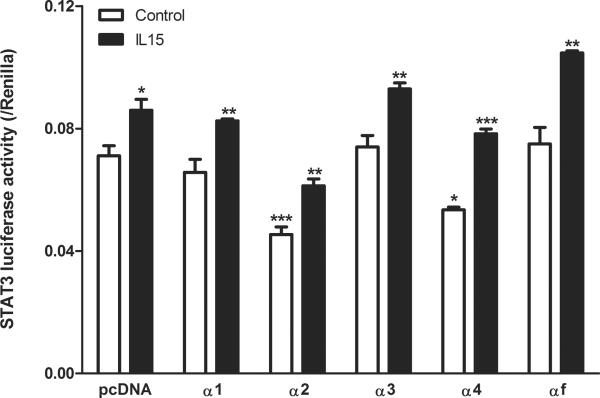
The basal level of STAT3 luciferase activity in the pcDNA tranfected cells was high. In contrast to the pcDNA-transfected control group, overexpression of variant α1, α3, and αf did not affect the basal STAT3 activity in RBE4 cells (Fig.5). However, overexpression of variants α2 and α4 resulted in a significant inhibition of STAT3 activity (p < 0.001 and p < 0.05, respectively). The high basal level indicates that the contribution of endogenous IL15Rα was greater than or comparable to the exogenous levels, or that RBE4 cells have another dominant pathway activating STAT3 that may not involve IL15Rα.
Fig 5.
STAT3 activation in RBE4 cells measured by luciferase reporter assay (n = 4 /group). The basal STAT3 activity was high. It was not affected by variant α1, α3, and αf, but decreased by variants α2 and α4. IL15 (100 ng/ml) for 6 h increased STAT3 activity in all groups. In comparison with the pcDNA control, α2 transfected cells showed a lower level of STAT3 activation whereas αf transfected cells showed a greater increase. Asterisks over the vehicle-treated cells (clear bar) show differences in comparison with the pcDNA group. Asterisks over the IL15-treated cells (solid bar) show differences of the particular isoform with vehicle treated control. *: p < 0.05; **: p < 0.01; ***: p < 0.005.
IL15 treatment at a dose of 100 ng/ml for 6 h induced a significant increase of STAT3 transcriptional activity in all groups. It appeared that the amplitude of increase was greater in cells transfected with α4 and αf isoforms. In comparison with the control group (pcDNA transfection and IL15 treatment), cells overexpressing variant α2 still showed lower STAT3 activity (p < 0.001) upon IL15 stimulation. However, IL15 treatment of RBE4 cells transfected with full length IL15Rα resulted in a significant increase of STAT3 activity (p < 0.001). For all the other variants, IL15 stimulation did not affect the luciferase intensity of STAT3 in comparison with the pcDNA control group after IL15 treatment.
Discussion
In this study, we show that cerebral microvessels of the mouse BBB contain multiple IL15Rα variants. In addition, TNF treatment further increased the mRNA of these variants, indicating reactivity to neuroinflammation. The isoforms showed distinctive subcellular distribution patterns, suggesting their different biological functions. Their trafficking pathways were shown by the presence of some variants in the ER and Golgi apparatus. The change in STAT3 luciferase activity after overexpression of each isoform reflects the summation of endogenous receptors and the recombinant isoform.
We identified five IL15Rα isoforms from murine cerebral microvessels. Besides the full-length IL15Rα, the other four were novel isoforms that never have been reported in any other tissue. All these IL15Rα isoforms contain coding sequences for the signaling peptide (exon 1), the ligand-binding Sushi domain (exon 2), a single transmembrane domain (exon 6), and the cytoplasmic domain (exon 7). Some show the absence or mutation of the extracellular linker (exon 3) and threonine/proline rich domains (exons 4 and 5) that are flanked by the Sushi and transmembrane domains. However, frame shifts result in isoforms without a cytoplasmic domain.
We have recently shown that TNF induces the expression of IL15Rα and the endocytosis of IL15 in RBE4 cells of rat origin (Pan et al., 2009). In addition, TNF has a greater effect on the protein expression of the co-receptors IL2Rβ and IL2Rγ than on IL15Rα itself in mouse cerebral microvessels. In this previous study, IL15Rα mRNA was detected by qPCR with primers and fluorescent probe against the full-length isoform. Although the full length αf remains the most abundant, we show here that mouse cerebral microvessels express several novel isoforms that can all respond to systemic TNF treatment by elevated mRNA expression. This suggests that all IL15Rα variants play pathophysiological roles in response to neuroinflammatory challenges. The mouse model in this study was induced by intraperitoneal injection of TNF at a high dose (4.5 μg/mouse) and long duration (4 h) so that the results are not directly comparable to the previous study involving intravenous injection of TNF. Since the previous study only determined the expression of IL15Rαf by qPCR, it might have underestimated the amplitude of increase which would be a summation of all receptor variants.
To further determine the functional role of the receptor variants, we individually expressed them in RBE4 endothelia cells and determined their protein expression, glycosylation pattern, subcellular location, and STAT3 signaling in response to IL15. It has been shown in COS-7 cells that the full length IL15Rα is associated with the nuclear membrane, while Δ2 IL15Rα is localized within the ER, Golgi and cytoplasmic vesicles (Dubois et al. 1999). Δ4, Δ3,4, and Δ3,4,5 IL15Rα isoforms are predominantly associated with the ER and Golgi apparatus (Bulanova et al. 2003). In our studies, isoform α1 lacks exon 3, 4 and 5, similar to the reported Δ3,4,5 IL15Rα isoform except that one of the leucine residues was depleted from the signal peptide. Isoform α1 was present in the Golgi but not in the ER at the time point studied (24 h after transfection), suggesting its rapid kinetics of synthesis and trafficking. This contrasts with all other isoforms that showed relatively diffuse cytoplasmic distribution, and may reflect the kinetics of the endogenous IL15R α1 that may be related to its low level of mRNA. In HUVEC, both IL15Rα and IL15 can be induced by TNF and interferon γ, and are detectable by flow cytometry, showing cell surface expression (Liu et al. 2009). This is not contradictory to the basal cytoplasmic distribution of IL15Rα after 24 h of transfection in RBE4 cells in this study. It is possible that inflammatory stimulation facilitates the cell surface trafficking of the receptor and enhances reversed and/or autocrine signaling of IL15.
Since the transfection efficiency was low in RBE4 cells shown by overexpression only in 0.5 – 1 % of the cells, the luciferase reporter assay provides the desired sensitivity in detecting cellular signaling. We have shown that transcriptional activation of STAT3 by the luciferase reporter correlates with the increase of pSTAT3 in WB (Zhang et al. 2009). Basal STAT3-luciferase activity reflects cellular activation by the endogenous IL15 system as well as by other cellular signals. We expect different levels of expression of the isoforms, because alternative splicing and frame shift probably affect 3'-UTR and promoter activities. The size of the plasmid also differs slightly among the isoforms and this may affect the level of expression as well. All these factors will contribute to the variability of the efficiency of transfection of the IL15Rα isoforms. By contrast, the expression levels of STAT3-firefly luciferase reporter and the control Renilla reporter are more consistent, enabling them to be indicators of STAT3 activation as a result of the expression of various IL15Rα isoforms.
Even in the pcDNA-transfected cells, IL15 treatment induced a significant increase of STAT3 activity, indicating the presence of functional endogenous IL15 receptors. In the absence of ligand stimulation, we detected a reduction of STAT3 activation after transfection of α2 or α4 isoforms. This indicates that these isoforms might interfere with endogenous IL15Rα signaling in RBE4 cells. It contrasts with the lack of effect of α1, α4, or αf. The reduction of STAT3 by α2 overexpression might be associated with the partial absence of the ligand-binding Sushi domain, thereby serving as a partial antagonist to endogenous IL15. However, α3, which also has only half of the Sushi domain, did not show such effect. The C-terminal domain of IL15Rα encoding the cytoplasmic tail is crucial for signal transduction. A frameshift in isoforms α2, α3, and α4 results in C-terminal domains that are not functional. Thus, it is not clear why α2 and α4 isoforms reduced basal STAT3 activity. Although we used Renilla reference reporter in the co-transfection to normalize the level of expression, it is possible that the variable extent of receptor isoform expression induced a variable cellular response. Nonetheless, all isoforms responded to IL15 with a significant increase of STAT3 luciferase activity, and the most apparent effect was seen for IL15Rαf. Consistent with the highest abundance of αf in enriched cerebral microvessels from normal mice shown by qPCR, this suggests that the full-length αf is the major signaling receptor in endothelial cells.
IL15 treatment has been shown to promote the survival rate of BA/F3 cells overexpressing IL15Rα isoforms (Bulanova et al. 2003), and induce phosphorylation of STAT5, JAK2, and Syk in RBL-2H3 rat mast cells overexpressing IL15Rα isoforms, in particular the Δ4 IL15Rα construct (Bulanova et al. 2003). We used the STAT3-luciferase reporter assay as the main indicator of intracellular signaling activation pertinent to IL15 since WB of other cellular signals are less sensitive in detecting the low level of overexpression of IL15Rα isoforms in RBE4 cells. The use of non-endothelial cells with higher transfection efficiency can overcome this issue, as we have shown in previous studies in which pSTAT3 WB correlates with STAT3-luc activity in HEK293 as well as RBE4 cells (Pan et al. 2007;Zhang et al. 2009). However, the cellular machinery in different cell types may affect the processing and trafficking of IL15Rα isoforms and introduce bias in interpretation of the results. There are also soluble receptors (sIL15Rα), which can be generated either by an alternative splicing mechanism within the IL-15Rα gene or naturally released from IL15Rα positive cells by a shedding process). In the current study, we did not detect soluble isoform mRNA by RT-PCR, but posttranslational cleavage remains a possibility. Notably, there are additional bands besides the predicted protein in the WB of groups of cells overexpressing individual receptor isoforms (Fig.4). It is possible that these are non-specific signals or additional isoforms as a result of complex post-translational regulation of IL15Rα. Overall, IL15Rα isoforms form an intricate network within the cells to regulate the cellular response to IL15. This may have long-term consequences, such as expression of cell adhesion molecules or secretion of chemokines.
In summary, we identified four novel IL15Rα splice variants in mouse cerebral microvessels composing the BBB, and showed their differential distribution and functions in endothelial signaling in response to IL15. The mRNA of both αf and α4 was higher than that of α1 (least abundant), α2, and α3, but all were increased in response to systemic TNF treatment in microvessels. Most isoforms showed vesicular cytoplasmic distribution and their trafficking involved the ER and the Golgi complex. The α2 and α4 isoforms antagonized basal STAT3 activation when transfected into RBE4 cells. Thus, the multiplex regulation of IL15 signaling by different receptor isoforms at the BBB level suggests an important function of the IL15 system at this neurovascular interface.
Supplementary Material
Acknowledgement
Funding support was provided by NIH (NS62291, DK54880, and NS45751). The STAT3-luciferase reporter plasmid was kindly provided by Dr. Charles Rosenblum. (Merck Research Laboratories, Mahway, NJ).
References
- Anderson DM, Kumaki S, Ahdieh M, Bertles J, Tometsko M, Loomis A, Giri J, Copeland NG, Gilbert DJ, Jenkins NA. Functional characterization of the human interleukin-15 receptor alpha chain and close linkage of IL15RA and IL2RA genes. J. Biol. Chem. 1995;270:29862–29869. doi: 10.1074/jbc.270.50.29862. [DOI] [PubMed] [Google Scholar]
- Bulanova E, Budagian V, Orinska Z, Krause H, Paus R, Bulfone-Paus S. Mast cells express novel functional IL-15 receptor alpha isoforms. J. Immunol. 2003;170:5045–5055. doi: 10.4049/jimmunol.170.10.5045. [DOI] [PubMed] [Google Scholar]
- de Totero D, Meazza R, Capaia M, Fabbi M, Azzarone B, Balleari E, Gobbi M, Cutrona G, Ferrarini M, Ferrini S. The opposite effects of IL-15 and IL-21 on CLL B cells correlate with differential activation of the JAK/STAT and ERK1/2 pathways. Blood. 2008;111:517–524. doi: 10.1182/blood-2007-04-087882. [DOI] [PubMed] [Google Scholar]
- Dubois S, Magrangeas F, Lehours P, Raher S, Bernard J, Boisteau O, Leroy S, Minvielle S, Godard A, Jacques Y. Natural splicing of exon 2 of human interleukin-15 receptor alpha-chain mRNA results in a shortened form with a distinct pattern of expression. J. Biol. Chem. 1999;274:26978–26984. doi: 10.1074/jbc.274.38.26978. [DOI] [PubMed] [Google Scholar]
- Johnston JA, Bacon CM, Finbloom DS, Rees RC, Kaplan D, Shibuya K, Ortaldo JR, Gupta S, Chen YQ, Giri JD. Tyrosine phosphorylation and activation of STAT5, STAT3, and Janus kinases by interleukins 2 and 15. Proc. Natl. Acad. Sci. U. S. A. 1995;92:8705–8709. doi: 10.1073/pnas.92.19.8705. [DOI] [PMC free article] [PubMed] [Google Scholar]
- Liu X, Zuo Y, Zhang W, Yang D, Xiong C, Zhang X. Expression of interleukin-15 and its receptor on the surface of stimulated human umbilical vein endothelial cells. J. Huazhong. Univ Sci. Technolog. Med. Sci. 2009;29:527–534. doi: 10.1007/s11596-009-0501-x. [DOI] [PubMed] [Google Scholar]
- Pan W, Hsuchou H, Tu H, Kastin AJ. Developmental changes of leptin receptors in cerebral microvessels: unexpected relation to leptin transport. Endocrinology. 2008;149:877–885. doi: 10.1210/en.2007-0893. [DOI] [PMC free article] [PubMed] [Google Scholar]
- Pan W, Tu H, Hsuchou H, Daniel J, Kastin AJ. Unexpected amplification of leptin-induced Stat3 signaling by urocortin: implications for obesity. J Mol Neurosci. 2007;33:232–238. doi: 10.1007/s12031-007-0071-y. [DOI] [PubMed] [Google Scholar]
- Pan W, Yu C, Hsuhou H, Khan RS, Kastin AJ. Cerebral microvascular IL15 is a novel mediator of TNF action. J. Neurochem. 2009;111:819–827. doi: 10.1111/j.1471-4159.2009.06371.x. [DOI] [PMC free article] [PubMed] [Google Scholar]
- Perkins SJ, Haris PI, Sim RB, Chapman D. A study of the structure of human complement component factor H by Fourier transform infrared spectroscopy and secondary structure averaging methods. Biochemistry. 1988;27:4004–4012. doi: 10.1021/bi00411a017. [DOI] [PubMed] [Google Scholar]
- Rosenblum CI, Tota M, Cully D, Smith T, Collum R, Qureshi S, Hess JF, Phillips MS, Hey PJ, Vongs A, Fong TM, Xu L, Chen HY, Smith RG, Schindler C, Van der Ploeg LH. Functional STAT 1 and 3 signaling by the leptin receptor (OB-R); reduced expression of the rat fatty leptin receptor in transfected cells. Endocrinology. 1996;137:5178–5181. doi: 10.1210/endo.137.11.8895396. [DOI] [PubMed] [Google Scholar]
- Roux F, Couraud PO. Rat brain endothelial cell lines for the study of blood-brain barrier permeability and transport functions. Cell Mol. Neurobiol. 2005;25:41–58. doi: 10.1007/s10571-004-1376-9. [DOI] [PMC free article] [PubMed] [Google Scholar]
- Roux F, Durieu-Trautmann O, Chaverot N, Claire M, Mailly P, Bourre JM, Strosberg AD, Couraud PO. Regulation of gamma-glutamyl transpeptidase and alkaline phosphatase activities in immortalized rat brain microvessel endothelial cells. J. Cell Physiol. 1994;159:101–113. doi: 10.1002/jcp.1041590114. [DOI] [PubMed] [Google Scholar]
- Yu C, Kastin AJ, Ding Y, Pan W. Gamma glutamyl transpeptidase is a dynamic indicator of endothelial response to stroke. Exp. Neurol. 2007a;203:116–122. doi: 10.1016/j.expneurol.2006.07.023. [DOI] [PubMed] [Google Scholar]
- Yu C, Kastin AJ, Pan W. TNF reduces LIF endocytosis despite increasing NFkappaB-mediated gp130 expression. J Cell Physiol. 2007b;213:161–166. doi: 10.1002/jcp.21105. [DOI] [PubMed] [Google Scholar]
- Zhang Y, Wu X, He Y, Kastin AJ, Hsuchou H, Rosenblum CI, Pan W. Melanocortin potentiates leptin-induced STAT3 signaling via MAPK pathway. J. Neurochem. 2009;110:390–399. doi: 10.1111/j.1471-4159.2009.06144.x. [DOI] [PMC free article] [PubMed] [Google Scholar]
Associated Data
This section collects any data citations, data availability statements, or supplementary materials included in this article.


