Abstract
Electronic excitations and the optical properties of the photosynthetic complex PSI are analyzed using an effective exciton model developed by Vaitekonis et al. [Photosynth. Res. 2005, 86, 185]. States of the reaction center, the linker states, the highly delocalized antenna states and the red states are identified and assigned in absorption and circular dichroism spectra by taking into account the spectral distribution of density of exciton states, exciton delocalization length, and participation ratio in the reaction center. Signatures of exciton cooperative dynamics in nonchiral and chirality-induced two-dimensional (2D) photon-echo signals are identified. Nonchiral signals show resonances associated with the red, the reaction center, and the bulk antenna states as well as transport between them. Spectrally overlapping contributions of the linker and the delocalized antenna states are clearly resolved in the chirality-induced signals. Strong correlations are observed between the delocalized antenna states, the linker states, and the RC states. The active space of the complex covering the RC, the linker, and the delocalized antenna states is common to PSI complexes in bacteria and plants.
I. Introduction
Absorption and funneling of solar energy by photoactive molecules (pigments) are the primary events in the photosynthesis of higher plants and photosynthetic bacteria. Microscopic understanding of these processes and how they may be tuned may be used to engineer artificial solar cells which mimic the high efficiency of natural organisms. The photosystem I photosynthetic complex (PSI) is the pigment–protein apparatus in bacteria and plants that converts the photon into electrical energy.1 It exists in trimeric and monomeric forms, but the trimeric species have the same optical properties as monomers: in both the absorbed light at room temperature has >95% probability to induce charge separation.2 This suggests that energy exchange between monomers is negligible and a single monomer can be used to model the optical signals.
The recently reported 2.5 Å resolution structure of a cyanobacteria Thermosynechococcus elongatus monomer3 revealed 96 bacteriochlorophylls (BChl’s), and 22 carotenoids embedded in a protein frame. DFT (PW91/6-31G(d)) calculations have subsequently been used to refine the structure.4 It consists of a nonsymmetric 90 antenna BChl pigment array surrounding a central six BChl core, which was identified as the reaction center, where charge separation takes place. The structure of the PSI monomer (see Figure 1a) is optimized for efficient energy conversion, as demonstrated by experiments and supported by numerical simulations.5,6
Figure 1.
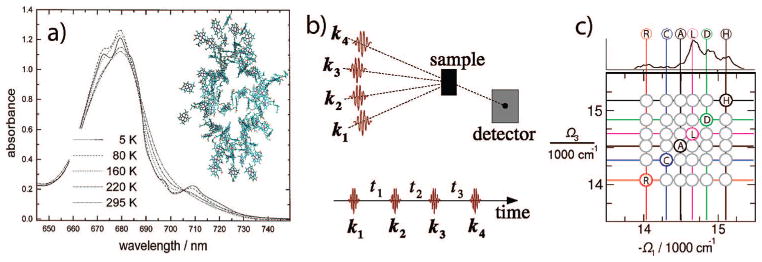
(a) Spatial distribution of the 96 BChl’s in photosynthetic complex PSI and its absorption spectrum at various temperatures (taken from ref 24). (b) pulse configuration of the four-pulse experiment. (c) Schematic diagonal and cross-peak pattern expected for the PSI.
The room temperature PSI absorption spectrum (Figure 1a) consists of a broad main antenna 14 300–15 500 cm−1 (700–645 nm) absorption band and a red shoulder below 14 000 cm−1 (715 mn).1 The lowest-energy band of the reaction center is at ~ 14 300 cm−1 (700 nm).
The “red” absorption band which extends below the RC absorption is a unique feature of the PSI complex. PSI complexes from different species have a very similar main absorption band and mostly differ in the red (>700 nm) absorption region. Trimerization slightly increases the relative red absorption strength.1 Low temperature hole-burning spectra indicate that three red states are responsible for peaks at 710, 714, and 719 nm.7,8 Bands 714 and 719 are similar for two species (Synechocystis PCC 6803 and Thermosynechococcus).8 Hole-burning studies of the red states7 further revealed large permanent dipole moment and large linear pressure shift indicating strong electron–phonon coupling. These characteristic features of charge transfer (CT) states9 were attributed to electron exchange of dimeric BChl’s for both Synechococcus and Synechocystis. This assignment is also supported by the Stokes shift and fluorescence lineshapes of the red BChl’s.10
The main function of the peripheral chromophores is funneling of energy to the reaction center (RC). This process has been probed by ultrafast optical spectroscopy.11,12 Selective excitation of the various antenna BChl’s has been used to determine the energy conversion yield. At room temperature all absorbed light, even at the long-wavelength (750 nm) edge, has roughly the same capture probability by the RC;13 energy transport is equally efficient from the various pools of BChl’s.14 The ultrafast exciton dynamics at room temperature in several PSI complexes has been separated into exciton hopping (130–180 fs) and equilibration in bulk antenna (300 fs–1 ps) regimes.1,15,16 The equilibration with the red chromophores (5–10 ps) and trapping by the reaction center (23–50 ps) is slower. Time-resolved experiments show that the equilibration time between the main antenna chromophores and red chromophores is 2.3 ps, while the trapping time in the RC is 24 ps.14,17 Subsequent numerical simulations of the energy transport in cyanobacteria based on experimentally determined microscopic structure and spectral density of bath fluctuations suggest a three-step trapping process:18,19 delivery of the excitation to the RC (12 ps), redistribution within the reaction center (6 ps), and final trapping (11 ps). It was suggested that the energy is transported from the peripheral antenna to the RC via two “linker” chromophores. Faster (2 ps) energy transfer/trapping dynamics of energy capture by the reaction center has been reported in other PSI complexes, and subsequent charge separation again proceeds in several steps within 1–100 ps.15,20
Since different species differ mainly by the red chromophores, the same model may be used for the bulk antenna of different species.21 The differences in red BChl’s lead to slight variations in sub-10 ps exciton dynamics.22 Femtosecond 77 K transient-absorption and photobleaching studies revealed strong excitonic interactions around 690–710 nm.23 The reaction center, at 700 nm, is thus energetically well positioned to capture the excitons. Exciton dynamics shows both coherent and incoherent components which reflect the interplay of localized and delocalized excitons.24 One- and two-color photon echo peak-shift (3PEPS) measurements performed by Vaswani et al. indicated strong excitonic couplings between pigments absorbing at different energies, while the red chromophores show fast decay of the 3PEPS signal due to strong coupling with the protein.25
The primary ingredients for the simulation of optical spectra are the BChl transition energies and intermolecular interactions.26 The energy of each pigment has been obtained for the simpler Fenna–Matthews–Olson complex26,27 using an exciton model which takes into account protein–chromophore interactions. Electrochromic shifts of PSI absorption suggest that the local dielectric constant due to the protein varies between 3 and 20.28 This strongly affects the site transition energies and transition dipole orientations. Simple lattice models with few parameters have been used to reproduce features of absorption and exciton dynamics.29 Microscopic exciton dynamics simulations for PSI were carried out right after high-resolution structural information became available.6,24,26,30 An effective Frenkel exciton Hamiltonian has been constructed using semiempirical INDO/S electronic structure calculations combined with the experimental structure.19,30 Förster theory showed an energy transport network where most of the BChl’s are connected to at least four neighbors with rates >0.3 ps−1, resembling a two-dimensional square lattice. Efficient numerical optimization algorithms have also been applied to search for the transition energy and dipole orientation of each BChl.9,31 The resulting parameters provide a good fit to experimental absorption, circular dichroism (CD), and time-resolved fluorescence spectra.
Coherent multidimensional spectroscopic techniques provide a qualitatively higher level of information on excitonic complexes.32–35 The signals (Figure 1b) are recorded vs three time delays between 4 fs pulses. Two-dimensional (2D) signals first developed in NMR36 have been extended to the femtosecond optical regime:37,38 first the infrared39–42 and recently to the visible regime.43,44 Two-dimensional signals can distinguish between homogeneous and inhomogeneous line shapes,37 coherent45 vs incoherent exciton transport,44 and vibrational dynamics.46
General principles for the design of multidimensional probes of coherent and dissipative dynamics by controlling pulse polarizations were developed and applied to photosynthetic complexes.47,48 In this paper we employ these strategies to study exciton dynamics in various regions of the PSI complex from the RC in the middle of the structure through surrounding bulk antenna to the “red” BChl’s in the complex periphery. Well-resolved cross-peaks predicted between the RC and its “linker states” reveal the active region common to PSI complexes of other species. Chirality-induced (CI) two-dimensional signals are used to probe exciton delocalization and relaxation with enhanced resolution.49
II. Model and Simulations
Our simulations are based on the exciton model:12,33,50,51
| (1) |
where each BChl is considered as a two-level chromophore. are exciton creation (annihilation) operators representing hard-core bosons with commutation . The resonant J coupling is responsible for exciton delocalization. The system is coupled to a harmonic phonon bath described by the Hamiltonian
| (2) |
The bath induces fluctuations of molecular transition energies through the coupling:
| (3) |
We assume a dipole coupling with the laser fields.
| (4) |
where
| (5) |
is the polarization operator, Rn is the coordinate of the nth chromophore, and μn is its transition dipole. The total Hamiltonian is given by
| (6) |
The parameters for the PSI complex were obtained as follows. The molecular excitation energies En and J-coupling were taken from ref 9. These parameters and the transition dipole orientation of each chromophore have been fitted to absorption and CD spectra using an evolutionary optimization algorithm. Coordinates of transition dipoles, Rn, were taken at a center of mass of CA, CB, CC, and CD atoms of each BChl; the nomenclature and atom coordinates are used from ref 3.
Bath coordinates coupled to different chromophores were introduced in refs 19 and 31 to reproduce the experimentally determined spectral densities. We assumed the following bath spectral density for the nth chromophore:
| (7) |
The first overdamped Brownian oscillator mode with coupling strength λ = 16 cm−1 and relaxation rate Λ = 32 cm−1 controls the homogeneous line width of the spectra. The remaining, Ohmic, part of the spectral density was taken from ref 31. It determines the population transport rates and was tuned by fitting the time-resolved fluorescence. The Ohmic frequencies [in cm−1] are Ω1 = 10.5, Ω2 = 25, Ω3 = 50, Ω4 = 120, and Ω5 = 350; for the red chromophores we set η1,r = 0.0792, η2,r = 0.0792, η3,r = 0.24, η4,r = 1.2, and η5,r = 0.096; for the remaining chromophores ηj,n≠r = 0.024 for all j. The red chromophores are A2, A3, A4, A19, A20, A21, A31, A32, A38, A39, B6, B7, B11, B31, B32, and B33.3 The exciton dephasing rates and the population transport rates were calculated by using the full spectral density (eq 7) in the Markovian approximation. Un-correlated static diagonal Gaussian fluctuations of all BChl transition energies with 90 cm−1 variance were added by statistical sampling to account for the inhomogeneous spectral line width.
The simulation techniques of excitons have been reviewed recently in ref 33. Expressions of the linear absorption and CD signals are given in the Appendix; the 2D signals were simulated using the quasiparticle representation as summarized in the Appendix.
III. Classification of Single-Exciton States: Absorption and CD Spectroscopies
The exciton state energies εe and wave functions ψne are obtained by diagonalizing single-exciton block of the Hamiltonian matrix: . For clarity, in the following analysis we neglected the static diagonal fluctuations. These will be added in actual simulations of signals.
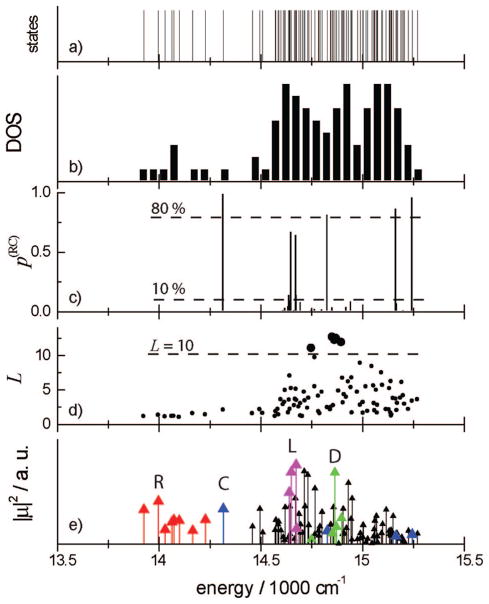
Panel a in Figure 2 shows all single-exciton state energies spanning from 13 800 to 15 300 cm−1. We label them by their energy. The density of states is shown in panel b. As found in previous simulations,9,19,30,31 we see two regions: the bulk antenna region (>14 500 cm−1) with a high density of states and the sparse red state (<14 300 cm−1) region. The antenna region has some structure with three high density features around 14 200, 14 800, and 15 200 cm−1.
Figure 2.
Various characteristic measures of single-exciton states: (a) energies, (b) density of states (DOS) (each bar covers a 50 cm−1 region), (c) probability of exciton participation in the RC p(RC) (eq 8), (d) exciton participation ratio L (eq 9), and (e) oscillator strength.
The single-exciton wave function coefficients ψne denote how the eigenstate e projects into the nth chromophore. The single-exciton states can be classified according to their participation in certain structural patterns. The reaction center is made of chromophores S1–S6 (indices 1–6 in our labeling9), while the sequence A1–A40, B1–B39, J1–J3, K1, K2, L1–L3, M1, X1, and P1 (indices 7–96) constitute the bulk antenna (this nomenclature is taken from ref 3). The red chromophores are scattered over the periphery. The probability of exciton state e to be found in the reaction center
| (8) |
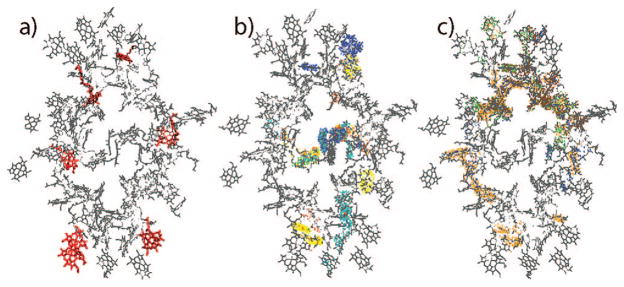
is shown in Figure 2c for various excitons. We find eight states with (two are close to 10%). Four of them (9, 45, 87, 95) are mostly localized on the RC with . these states will be denoted as the reaction center states. The other four states (22, 25, 28, and 29) with are delocalized across the RC and the antenna, and will be labeled as the linker states. We expect them to be responsible for exciton delivery to the RC. The linker states have energies close to the lower energy edge of the bulk antenna band (14 600–14 700 cm−1). Probability distributions of these RC-related states across the complex shown in Figure 3a reveal that the linker states extend from the RC to the periphery of the antenna. In Figure 4 we show this distribution in real space together with the chromophore structure. The red states are mostly localized on a few chromophores scattered throughout the PSI; the RC and linker states cover the reaction center and show long tails extending to the edges of the antenna.
Figure 3.
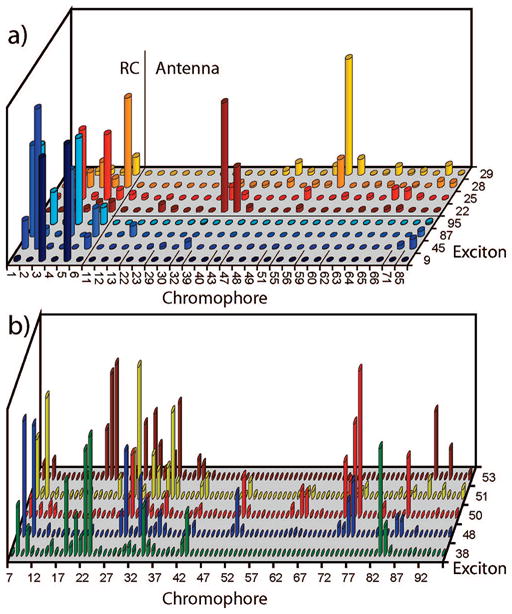
(a) Exciton probability distribution, |ψne|2, for excitons with >10% projection on the RC. 9, 45, 87, 95 are RC states with p(RC) > 0.8; 22, 25, 28, 28 are linker states with 0.1 < p(RC) < 0.8. Only contributing cromophores are shown. (b) States with delocalization length L > 10. All antenna chromophores are shown. RC chromphores are excluded.
Figure 4.
Exciton probability distribution of groups of exciton states shown in real space (density of dots represents |ψne|2). (a) Red states, (b) RC and linker states, and (c) delocalized antenna states.
The exciton participation ratio
| (9) |
which measures the delocalization length of the exciton states, is displayed in Figure 2d. The most delocalized antenna states, 38, 48, 50, 51, and 53, with L > 10 are highlighted. These states cover almost all antenna chromophores as shown by their probability distribution across the complex in Figure 3b. Figure 4 shows that the delocalized antenna states completely surround the RC and overlap with the tails of the linker states.
In Figure 2e we display the oscillator strength |μe|2 (μ is the exciton transition dipole) for all exciton states. We identify the red absorption (below the lowest-energy RC state) with transition energies of <14 250 cm−1 (red color). The RC states are marked in blue. The lowest-energy RC state is spectrally isolated. The linker states (pink) have a strong transition amplitude at 14 700 cm−1. The delocalized antenna states are marked in green. One such state at around 14 850 cm−1 has a strong transition amplitude. The remaining states (black) make up the bulk antenna and span the 14 500–15 200 cm−1 region.
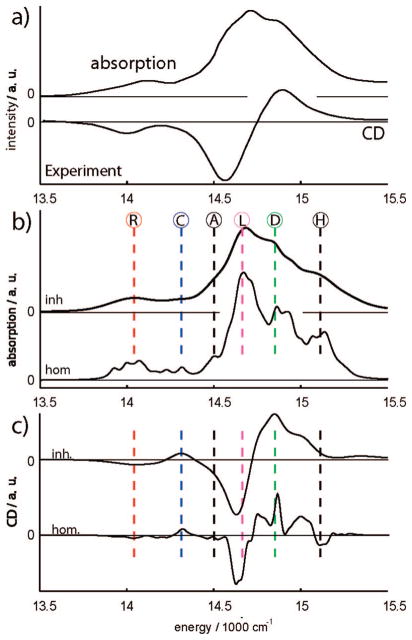
Hereafter all simulations of spectroscopic signals will include the statistical averaging over static diagonal fluctuations. The absorption shown in Figure 5b can be clearly separated into the antenna region between 14 500 and 15 300 cm−1 and the red absorption region 13 700–14 300 cm−1. The absorption is inhomogeneously broadened with a limited structure. The six main peaks are marked by vertical lines. For better peak assignment we also show the homogeneous spectra calculated without inhomogeneous broadening and using a constant small homogeneous 30 cm−1 line width.
Figure 5.
(a) Experimental absorption (80 K) and CD (77 K) spectra of the PSI complex adapted from ref 24. The spectra have been converted from the wavelength to the energy scale using κω ∝ λ2κλ. (b) Absorption of the PSI complex; “inh” denotes full simulations averaged over 1000 diagonal disorder configurations, “hom” is homogeneous model. R, red excitons; C, RC peak; A, bulk antenna lower edge; L, linker states; D, delocalized states over most of the antenna; H, bulk antenna higher edge. (c) Same simulations but for the circular dichroism (CD) spectrum.
The full and the homogeneous CD spectra shown in Figure 5c consist of two negative low-energy peaks at 14 000 and 14 600 cm−1 and a strong positive peak at 14 830 cm−1. The negative peak at 14 000 cm−1 comes from red excitons. The slightly positive feature at 14 300 cm−1 corresponds to the RC. The strong negative peak at 14 620 cm−1 may be identified with the linker states. The remaining positive featues represent the antenna region: the strongest positive peak at 14 840 cm−1 matches the energy of the delocalized antenna states. The fine structure of the positive peak in the homogeneous signal between 14 700 and 15 200 cm−1 is related to the bulk antenna.
In summary, the linear spectra show six types of transitions: the red states (R) at 14 000 cm−1; the RC transition (C) at 14 300 cm−1; the linker transitions (L) at 14 670 cm−1; the delocalized antenna region (D) at 14 850 cm−1. The bulk antenna starts at 14 500 cm−1, which is the low-energy edge (A), up to the upper-energy edge (H) of the bulk antenna at 15 110 cm−1 and covers A, L, D, and H features. The R, C, L, D, and H states can be identified in the absorption. The peak resolution in CD is improved.
IV. Coherent 2D Photon Echo Signals in the Dipole Approximation
Multidimensional signals show exciton correlations as cross-peaks in 2D correlation plots. Their pattern and time evolution reveal exciton coherences and relaxation. In the following we focus on the elementary tensor components of the 2D signals, as well as possible superpositions.47
For weakly coupled two-level chromophores, the cross-peaks appear at the crossing points of the vertical and horizontal lines passing through the various diagonal peaks. This creates a pattern of possible peaks which could be mapped into the spectra. In Figure 1c we schematically display the 2D (−Ω1,Ω3) region: on the diagonal line, −Ω1 = Ω3, from (13 500,13 500) cm−1 to (15 500,15 500) cm−1 we mark the anticipated positions of the diagonal peaks corresponding to R C A L D H regions. The possible cross-peaks are marked. Comparing this pattern with the 2D spectra will help in assigning the underlying transitions.
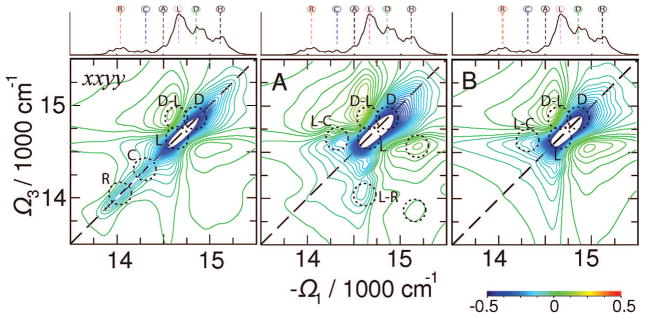
In Figure 6 we display a 2D signal at t2 = 0. Its primary diagonally elongated feature originates from single-exciton contributions (bleaching and stimulated emission) associated with R, C, and overlapping L and D states as marked by dotted circles. Some weak broad off-diagonal features extending from the diagonal can be observed. The diagonal line mimics the absorption. The R peak is well-separated from the rest, whereas other diagonal transitions strongly overlap. The C diagonal peak can be identified as an extended shoulder of the antenna band. The strongest peak corresponds to the L region. Off-diagonal regions around the bulk antenna bands are featureless.
Figure 6.
Left: xxyy tensor component of the 2D signal . Middle: signal A(Ω3,t2= 1 fs,Ω1). Right: signal B(Ω3,t2= 0,Ω1). Absorptive (Im) parts of the signals are shown. The 2D plots are normalized to their maximum. All signals have been averaged over 500 diagonal disorder configurations. Top marginal: the homogeneous absorption spectrum.
We have constructed three types of combinations of polarization configurations that help disentangle the 2D signals.47 We denote them , and , as described in the Appendix. By design A highlights primary dynamic events, B focuses on contributions from single-exciton density matrix coherences, and C shows population transfer. These will be reported below.
The A signal vanishes at t2 = 0. At short delay (t2 = 1 fs in simulations) it gives the zero-time derivative of the signal. It shows mainly two overlapping diagonal peaks, which can be identified with the L and D features. A set of cross-peaks are observed: D–L, L–C are well-resolved, while others may be related to H–L, H–R. Diagonal features of the red states and of the reaction center are very weak. Spectral features of this signal indicate ultrafast exciton dynamics within the bulk antenna and demonstrate that the delocalized states are very active at short times. The H–L cross-peak indicates that L states capture excitons from H and deliver them into the reaction center. Strong L–C features on both sides of the diagonal show that the excitons reach the RC at very short times. The red states also capture excitons from the L states.
The signal B at t2 = 0 as shown in Figure 6 (and similarly at t2 = 50 fs in Figure 8) reveals mostly the bulk antenna region and by design eliminates the exciton populations. The pattern has a very strong diagonally elongated peak which covers L and D states. Weaker C–L cross-peaks indicate strong correlation with the reaction center. These features show that strong excitonic correlations are mostly within the linker and the delocalized antenna states and extend to the RC.
Figure 8.
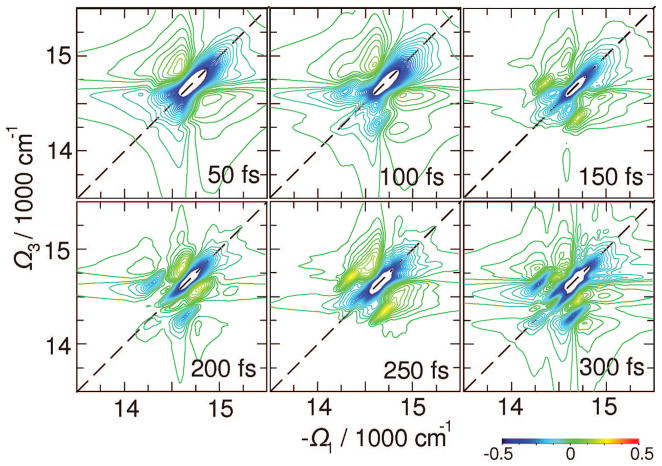
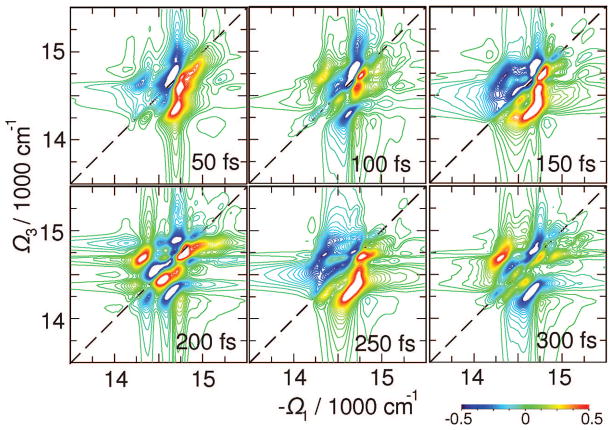
Same as Figure 7 but for B(Ω3,t2,Ω1) signal which targets exciton coherence dynamics.
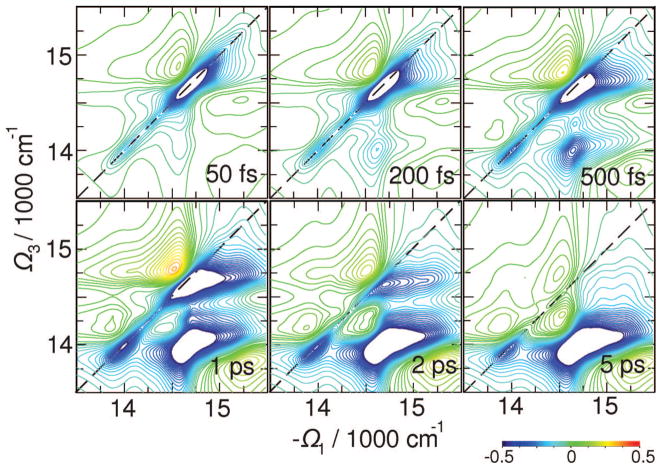
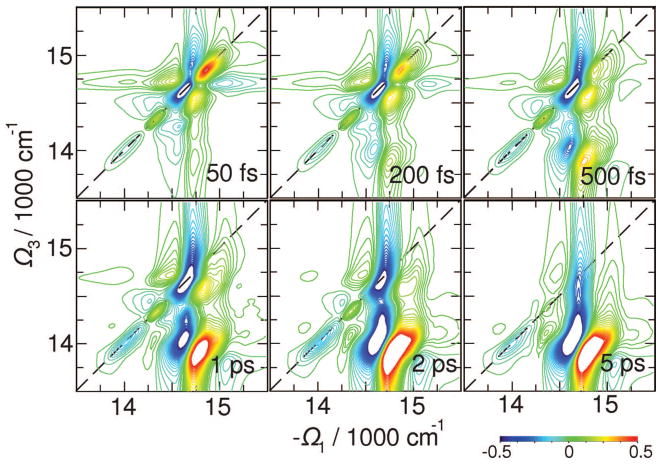
The signals in Figure 6 contribute to very short t2 delays right after the excitation. The complete t2 evolution of the elementary tensor component xxyy is depicted in Figure 7. Exciton equilibration in the bulk antenna region within 1 ps is seen as a change of the 2D pattern around (Ω3,−Ω1) = (14 750,14 750) cm−1. The population is subsequently trapped by the red states within 5 ps. This signal shows an extended cross-peak line shape at Ω3 = 14 000 cm−1, close to the red-state exciton energy. This feature has no fine structure; multiple energy transport pathways may not be clearly deduced from this signal alone.
Figure 7.
Variation of the absorptive (Im) parts of 2D signal with t2 as indicated. The 2D plots are normalized to their maximum. Signals are averaged over 500 diagonal disorder configurations.
The xxyy signal is not sensitive to the evolution of density matrix coherences. These reflect short-time coherent dynamics before phase information is lost. Their evolution can be monitored by the B(Ω3,t2,Ω1) signal shown in Figure 8 which reveals peak dynamics in the bulk antenna region. The cross-peaks show extended L and D exciton regions before 50 fs. Subsequent evolution with t2 shows dynamics of various cross-peaks, including well-resolved L–C and D–L. Underdamped 100–200 fs period oscillations cause peak sign alternations. Since this signal probes exciton coherences, it naturally decays with the coherence decay time scale: its amplitude drops by a factor of 10 between 0 and ~150 fs, and by a factor of 100 at 300 fs. The red states do not contribute to this signal, whereas the RC shows strong cross-peaks through the linker states.
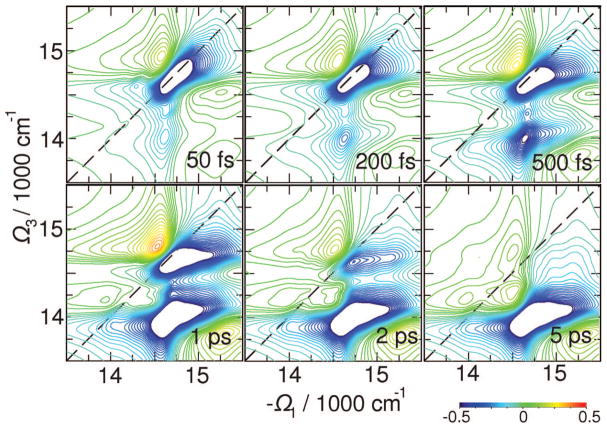
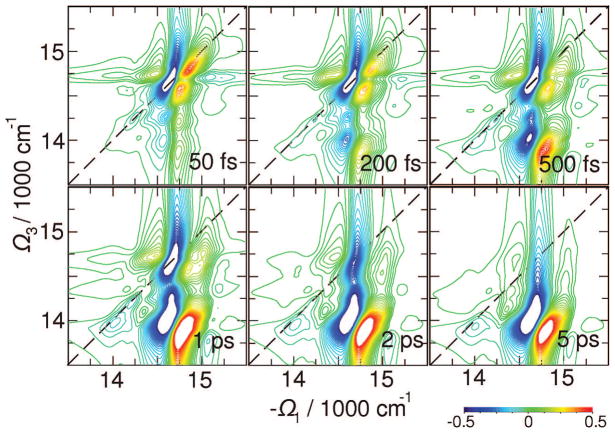
Signals C presented in Figure 9 for t2 between 0 and 5 ps reveal energy transport pathways. This signal shows excitation with the −Ω1 frequency and detection at Ω3. The cross-peak thus reflects the extent of bath-induced energy transport during the delay time t2 after B vanishes (t2 ~ 300 fs in PSI as obtained from B signals).
Figure 9.
Same as Figure 7 but for C(Ω3,t2,Ω1) signal which targets energy transport with t2.
Three relaxation regimes can be identified: (i) relaxation within the bulk antenna including the L (but not the red) states; (ii) equilibration of the antenna and RC through the L states; (iii) exciton trapping by the red states. By following the 2D region below the diagonal at energies > 14 500 cm−1 (cross-peaks between A, L, D, H diagonal peaks), we find a 500 fs equlibration time. At the same time additional cross-peaks grow up at L–C crossing due to process ii. The broad cross-peak along Ω1, which develops at Ω3 < 14 300 cm−1, corresponds to R–L crossing within t2 = 5 ps (process iii). The entire equilibrations process with the red states extends to much longer than ~50 ps time; however, it does not change the 2D signal significantly. The transport-induced peaks are now slightly better resolved than in the xxyy signal (Figure 7).
V. Chirality-Induced Coherent 2D Photon Echo Signals
Signals induced by structural chirality are highly sensitive to the arrangement of chromophores.49 For instance, a dimer of two-level systems will show two diagonal peaks and two cross-peaks whose sign is related to the screw type of dipole vector geometry. Exciton delocalization is visualized by cross-peak amplitudes. In more complicated systems the degree of chirality (length of screw of delocalized exciton) is reflected in the relative peak intensities. Localized excitons are not chiral in our simulations, which use the dipole approximation for each chromophore and thus do not appear in these signals. A higher level Hamiltonian that includes electronic quadrupoles and magnetic dipoles will be required to model the intrinsic chirality of chromophores.
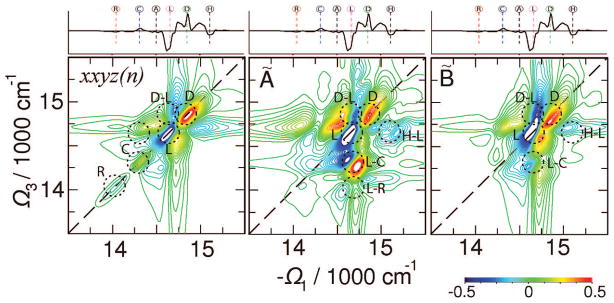
The elementary CI tensor component xxyz(n) (for this notation see the Appendix) of the 2D signal shown in the left panel of Figure 10 shows well-resolved R, C, L, and D states. Strong cross-peaks between these states can be easily identified. Most significant are the D antenna states, which overlap with the L states in all nonchiral signals. Strong signatures of D states show that these excitons cover highly chiral structures with a different sense of chirality than states L.
Figure 10.
Chirality-induced (CI) signals. Left, ; middle, Ã(Ω3,t2= 1 fs,Ω1); right, B̃(Ω3,t2= 0,Ω1). Absorptive (Re) parts of the signals are shown. The 2D plots are normalized to their maximum. Signals are averaged over 1000 diagonal disorder configurations. The top marginal is the homogeneous CD spectrum.
The CI signal à at t2 = 1 fs shows a nonsymmetric peak pattern. It demonstrates that most significant ultrafast dynamic events happen at the region of delocalized antenna states and the linker states. The excitons are redistributed within the bulk antenna and captured by the linker states and the RC, as demonstrated by strong cross-peaks related to the RC peak. This signal complements the nonchiral (NC) A signal by revealing additional excitonic transitions. Many cross-peaks can be identified with various exciton resonances, as marked. The CI signal B̃ at t2 = 0 confirms that coherences are important in the antenna region of L and D states. However, the H and A states of the bulk antenna also show significant cross-peaks; these states are better revealed in this signal, implying that A and H correspond to chiral regions of delocalized excitons with small transition dipoles. These states are promoted in this signal by chirality and other strong exciton transitions.
The time evolution of the xxyz(n) chiral signal displayed in Figure 11 shows a rich cross-peak pattern. The underlying correlated dynamics may be nailed down. In contrast to NC signals, the multiple cross-peaks with alternating signs may be associated with the red states at long t2 delays. It thus shows exciton transport pathways originating from different initial exciton states. These will be studied below by the C̃ signal.
Figure 11.
Variation of the absorptive (Re) parts of the CI 2D signal with t2. Absorptive (Re) parts of the signals are shown. The 2D plots are normalized to their maximum. Signals are averaged over 1000 diagonal disorder configurations.
The time evolution of B̃ shown in Figure 12 reveals many cross-peaks with very high resolution reflecting density matrix coherences associated with chiral regions. The peaks associated with various exciton states rise and fall at various delay times, and show how exciton coherences evolve mostly in the bulk antenna region: The alternate signs of A, L, D, and H states greatly improve resolution compared to the NC signals.
Figure 12.
Same as Figure 11 but for CI B̃(Ω3,t2,Ω1) signal.
Time evolution of the 2D CI signal C̃ in Figure 13 confirms the exciton dynamics pathways as shown by the NC counterpart; however, it shows four cross-peaks associated with the red states at long t2. Note that the red states themselves do not show up in the B̃ signal, indicating that these states are quite localized (this is confirmed by examining their localization lengths in Figure 2). The strong cross-peaks associated with the red states in the C̃ signal indicate the chiral configuration of the exciton transport pathways.
Figure 13.
Same as Figure 11 but for CI C̃(Ω3,t2,Ω1) signal.
VI. Discussion
Exciton properties in the PSI complex have been extensively simulated earlier.6,9,19,24,26,29–31,52 Transport pathways were suggested based on exciton transport rates computed using Förster theory. Our 2D signals show these pathways by correlating the excitation with the emission energy. They reveal energy transport and its equilibration time scales from the bulk antenna to the RC and the red states.
We have computed impulsive signals induced by broad-band laser pulses, which cover the entire exciton band. The quasi-particle scattering approach used for simulations of the response functions has made simulations for this large-size (~100 chromophores) complex with the explicit ensemble averaging possible. The quasiparticle approach treats the double-exciton resonances through the scattering of single-exciton pairs. For an isolated excitonic system it is equivalent to the conventional sum-over-eigenstates approach. Since only single-exciton dephasings enter the signal expressions, the homogeneous line widths of double-exciton-related resonances are estimated approximately. The scattering matrix Γe4e3e2e1 (as well as population transport rates and exciton dephasing rates) has been recalculated for each snapshot of the static disorder. In the scattering matrix we have included only exciton pairs with the overlap amplitude
| (10) |
using ξe4e3 > 0.4 and ξe2e1 > 0.4 cutoffs. All other elements of the scattering matrix have been neglected. This cutoff has been tested empirically to provide good convergence, and it eliminates many noncontributing summations over weakly scattering excitons. All exciton states have been included in the calculation of exciton population transport. The number of diagonal disorder configurations (500 for NC and 1000 for CI signals) has been tested for convergence of the 2D NC xxyy and CI xxyz(n) signals: visually they do not change. The error of the CD spectrum is ~5%. Some caution should be taken for signals A, B, and C since they are more sensitive to the disorder. The simulations were performed on the computer cluster using 100 AMD Opteron 1.8 GHz processing cores. Pure computing time was around 1 month.
Charge separation processes in the RC were not included in our simulations. Including charge transfer (CT) and charge pair (CP) states is a major computational challenge since protein reorganization energies for these states are significant and must be calculated accurately. However, experiments show that charge separation takes several picoseconds. Our simulations target cooperative excitonic responses at shorter t2 time delay where the charge separation contribution is negligible. Simulations including the charge separation will be reported in the future.
The cooperative response of delocalized excitons is monitored by signals which target density matrix coherences. Type B signals eliminate population contributions. For two-level noninteracting chromophores the B signal vanishes since localized excitons of two-level molecules do not show correlated coherences. B therefore shows molecular couplings and correlations. These are most notable in the bulk antenna region where excitons are highly delocalized. Distinct cross-peaks with the reaction center are observed in signal B as well. Since the red states weakly contribute, we confirm that they are localized.
Type C signals enhance the exciton transfer contributions and filter out population-conserving contributions. In the absence of transport, C signals shall decay in the same time scale of B since the population-conserving density matrix pathways do not contribute. At short delays, type C signals include density matrix coherences from the induced absorption. Due to response function symmetry the B and C signals coincide at t2 = 0. Since no population transfer occurred yet, both B and C cancel all population pathways, and in addition, according to C, they cancel coherences of stimulated emission. Therefore only contributions of coherences generated in the induced absorption appear in both type B and C signals at t2 = 0. According to Figures 6 and 10 these are most notable in the antenna region. For longer t2 the coherence contributions decay within 300 fs and only population transfer pathways are seen in type C signals.
The NC signals in Figure 6 and their CI counterparts in Figure 10 show unique signatures of excitons. While xxyy clearly reveal the homogeneous vs inhomogeneous line widths and exciton transition amplitudes, the A signal is related to primary exciton dynamics: the stronger the peak in A, the faster the early dynamics associated with that exciton state. The B (and C) signal at t2 = 0 shows delocalized excitons, i.e., cooperative exciton properties.
Our simulations indicate that the reaction center is clearly visible in the coherent signals and is not masked by the bulk antenna contributions. The RC excitons are not the mostly delocalized excitons in PSI; the participation ratio of all single-exciton states in the homogeneous model shows some excitons delocalized over as much as 10 antenna chromophores (see Figures 2 and 3). The predicted RC-related cross-peaks demonstrate high degree of organization of the PSI complex: while the RC is spatially separated from the antenna, the linker exciton states participating in the RC penetrate the outer antenna, making exciton transport to the antenna very robust. This provides RC signatures in 2D signals. Recent refinement of the structure and exciton model parameters using DFT optimized structure4,53 provided improved estimates of the excitonic interactions within the reaction center: this appears to be a pair of strongly coupled dimers, instead of previous representation of a special pair.54 Using the optimized structure, the excitonic effects may be even more enhanced and thus RC signatures in B type signals may become even stronger.
Linker chromophores have been proposed as connectors between the peripheral antenna and the RC.19 Our study shows that excitons in the antenna are highly delocalized. We thus introduce delocalized linker exciton states which overlap spatially with both the RC and the bulk antenna. They are spectrally close (<200 cm−1) to the highly delocalized antenna states and therefore connect the delocalized antenna states to the RC. Signatures of these states in the cross-peak regions are predicted to be mostly visible in type B signals, which aim at density matrix coherences. There are no RC signatures or cross-peaks in the red region. The red states are thus neither spatially nor spectrally linked directly to the RC. Transport between the red states and the RC may therefore proceed through the bulk antenna and the linker states.
This structural organization is consistent with the concept of PSI complex optimization. Sener et al. have examined various scenarios of perturbed microscopic structure3 of the antenna and estimated the energy trapping time scale and yield.6 At room temperature fluctuations of site energies and chromophore “pruning” have only a minor effect, implying robustness of the complex. It is remarkable that the core of the PSI structure of plants is very similar to that of cyanobacteria.55–58 Almost complete conservation of ~80 BChl orientations was found; the complex also shows similar energy transport pathways.52 The outer region of the plant and the cyanobacterial PSI are different: the plant PSI is monomeric and is in contact with LHCI (subset of LHCA complexes) antenna containing approximately 66 BChl’s. These would not show any direct coherent features (B signal cross-peaks) associated with the RC. Due to the large number of BChl’s in PSI + LHCI in plants, exciton trapping is limited by diffusion time, as shown by time-resolved fluorescence.59 Similar PSI + LHCI organization was also observed in the red alga Cyanidium caldarium, where similarities to both cyanobacteria and higher plants have been revealed.60 The number of peripheral LHCA complexes surrounding the PSI depends on illumination during the cell cultivation. This supports the conjecture that the PSI + LHCI structure is self-adapting and well-organized to function in a broad range of environments. Our studies imply that the spatial region relevant for antenna–RC function is limited by the extent of the linker and the delocalized antenna states: the exciton must be transported from outer regions of the antenna into the delocalized states which then transfer excitation to the RC through the linker states.
Despite considerable effort devoted toward determining the nature, function, and position in the complex of the red states, these are still open questions. Early picosecond fluorescence/pump–probe studies61,62 suggested that they act as concentrating pools of excitations before transmission to the reaction center. Subsequent picosecond studies of trimers showed energy exchange between different monomers in the red chromophore region and efficient energy dissipation when one of the reaction centers is in an oxidized (P700+) state.63 This may indicate that the red chromophores can be involved in photoprotection under high illumination conditions. It has been shown that in plants the excess energy is confined at the red edge of the absorption, where it is then transferred to luteins.64 The main part of the complex—the reaction center—is thus well-protected from photodamage. Additionally, in low-light conditions (shaded areas) these chromophores absorb a major portion of the energy, thus expanding the active optical regime. Based on the structural data, several configurations of the red BChl’s have been deduced by different methods. The dependence of the red absorption strength on the trimerization1 suggests that the red excitons are localized in the periphery of the PSI monomer, where the three monomers are in contact. Exciton models assigned lower transition energies to certain peripheral BChl’s.3,6,9,24,30 Our simulations show that these states do not participate significantly in the primary coherent energy-transfer processes of the complex. Excitons are transported to these states only at relatively long delay times (~1 ps), when coherences had already decayed. Thus, by neglecting exciton decay in the red chromophores, the red states act as traps, extending the spectral range of the absorption spectrum.
The long-standing ambiguity between Förster (localized) and Redfield (delocalized) exciton transport can be resolved by B type signals, which vanish for localized excitons, in the Förster transport regime. The coherences decay within 300 fs. Self-trapping makes excitons localized as the surrounding protein relaxes. We therefore expect the Redfield transport to cross over into the Förster regime at long delay times. This should show up as large Stokes shifts along the Ω3 axis. The t2 evolution, which can be observed through C type signals and simultaneous decay of B type signals, may be a good indication of this crossover.
Acknowledgments
This research was supported by the National Institutes of Health (GM-59230) and the National Science Foundation (CHE-0745892).
Appendix: Linear and 2D Photon Echo Signals
The absorption of a molecular aggregate is determined by exciton transition energy and the transition amplitude:
| (A1) |
where μe is the transition dipole of exciton state e, εe is its transition energy, and γe is the decay rate of single-exciton interband coherence induced by the bath; 〈…〉δ represents the ensemble averaging over static diagonal fluctuations. The eigenstate energies are obtained from
| (A2) |
where ψem are single-exciton wave functions (the diagonal static fluctuations are included in E). The exciton transition dipole in the dipole approximation for the aggregate is given by μe = Σmμmψem. The circular dichroism (CD) is similarly given by the rotational strength
| (A3) |
The rotational strength re = Σmnψmeψne(Rmn • (μm × μn)) contains a distance vector Rmn = Rm − Rn between pigments m and n in addition to the transition dipole. This expression neglects local magnetic dipole and electric quadrupole contributions of BChl’s, which may give chiral signal contributions for localized excitons.
We have simulated two-dimensional photon-echo optical signals generated using three short optical pulses with wave vectors k1, k2, and k3 in the direction k4 = −k1 + k2 + k3 (Figure 1b). The pulses are chronologically ordered: k1 comes first, followed by k2 and k3. The four-wave-mixing signal is recorded as a function of delay times (t1,t2,t3). Two-dimensional spectrograms SkI(Ω3,t2,Ω1) are obtained by performing one-sided two-dimensional Fourier transforms with respect to t1 → Ω1 and t3 → Ω3 holding t2 fixed. We further assume that the pulse spectral width covers the entire exciton bandwidth.
Simulations of the signal were performed using nonlinear exciton equations (NEE), which provide a quasi-particle (QP) representation of the optical response convenient for large complexes such as PSI (for derivation, see ref 33). The signal is given by
 |
(A4) |
where denotes the orientationally averaged product of transition dipole projections onto optical polarizations along ν4… ν1, and we have defined
 |
(A5) |
Here z is the complex frequency; Γe4e3e2e1 is the quasiparticle scattering matrix. All these expressions are given in the single-exciton eigenstate basis. The exciton scattering matrix in this basis set is
 |
(A6) |
and
 |
(A7) |
The other quantities in the response functions are the single-exciton transition dipole (beyond the dipole approximation for the aggregate)
| (A8) |
the single-exciton Green’s function
| (A9) |
and the single-exciton transport Green’s function  .
.
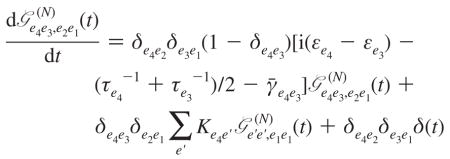
The exciton transport Green’s function describes the dissipative relaxation dynamics and, thus, the population relaxation pathways due to the bath. It is the solution of the Redfield equation, which we use in the secular approximation (the coherences are decoupled from the populations):
 |
(A10) |
Here Kee′ is the population relaxation rate within single-exciton block from state e′ to state e having properties Kee′ = Ke′e exp(βħ(εe′ − εe)) with β = (kBT)−1 and Σe′ Ke′e = 0; τe = Kee−1 is the state lifetime, and finally γ̄ee′ is the pure dephasing rate of the ee′ density matrix coherence.
The dephasing and relaxation parameters γ, γ̄, and K are calculated from system coupling with the bath in the limit of continuous spectral density. We assume that different and statistically independent bath coordinates are coupled to different molecules; i.e., each molecule is coupled to its own bath. The relaxation rates are calculated using the second order perturbation theory in coupling with the bath. These are given in ref 33.
Orientational averaging is performed afterward to account for isotropic solution as described in ref 33. The response function then is given as a superposition of the linearly independent tensor components. We focus on elementary tensor components (and their superpositions) of the 2D signals obtained by flipping polarization directions for certain pulses in the laboratory frame. We denote the tensor components by ν4ν3ν2ν1(n): here ν1 is the polarization of the k1 pulse,…, ν4 is polarization of the signal; (n) denotes the non-collinear wave vector configuration. These tensor components have been described in refs 33, 47, and 49.
The NC signals are obtained in the dipole approximation taking in eq A4 all kj = 0. The signals then do not depend on the wave vector. For nonchiral signals we consider the tensor . The other elementary tensor components are xyyx and xyxy. Instead of considering all of them, we describe their superpositions.47 Signal vanishes for t2 = 0. Its growth at short delay times demonstrates primary dynamic events after excitation. The signal , is designed so that population-involving contributions cancel out, giving a clear window into exciton coherences. At t2 = 0 this signal also cancels contributions from density matrix coherences in the stimulated emission. Thus, the signal at t2 = 0 shows solely contributions from exciton coherences in the excited-state absorption. The signal cancels contributions when first (second) interaction coincides with third (fourth). It thus excludes all density matrix coherences in stimulated emission, population-conserving stimulated emission, and diagonal contributions in bleaching. The remaining, population transport, pathways are thus clearly visible. Strong diagonal contributions are eliminated as well.
The chirality-induced signals are obtained as the first order correction in the wave vector obtained by series expansion in the wave vector. There are six CI tensor components. We consider just three of them: xxyz(n), xyxz(n), and xyzx(n). Here additional n indicated non-collinear laser configurations which are needed to satisfy the transverse electric field property of the optical field with the propagation direction. These tensor components allow composing A, B, and C type signals and involve fewer transition dipole products than ones from collinear laser configurations (such as xxxy). The superpositions are for the primary exciton dynamics, for probing the density matrix coherences, and for population relaxation pathways.
References and Notes
- 1.Gobets B, van Grondelle R. Biochim Biophys Acta. 2001;1507:80. doi: 10.1016/s0005-2728(01)00203-1. [DOI] [PubMed] [Google Scholar]
- 2.Turconi S, Kruip J, Schweitzer G, Rögner M, Holzwarth AR. Photosynth Res. 1996;49:263. doi: 10.1007/BF00034787. [DOI] [PubMed] [Google Scholar]
- 3.Jordan P, Fromme P, Witt HT, Klukas O, Saenger W, Kraus N. Nature (London) 2001;411:909. doi: 10.1038/35082000. [DOI] [PubMed] [Google Scholar]
- 4.Canfield P, Dahlbom MG, Hush NS, Reimers JR. J Chem Phys. 2006;124:024301. doi: 10.1063/1.2148956. [DOI] [PubMed] [Google Scholar]
- 5.Fromme P, Mathis P. Photosynth Res. 2004;80:109. doi: 10.1023/B:PRES.0000030657.88242.e1. [DOI] [PubMed] [Google Scholar]
- 6.Sener MK, Lu D, Ritz T, Park S, Fromme P, Schulten K. J Phys Chem B. 2002;106:7948. doi: 10.1063/1.1739400. [DOI] [PubMed] [Google Scholar]
- 7.Zazubovich V, Matsuzaki S, Johnson TW, Hayes JM, Chitnis PR, Small GJ. Chem Phys. 2002;275:47. [Google Scholar]
- 8.Riley KJ, Reinot T, Jankowiak R, Fromme P, Zazubovich V. J Phys Chem B. 2007;111:286. doi: 10.1021/jp062664m. [DOI] [PubMed] [Google Scholar]
- 9.Vaitekonis S, Trinkunas G, Valkunas L. Photosynth Res. 2005;86:185. doi: 10.1007/s11120-005-2747-x. [DOI] [PubMed] [Google Scholar]
- 10.Croce R, Chojnicka A, Morosinotto T, Ihalainen JA, van Mourik F, Dekker JP, Bassi R, van Grondelle R. Biophys J. 2007;93:2418. doi: 10.1529/biophysj.107.106955. [DOI] [PMC free article] [PubMed] [Google Scholar]
- 11.Fleming GR, van Grondelle R. Curr Opin Struct Biol. 1997;7:738. doi: 10.1016/s0959-440x(97)80086-3. [DOI] [PubMed] [Google Scholar]
- 12.van Amerogen H, Valkunas L, van Grondelle R. Photosynthetic Excitons. World Scientific; Singapore: 2000. [Google Scholar]
- 13.Palsson LO, Flemming C, Gobets B, van Grondelle R, Dekker JP, Schlodder E. Biophys J. 1998;74:2611. doi: 10.1016/S0006-3495(98)77967-6. [DOI] [PMC free article] [PubMed] [Google Scholar]
- 14.Gibasiewicz K, Ramesh VM, Lin S, Woodbury NW, Webber AN. J Phys Chem B. 2002;106:6322. [Google Scholar]
- 15.Müller MG, Niklas J, Lubitz W, Holzwarth AR. Biophys J. 2003;85:3899. doi: 10.1016/S0006-3495(03)74804-8. [DOI] [PMC free article] [PubMed] [Google Scholar]
- 16.Mi D, Chen M, Lin S, Lince M, Larkum AWD, Blankenship RE. J Phys Chem B. 2003;107:1452. [Google Scholar]
- 17.Savikhin A, Xu W, Chitnis PR, Struve WS. Biophys J. 2000;79:1573. doi: 10.1016/S0006-3495(00)76408-3. [DOI] [PMC free article] [PubMed] [Google Scholar]
- 18.Yang M, Fleming GR. J Chem Phys. 2003;119:5614. [Google Scholar]
- 19.Yang M, Damjanovic A, Vaswani HM, Fleming GR. Biophys J. 2003;85:140. doi: 10.1016/S0006-3495(03)74461-0. [DOI] [PMC free article] [PubMed] [Google Scholar]
- 20.Holzwarth AR, Müller MG, Niklas J, Lubitz W. Biophys J. 2006;90:552. doi: 10.1529/biophysj.105.059824. [DOI] [PMC free article] [PubMed] [Google Scholar]
- 21.Gobets B, van Stokkum IHM, Rögner M, Kruip J, Schlodder E, Karapetyan NV, Dekker JP, van Grondelle R. Biophys J. 2001;81:407. doi: 10.1016/S0006-3495(01)75709-8. [DOI] [PMC free article] [PubMed] [Google Scholar]
- 22.Gobets B, van Stokkum IHM, van Mourik F, Dekker JP, van Grondelle R. Biophys J. 2003;85:3883. doi: 10.1016/S0006-3495(03)74803-6. [DOI] [PMC free article] [PubMed] [Google Scholar]
- 23.Melkozernov AN, Lin S, Blankenship RE. J Phys Chem B. 2000;104:1651. doi: 10.1021/jp993257w. [DOI] [PubMed] [Google Scholar]
- 24.Byrdin M, Jordan P, Krauss N, Fromme P, Stehlik D, Schlodder E. Biophys J. 2002;83:433. doi: 10.1016/S0006-3495(02)75181-3. [DOI] [PMC free article] [PubMed] [Google Scholar]
- 25.Vaswani HM, Stenger J, Fromme P, Fleming GR. J Phys Chem B. 2006;110:26303. doi: 10.1021/jp061008j. [DOI] [PubMed] [Google Scholar]
- 26.Renger T, May V, Kühn O. Phys Rep. 2001;343:137. [Google Scholar]
- 27.Louwe RJW, Vrieze J, Hoff AJ, Aartsma TJ. J Phys Chem B. 1997;101(51):11280. [Google Scholar]
- 28.Dashdorj N, Xu W, Martinsson P, Chitnis PR, Savikhin S. Biophys J. 2004;86:3121. doi: 10.1016/S0006-3495(04)74360-X. [DOI] [PMC free article] [PubMed] [Google Scholar]
- 29.Gobets B, Valkunas L, van Grondelle R. Biophys J. 2003;85:3872. doi: 10.1016/S0006-3495(03)74802-4. [DOI] [PMC free article] [PubMed] [Google Scholar]
- 30.Damjanovic A, Vaswani HM, Fromme P, Fleming GR. J Phys Chem B. 2002;106:10251. [Google Scholar]
- 31.Brüggemann B, Sznee K, Novoderezhkin V, van Grondelle R, May V. J Phys Chem B. 2004;108:13536. [Google Scholar]
- 32.Cho M. Chem Rev. 2008;108:1331. doi: 10.1021/cr078377b. [DOI] [PubMed] [Google Scholar]
- 33.Abramavicius D, Palmieri B, Voronine DV, Šanda F, Mukamel S. Chem Rev. 2008 doi: 10.1021/cr800268n. in press. [DOI] [PMC free article] [PubMed] [Google Scholar]
- 34.Chernyak V, Zhang WM, Mukamel S. J Chem Phys. 1998;109:9587. [Google Scholar]
- 35.Zhang WM, Chernyak V, Mukamel S. J Chem Phys. 1999;110:5011. [Google Scholar]
- 36.Ernst RR, Bodenhausen G, Wokaun A. Principles of Nuclear Magnetic Resonance in One and Two Dimensions. Clarendon Press; Oxford: 1998. [Google Scholar]
- 37.Mukamel S. Annu Rev Phys Chem. 2000;51:691. doi: 10.1146/annurev.physchem.51.1.691. [DOI] [PubMed] [Google Scholar]
- 38.Jonas DM. Annu Rev Phys Chem. 2003;54:425. doi: 10.1146/annurev.physchem.54.011002.103907. [DOI] [PubMed] [Google Scholar]
- 39.Rubstov IV, Wang J, Hochstrasser RM. Proc Natl Acad Sci USA. 2003;100:5601. doi: 10.1073/pnas.0931292100. [DOI] [PMC free article] [PubMed] [Google Scholar]
- 40.Zanni MT, Ge NH, Kim YS, Hochstrasser RM. Proc Natl Acad Sci USA. 2001;98:11265. doi: 10.1073/pnas.201412998. [DOI] [PMC free article] [PubMed] [Google Scholar]
- 41.Hochstrasser RM. Chem Phys. 2001;266:273. [Google Scholar]
- 42.Piryatinski A, Chernyak V, Mukamel S. Chem Phys. 2001;266:285. [Google Scholar]
- 43.Brixner T, Mančal T, Stiopkin IV, Fleming GR. J Chem Phys. 2004;121:4221. doi: 10.1063/1.1776112. [DOI] [PubMed] [Google Scholar]
- 44.Brixner T, Stenger J, Vaswani HM, Cho M, Blankenship RE, Fleming GR. Nature (London) 2005;434:625. doi: 10.1038/nature03429. [DOI] [PubMed] [Google Scholar]
- 45.Engel GS, Calhoun TR, Read EL, Ahn TK, Mančal T, Cheng YC, Blankenship RE, Fleming GR. Nature (London) 2007;446:782. doi: 10.1038/nature05678. [DOI] [PubMed] [Google Scholar]
- 46.Demirdoven N, Khalil M, Tokmakoff A. Phys Rev Lett. 2002;89:237401. doi: 10.1103/PhysRevLett.89.237401. [DOI] [PubMed] [Google Scholar]
- 47.Abramavicius D, Voronine DV, Mukamel S. Biophys J. 2008;94:3613. doi: 10.1529/biophysj.107.123455. [DOI] [PMC free article] [PubMed] [Google Scholar]
- 48.Voronine DV, Abramavicius D, Mukamel S. Biophys J. 2008;95:4896. doi: 10.1529/biophysj.108.134387. [DOI] [PMC free article] [PubMed] [Google Scholar]
- 49.Abramavicius D, Zhuang W, Mukamel S. J Phys B: At, Mol Opt Phys. 2006;36:5051. [Google Scholar]
- 50.Davydov A. A Theory of Molecular Excitions. McGraw-Hill; New York: 1962. [Google Scholar]
- 51.Abramavicius D, Palmieri B, Mukamel S. Chem Phys. 2009;357:79. doi: 10.1016/j.chemphys.2008.10.010. [DOI] [PMC free article] [PubMed] [Google Scholar]
- 52.Sener MK, Jolley C, Ben-Shem A, Fromme P, Nelson N, Croce R, Schulten K. Biophys J. 2005;89:1630. doi: 10.1529/biophysj.105.066464. [DOI] [PMC free article] [PubMed] [Google Scholar]
- 53.Yin S, Dahlbom MG, Canfield PJ, Hush NS, Kobayashi R, Reimers JR. J Phys Chem B. 2007;111:9923. doi: 10.1021/jp070030p. [DOI] [PubMed] [Google Scholar]
- 54.Schlodder E, Shubin VV, El-Mohsnawy E, Roegner M, Karapetyan NV. Biochim Biophys Acta. 2007;1767:732. doi: 10.1016/j.bbabio.2007.01.013. [DOI] [PubMed] [Google Scholar]
- 55.Ben-Shem A, Frolow F, Nelson N. Nature (London) 2003;426:630. doi: 10.1038/nature02200. [DOI] [PubMed] [Google Scholar]
- 56.Amunts A, Drory O, Nelson N. Nature (London) 2007;447:58. doi: 10.1038/nature05687. [DOI] [PubMed] [Google Scholar]
- 57.Jensen PE, Bassi R, Boekema EJ, Dekker JP, Jansson S, Leister D, Robinsosn C, Scheller HV. Biochim Biophys Acta. 2007;1767:335. doi: 10.1016/j.bbabio.2007.03.004. [DOI] [PubMed] [Google Scholar]
- 58.Amunts A, Nelson N. Plant Physiol Biochem. 2008;46:228. doi: 10.1016/j.plaphy.2007.12.013. [DOI] [PubMed] [Google Scholar]
- 59.Engelmann E, Zucchelli G, Casazza AP, Brogioli D, Garlaschi FM, Jennings RC. Biochemistry. 2006;45:6947. doi: 10.1021/bi060243p. [DOI] [PubMed] [Google Scholar]
- 60.Gardian Z, Bumba L, Schrofel A, Herbstova M, Neberasova J, Vacha F. Biochim Biophys Acta. 2007;1767:725. doi: 10.1016/j.bbabio.2007.01.021. [DOI] [PubMed] [Google Scholar]
- 61.Werst M, Jia Y, Mets L, Fleming GR. Biophys J. 1992;61:868. doi: 10.1016/S0006-3495(92)81894-5. [DOI] [PMC free article] [PubMed] [Google Scholar]
- 62.Holzwarth AR, Schatz G, Brock H, Bittersmann E. Biophys J. 1993;64:1813. doi: 10.1016/S0006-3495(93)81552-2. [DOI] [PMC free article] [PubMed] [Google Scholar]
- 63.Karapetyan NV, Holzwarth AR, Rögner M. FEBS Lett. 1999;460:395. doi: 10.1016/s0014-5793(99)01352-6. [DOI] [PubMed] [Google Scholar]
- 64.Andreeva A, Abarova S, Stoitchkova K, Picorel L, Velitchkova M. Photochem Photobiol. 2007;83:1301. doi: 10.1111/j.1751-1097.2007.00136.x. [DOI] [PubMed] [Google Scholar]


