Summary
Recordings in the locust antennal lobe (AL) reveal activity-dependent, stimulus-specific changes in projection neuron (PN) and local neuron response patterns over repeated odor trials. During the first few trials, PN response intensity decreases, while spike time precision increases, and coherent oscillations, absent at first, quickly emerge. We examined this “fast odor learning” with a realistic computational model of the AL. Activity-dependent facilitation of AL inhibitory synapses was sufficient to simulate physiological recordings of fast learning. In addition, in experiments with noisy inputs, a network including synaptic facilitation of both inhibition and excitation responded with reliable spatiotemporal patterns from trial to trial despite the noise. A network lacking fast plasticity, however, responded with patterns that varied across trials, reflecting the input variability. Thus, our study suggests that fast olfactory learning results from stimulus-specific, activity-dependent synaptic facilitation and may improve the signal-to-noise ratio for repeatedly encountered odor stimuli.
Introduction
Locust antennal lobe (AL) responses to odor presentations are oscillatory and temporally structured (Laurent and Davidowitz, 1994). AL oscillations have been shown to play an important role for signal decoding by downstream networks (Perez-Orive et al., 2004; Perez-Orive et al., 2002). Disrupting AL oscillations by application of the GABAA antagonist picrotoxin leads to a loss of information about odors in mushroom body neurons (MacLeod et al., 1998; Perez-Orive et al., 2004). Behavioral experiments with honeybees show that oscillatory synchronization of AL neurons is needed for fine odor discrimination (Hosler et al., 2000; Stopfer et al., 1997). Similarly, suppressing synchronous oscillations in the Limax procerebral lobe by L-NAME (Teyke and Gelperin, 1999) reduced its ability to discriminate between similar odorants.
An interesting aspect of olfaction is that stimuli tend to repeat. Turbulent media (air or water) break up continuous streams of odorant into discrete filaments that pass separately and repeatedly over olfactory receptors (Murlis et al., 1992); in addition, iterative behaviors such as sniffing (in vertebrates [Gray and Skinner, 1988]) and antennal flicking (in insects and other arthropods [Mellon, 1997]) ensure repeated odor encounters, even in the absence of turbulence (as when odor sources are nearby).
Olfactory systems appear to exploit this feature of olfactory stimuli: in insects and vertebrates, odor responses in first-order olfactory interneurons can change dramatically over the course of repeated stimuli, independent of sensory adaptation (Stopfer and Laurent, 1999; Vanderwolf and Zibrowski, 2001). In the locust AL, projection neurons (PNs) respond to repeated odor trials with decreasing intensity (fewer action potentials), but increasing coherence and precision: PN action potentials become more precisely aligned with those in other PNs, evident in paired intracellular and multiunit recordings and in the temporal evolution of oscillatory local field potentials (LFPs) (Stopfer and Laurent, 1999). Moreover, the coherent state carries more stimulus-related information (MacLeod et al., 1998; Stopfer et al., 1997). These short-lived, activity-dependent changes occur largely within the circuitry of the AL and are stimulus specific: changes induced by one odorant are not evident when a novel odorant is introduced, unless the novel odorant is chemically similar to the original one (Stopfer and Laurent, 1999).
Because it is difficult to make recordings from synaptically connected pairs of AL interneurons, the mechanisms underlying this plasticity have yet to be characterized. Here, in a realistic computational model of the AL (Bazhenov et al., 2001a; Bazhenov et al., 2001b), we test ideas about the sites and potential functions of this plasticity. It has been proposed that this plasticity endows a single AL circuit with the ability to perform two apparently opposing functions: first, signal the presence of a novel stimulus with a strong burst of activity (the system at rest is at peak sensitivity); and later, if the stimulus persists (and is thus potentially important), provide a more precise, discriminating description (Stopfer and Laurent, 1999). With our model, we propose and test an additional potential benefit of this plasticity: that it serves to improve the signal-to-noise ratio in responses elicited by repeated stimuli. The results lead to the prediction that fast odor learning is caused by activity-dependent facilitation of excitatory as well as fast and slow inhibitory synapses in the AL.
Results
Effect of AL Synaptic Plasticity on Network Responses
Recordings from the locust AL during presentations of novel odors demonstrated two important features used to constrain the model. First, the LFP oscillates very little, if at all, during the first one or two trials with a new odor; rather, 20 Hz oscillations appear gradually over the first several trials. Second, the average number of spikes produced by PNs is greatly decreased during repetitive stimulation with the same odor; the slow patterning that is typical of PN responses is not always evident during the first trials (Stopfer and Laurent, 1999). Where might this plasticity reside? PN oscillatory coherence can be abolished by the application of picrotoxin to the AL (MacLeod and Laurent, 1996); this suggests that the strength of fast GABAergic synapses of LNs onto PNs might be low during the first few trials with a novel odor and gradually increase during subsequent presentations of the same odor. Application of picrotoxin, however, does not alter the average number of PN spikes (MacLeod et al., 1998; MacLeod and Laurent, 1996). Consistent with this, our previous modeling studies found that blocking fast GABAA-mediated inhibition in the AL model resulted in a loss of synchrony but did not change the average PN firing rate; in fact, the slow temporal structure of PN firing remained intact (Bazhenov et al., 2001a). This suggests that both fast-type receptors and slow inhibitory receptors controlling the slow temporal structure and rate of PN output might be modulated during repeated odor encounters.
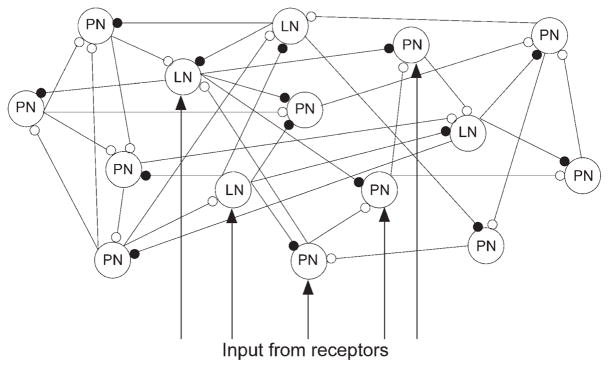
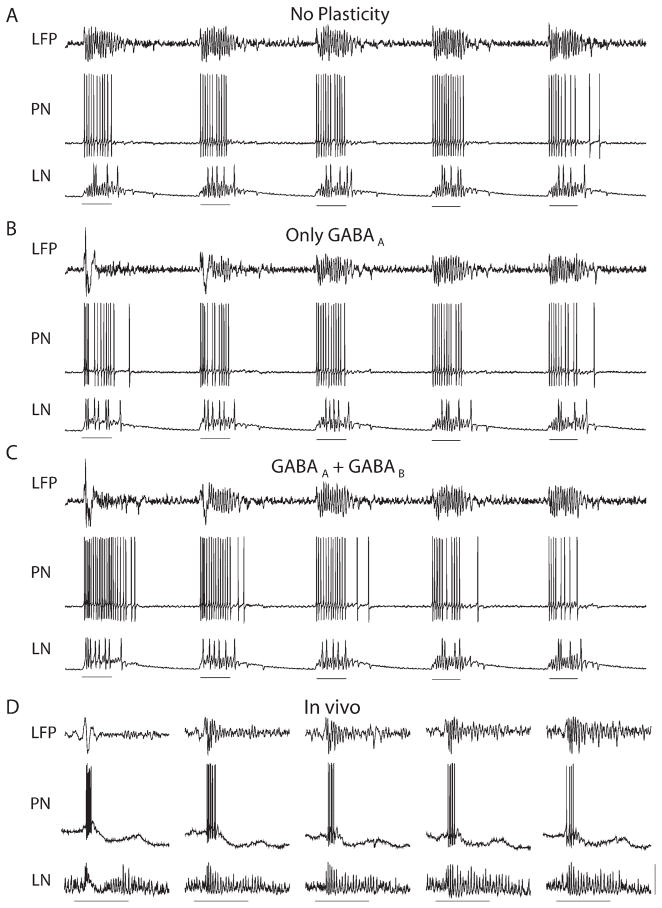
To test these hypotheses, we prepared three versions of a realistic computational model of the AL (see Figure 1): one with fixed synaptic weights, one in which only fast GABAA receptors could facilitate, and one in which both fast and slow inhibitory receptors could facilitate (see Experimental Procedures). In facilitating models, the initial strengths of the inhibitory receptors were set to be too weak to maintain synchronous PN oscilla- tions. Figure 2 shows the average network response (LFP) and membrane potentials for one PN and one LN from the network during the first five trials with an odor stimulus. The model with fixed, strong synapses re- sponded with relatively consistent patterns in all five trials (Figure 2A). The model with initially weak, facilitating fast GABAA receptors (Figure 2B) displayed strong onset responses followed by reduced network activity, caused by the increasing activation of slow inhibitory receptors. Although oscillatory synchrony increased, as observed in vivo, the average number of PN spikes changed very little (less than 30%) during subsequent trials with the same odor, inconsistent with experimental results. These results are quantified in Figure 3B (left).
Figure 1. The Network Model Included 90 PNs and 30 LNs.
To simulate odor presentation, a fraction (33%) of the total cell population was stimulated by time-modulated current pulses (see Experimental Procedures). Intrinsic interconnections between LNs and PNs were random with 0.5 probabilities. Open circuits indicate excitatory synapses, and closed circuits indicate inhibitory synapses.
Figure 2. Evolution of the AL Responses over Repeated Stimulus Presentations.
(A) No plasticity.
(B) Plasticity in fast GABAA-type synapses only.
(C) Plasticity in both fast GABAA-type and slow GABAB-type synapses. Without facilitation of the slow inhibitory receptors, the PN firing rate changed very little during training (spike count quantified in Figure 3). Application of odor indicated by 500 ms line beneath responses in each panel.
(D) Simultaneous recordings of LFP, PN, and LN from the locust reveal similar response evolution. Calibration: stimulus bar, 1 s; vertical bar, 0.6 (LFP), 18 (PN), 5 (LN) mV.
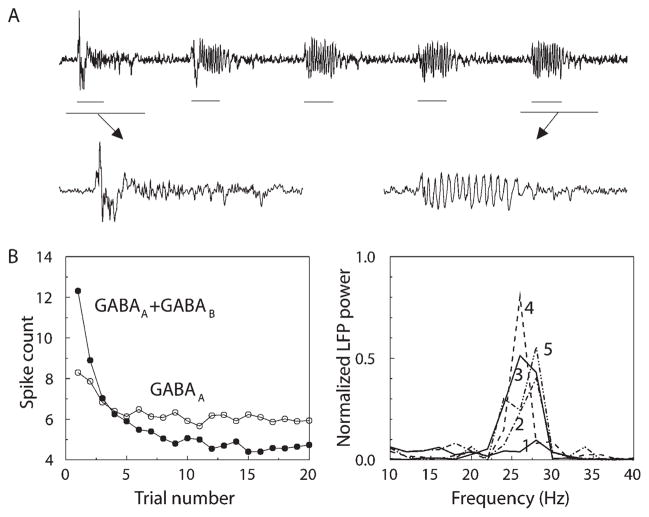
Figure 3. Oscillatory Response Increased While Firing Rate Decreased during Repetitive Stimulus Presentations.
(A) Expanded time series shows increase of oscillations during trial 5 compared with trial 1 in the model with GABAA and GABAB facilitation.
(B) (Left) The number of odor-elicited action potentials in PNs decreased markedly during the first two to three trials. All spikes within the 500 ms odor response period were counted. Data from model with only GABAA facilitation (open circuits) and with both GABAA and GABAB facilitation (closed circuits). (Right) Oscillatory (~26 Hz) component of the power spectrum increased during the first three trials.
Figure 2C illustrates the results obtained when both fast and slow inhibition could facilitate. This network started with intense PN responses only partially reduced by initially weak slow inhibition. PN firing rates were high during the first few trials and decreased over subsequent trials, a result of the facilitation of slow inhibition (see Figure 3B, left). Figure 2D shows experimental results from locust illustrating both the increase in oscillatory power and the decrease in spike count over the first few trials. Thus, our model suggests that facilitation of both fast and slow inhibitions during repetitive trials is needed to account for our experimental results.
Modulations of the Synaptic Structure by Odor Stimulation
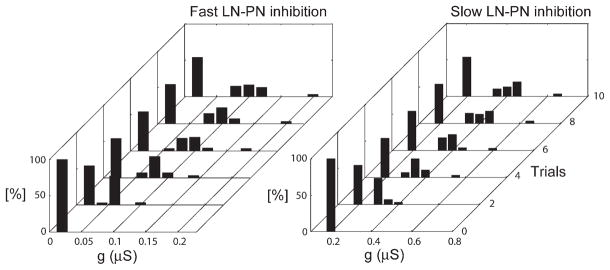
In the model with facilitating fast and slow inhibition, as in the locust, the power of AL 25–30 Hz oscillations greatly increased during the first few presentations of a stimulus (Figure 3A). Spectral analysis of the LFP produced by the model (Figure 3B, right) showed that 25–30 Hz oscillatory power increased most noticeably within the first three trials. The number of stimulus-induced PN spikes also changed most noticeably during these first three trials (Figure 3B, left). The number of trials required to attain an oscillatory response depended on the rate of facilitation. Figure 4 shows the distribution of synaptic weights for fast and slow LN-PN synapses over the model network for each trial. Most of the changes occurred during the first two to three trials, and the synaptic weight distribution became approximately stationary after seven to eight trials. This figure also shows that only about 40% of the inhibitory synapses in the network became facilitated during stimulation: these were the synapses activated by the stimulus; those not activated remained weak. Similar changes occurred for inhibitory synapses between LNs (data not shown).
Figure 4. Changes in the Synaptic Strength of the Inhibitory Synapses during Repetitive Stimulus Presentations.
(Left) Distributions of synaptic weights for GABAA mediated synapses between LNs and PNs (0.02 μS bins), over repeated trials. (Right) Distributions of synaptic weights for slow inhibitory synapses between LNs and PNs (0.05 μS bins). Before the first trial, all synapses had the same strength gGABAA(LN-PN) = 0.02 μS, gslow(LN-PN) = 0.2 μS. After the third trial, about 40% of all inhibitory synapses increased in strength. The distribution stabilized after about six trials.
Stimulus Specificity
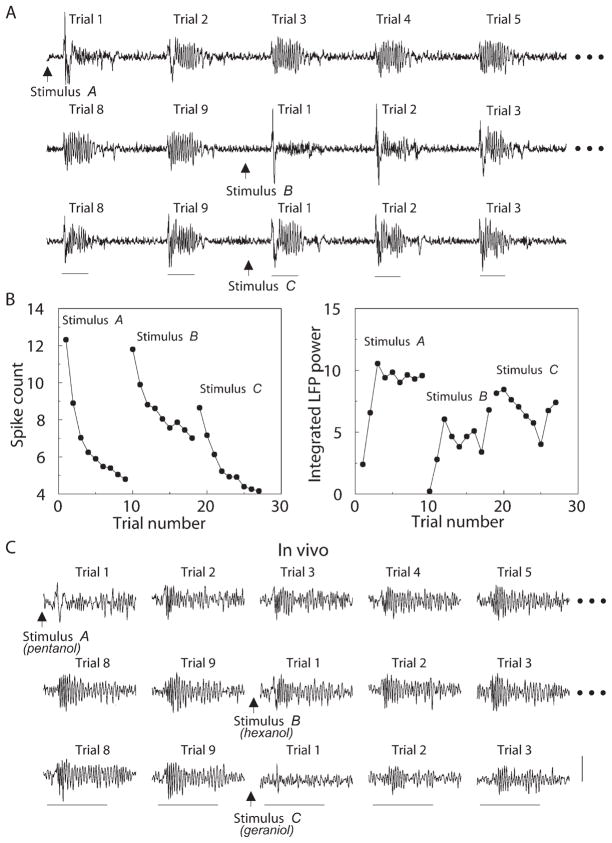
In vivo experiments in locusts showed that a novel odorant does not elicit an oscillatory response even when it follows a coherence-inducing series of presentations of a different odor. If the two odors are chemically similar, however, some carryover will occur (Stopfer and Laurent, 1999). To examine this phenomenon with our model, we used two sets of inputs. “Chemically similar” inputs were simulated by activating significantly overlapping (~50%) sets of PNs and LNs from the network; “chemically distinct” stimuli were simulated by activating nonoverlapping subsets of neurons. Figure 5 shows examples of three different odors where odors A and B were distinct, and odors B and C were similar. After the first few trials with odor A, the network response became oscillatory (Figure 5A), the number of PN spikes decreased by more than 50% (Figure 5B, left), and the integrated power of LFP oscillations (20–30 Hz) increased significantly (Figure 5B, right). After nine trials with odor A, the stimulus was changed to odor B. Because this input was different from A, it activated a different subset of inhibitory synapses between LNs and PNs. These synapses were un- trained by odor A, therefore the network displayed naive responses to the first few trials with B. PN spike count and integrated LFP power also changed (Figure 5B). Finally, C was introduced after nine trials with B. Because C is similar to B, changes were less dramatic, and trial 1 displayed very strong oscillations immediately (Figure 5A); PN spike count and integrated LFP power changed little between the last trial with B and the first trial with C. These results are in a good agreement with experimental data from locust (Figure 5C). In this example, A (pentanol) and B (hexanol) are related, while C (geraniol) is distinct from both A and B. Note the carryover from A to B and the naive LFP in trial 1 with C.
Figure 5. Effect of Stimulus Change on the Network Response.
(A) Example of LFP evolution. When input A was changed to a different stimulus B after nine trials (arrow shows time of change), the network produced a naive response. Similar stimulus C (second input change) evoked a partially oscillatory response from the first presentation.
(B) The number of odor-elicited PN action potentials (left) and integrated LFP power (20–30 Hz) (right) for one set of trials with odors A, B, and C (as above) quantify the network’s responses to stimuli different from and similar to that used for training.
(C) LFP recordings from the locust show similar response dynamics. Pentanol and hexanol are similar odorants, whereas geraniol is different. Calibration: stimulus bar, 1 s; vertical bar, 0.6 mV.
When a number of different stimuli were presented in sequence to the model network, coherence of the resulting responses depended on the history of stimulation. Depending upon the recovery time to naive synaptic weights, a series of sufficiently different stimuli could saturate the network, such that eventually, any new input immediately produced an oscillatory response (data not shown). This saturation diminished when the interval between stimulus sets increased, so that synaptic weights could decay to initial values between stimuli. In vivo, the half-time for recovery from fast learning plasticity is about 4–6 min (Stopfer and Laurent, 1999).
Role for AL Plasticity in Improving Reliability of PN Responses
The processing of olfactory stimuli includes two opposing goals: one is to accurately distinguish different but related odors; the other is to correctly classify noisy instances of the same stimulus. Spatiotemporal representation may increase the sensitivity and capacity of the AL, but they might decrease reliability when faced with noise (e.g., variations of the intensity of activation, identities of activated PNs, or transient or unreliable “background” stimuli). Could fast learning in the AL serve to enhance the reliability of odor identification? During repeated odor presentations, the effects of noise would be minimized, since its contribution would be different on each trial, mainly affecting untrained, weak synapses. Thus, fast learning might enable repetitive presentations of a stimulus in a noisy environment to create a pattern of activity similar to that evoked by repetitive presentations of a noise-free stimulus.
We used the AL model with intact synaptic plasticity to test this idea. To a set of neurons representing a “pure” and consistent stimulus (33% of the population; see Figure 1), for each trial, we added a small, variable subset (up to 5% of the total population, 3% in most simulations) of LNs, or of LNs and PNs, as “noise.” These additional neurons were selected randomly every 50 ms. Since we were using a version of the model in which only inhibitory synapses undergo facilitation, we predicted that “noise reduction” should work better when only the LN input contains noise. We start with this unrealistic but simple case, because it allows us to better explore the proposed hypotheses. We will then consider the more realistic case of noisy activity in both LNs and PNs.
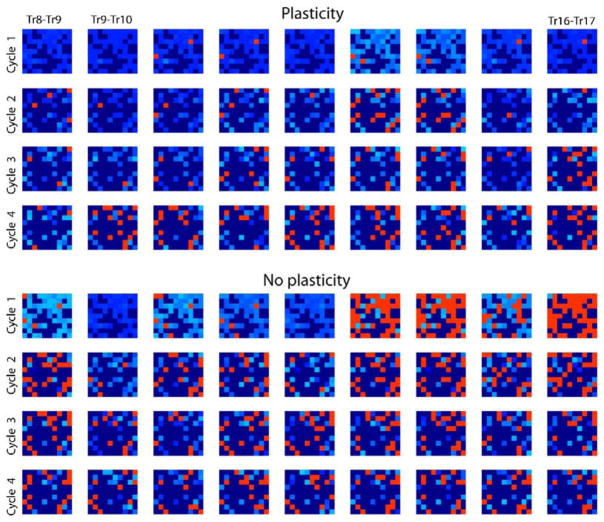
We quantified response reliability by comparing the firing phase of PN spikes in consecutive trials. For each cycle i of the LFP oscillation, the phase of each PN spike, pi(k,l) (where k is trial number and l is cell number) was measured relative to the nearest LFP peak (−0.5 < pi < 0.5; pi = 0 corresponds to the ith peak of LFP; pi = ±0.5 corresponds to the nearest LFP minima). Ten trials with different input noise were simulated, and the difference between phase distributions of each two consecutive trials [Δpi(k,l) = pi(k,l) − pi(k − 1,l)] was calculated. Figure 6 shows the results (first four cycles of LFP oscillations) when only LN input contained noise. Red pixels indicate neurons where spike phase changed greatly between trials (phase shift was more than 10% of the period of LFP oscillations), and light blue pixels indicate the neurons with only small changes in spike phases (phase shift was less than 10% of the period of LFP oscillations). Results show that the network with synaptic plasticity responded with much more consistent spatiotemporal patterns from trial to trial despite random input fluctuations. The network lacking fast learning, however, responded with patterns that changed markedly between trials, reflecting the input variability. This difference between the two models was most prominent during the first 200–250 ms of odor stimulation and became less significant later. After the fourth odor-induced oscillatory cycle, across-trial variability was slightly increased in the model that included plasticity but was reduced in the model lacking plasticity (see Figure 6). This change of correlation between response patterns over the odor duration is similar to dynamic odor decorrelation found in the experiments with zebrafish (Friedrich et al., 2004; Friedrich and Laurent, 2001).
Figure 6. Odor Learning and the Reliability of PN Responses.
In addition to the “pure” stimulus, noise (see Experimental Procedures) was added to the input in all trials. For each cycle of the network oscillations, PN spike phase was calculated relative to the nearest LFP peak. Each plot (9 × 10) displays differences between spike phases on adjacent trials (k – 1) and k (90 PNs, ten trials total for k = 9 to k = 17); four LFP cycles are shown. Dark blue indicates silent cells. Light blue indicates those PN spikes that were different between trials by less than 10% of the period of LFP oscillations (100% corresponds to the distance between LFP peaks). Red indicates PN spikes with phase differences exceeding 10%. The model with plasticity produced significantly smaller variability in spike phase [ANOVA: Fmodel(1,6479) = 147.81; p < 0.00001].
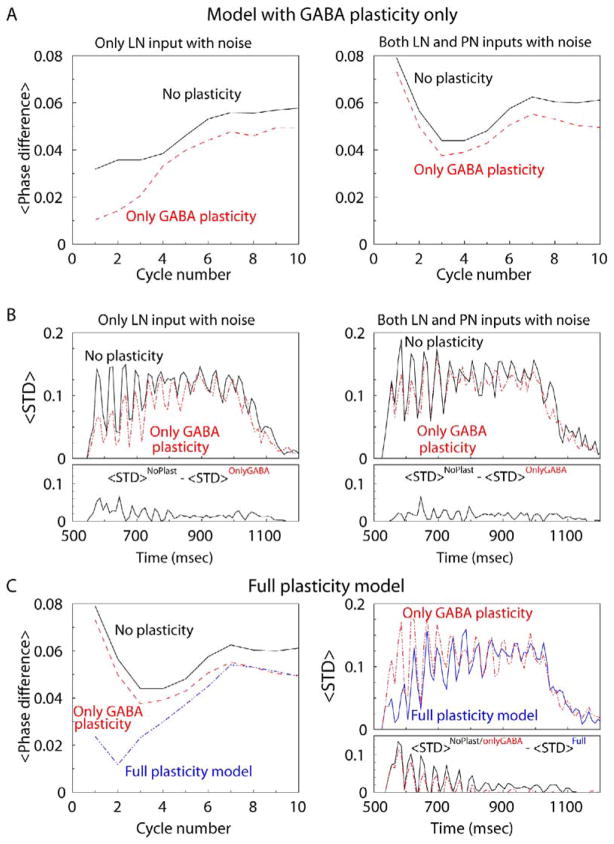
To quantify the effect of plasticity, the difference between PN spike phases at nearby trials with noise [Δpi(k,l) as shown in Figure 6] was first averaged across all PNs and across all trial pairs [<Δpi(k,l)>k,l]. This experiment was repeated independently N = 10 times with different noise; the average phase difference [<Δpi(k,l)>k,l,N] was plotted versus cycle number i (Figure 7A, left). During the first three cycles in the network with plasticity, this amount of variability was greatly reduced, to about 30% of that for the AL model with fixed synapses. In both models, average difference started to increase at cycle 4 and was saturated near the end of the trial (cycles 8 to 9). However, when we added noise to the inputs of both PNs and LNs, the result was quite different. Since excitatory synapses were fixed in the model, plasticity could not compensate for the variations of PN activity; each PN activated by random in- put noise could affect activity of all its postsynaptic PNs and LNs, thus changing the network activity (Figure 7A, right).
Figure 7. Effect of Learning on the Precision of PN Spiking.
(A and B) AL model with facilitation of inhibitory synapses only. (Left) Only the LN input contains noise. (Right) Both PN and LN inputs contain noise. (A) Difference between PN spike phases at consecutive trials with noise (as shown in Figure 6), averaged across all PNs, across ten trial pairs (starting from trial pair 8–9), and finally, across ten independent trial sequences with different noise. Synaptic plasticity reduced the effect of the input noise to LNs by more than 30%. (B) (Top) PN spikes were counted in 10 ms bins during “odor” stimulation. For each bin, a standard deviation of PN spikes across ten trials, <STD>, was calculated starting from trial 10 and then averaged for all PNs in the network. Each trial lasted 500 ms. (Bottom) <STD> was averaged across ten independent trial sequences with different noise. Average <STD> obtained in the model with inhibitory plasticity, <STD>OnlyGABA, was subtracted from the result obtained in the model without plasticity, <STD>NoPlasticity.
(C) Average difference between PN spike phase distributions (left) and average STD (right) for the AL model where all synapses display facilitation during repetitive stimulations. Both PN and LN inputs contain noise. Plasticity in all synapses greatly decreased response variability despite the presence of input noise.
Figure 7B presents another measure of the reliability of PN responses. PN spikes were counted in 10 ms bins. For each bin, the standard deviation of PN spikes across ten trials with noisy stimuli was calculated and then averaged for all PNs in the network (<STD>l). The average STD is plotted versus time (Figure 7B, top left). Again, the network with plasticity produced more reliable responses. We repeated this experiment indepen- dently N = 10 times, each with different noise. Average STD was calculated (<STD>l,N), and the result obtained with plasticity was subtracted from the result obtained without plasticity (<STD>l,NNoPlasticity – <STD>l,NOnlyGABA) (see Figure 7B, bottom left). This analysis indicates consistently higher variability (observed through all cycles) of spike count in the model without plasticity. This was true, however, when noise was provided to the LN input only. The models performed similarly when noise was delivered to both LN and PN inputs (Figure 7B, right).
AL Model with All Synapses Possessing Plasticity
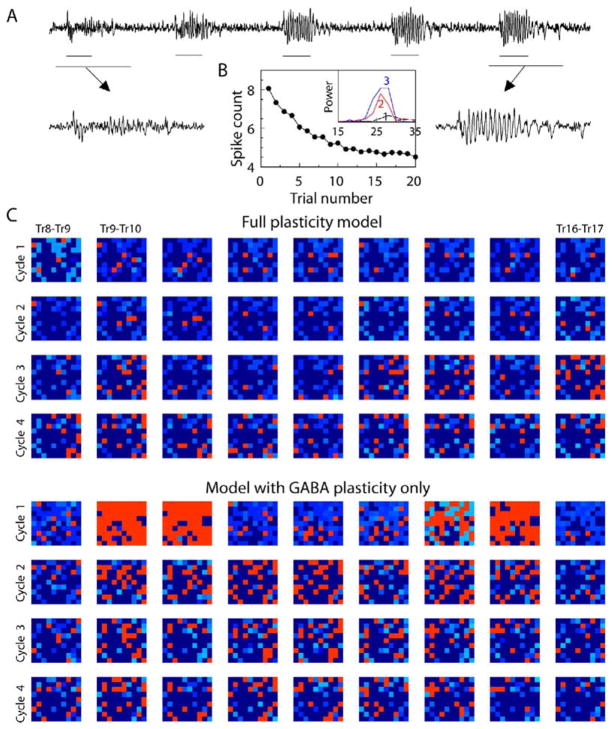
In an effort to bring the results of the model in line with experimental observations, we next examined a network in which all intrinsic synapses, excitatory as well as inhibitory, could undergo plasticity. Afferent synapses delivering odor input to the AL network remained fixed. Figure 8 presents results for an AL model identical to the previous one except that excitatory PN-PN and PN-LN synapses were no longer fixed. Their initial values were set to 33% of the weights of the previous model, and the rate of facilitation was chosen such that they saturated at the same rate as in the previous model, after a few trials. Figure 8A shows details of LFP evolution during first five trials. As in the previous models (Figure 3A), the network responded with almost no oscillations during the first trial but began to display strong oscillatory responses after the first few stimulus presentations. The main difference in LFP spectral content was a reduction in the initial (onset) response in the new model, explained by the initially lower synaptic weights between PNs. The number of stimulus-elicited PN spikes decreased during first few trials in the full plasticity model and for trial 1 was similar to that in the model with GABAA plasticity only (compare Figures 3B and 8B). However, asymptotic behavior in the model with full plasticity was the same as for the model with GABAA and GABAB plasticity. This suggests that excitatory and slow inhibitory couplings can balance each other with respect to PN spike count during early trials. LFP oscillatory power increased noticeably within the first three trials (see Figure 8B, inset).
Figure 8. Plasticity of Excitatory Synapses and Reliability of PN Responses.
(A) Evolution of the AL responses over repeated stimulus presentations in the network with both excitatory and inhibitory synapses possesses plasticity. Note reduced onset response during first trial (i.e., relative to Figure 5A).
(B) The number of odor-elicited action potentials in PNs as a function of trial number. (Inset) LFP power spectra calculated for the first three trials.
(C) Intertrial difference plots; both PN and LN inputs contain noise. Plasticity greatly reduced trial-to-trial response variability [ANOVA: Fmodel(1,6479) = 254.73; p < 0.00001].
The average difference between phases of PN spikes in consecutive trials is shown in Figure 7C (left), and the average STD of PN spikes counted in 10 ms bins for ten trials is presented in Figure 7C (right). Figure 8C presents the same phase analysis as shown in Figure 6, but with noise included in both PN and LN inputs. It shows that trial-to-trial PN spiking was much more reliable in the full plasticity model compared to the model with inhibitory plasticity only. The responses in these experiments with noise added to the input of both LNs and PNs were at least as reliable as in simulations in which only LN input included noise (compare Figure 7C with Figures 7A and 7B, left). All these results indicate strongly enhanced reliability with all synapses undergoing activity-dependent facilitation for stimuli with random noise.
Discussion
Because of medium turbulence and olfactory behaviors, odor stimuli often reach olfactory receptors as brief, intermittent pulses. Intracellular and LFP recordings in the locust AL have revealed stimulus-dependent changes in PN and LN response patterns over repeated odor presentations (Stopfer and Laurent, 1999). When a novel stimulus was presented, the PN ensemble responded with intense and nonsynchronized bursts of spikes. After four to six presentations, however, PN response intensity decreased, while spike time precision increased, and coherent network oscillations emerged. Training with one odor did not affect the AL response for a different odor, suggesting that the modification during training was stimulus specific.
Here we used computer simulations to test two hypotheses: (1) that a specific form of synaptic plasticity in the AL provides a mechanism for activity-dependent changes of the AL responses in locust; and (2) that these modifications might serve to improve encoding reliability for repeatedly encountered stimuli. Facilitation of activated fast GABAergic synapses between LNs and PNs in the AL network was sufficient to explain the appearance of PN oscillatory synchronization after the first three to four trials. To account for the experimentally observed decrease in PN spike count during the first few trials, we found that facilitation of the slow inhibitory synapses had to be implemented in the model. Synaptic weights changed mainly during the first three to four trials and completely stabilized after seven to eight trials. Importantly, only a fraction (about 40%) of synapses, those activated by the odorant, were modified following stimulation. Therefore, when the odor used for training was replaced with a different odor, a different set of synapses became active, and the network displayed its naive response again. This result is also in good agreement with experimental findings (Stopfer and Laurent, 1999).
In our model, plasticity took the form of facilitation of reciprocal connections among LNs and PNs. Could other forms of plasticity such as depression of excitatory or inhibitory synapses contribute as well? Our attempts to replicate experimental results using several such configurations were unsuccessful. This was expected, because the importance of the fast GABAergic connections within the AL for creating synchronized PN oscillations has been shown in several experimental (MacLeod et al., 1998; MacLeod and Laurent, 1996; Stopfer et al., 1997; Stopfer and Laurent, 1999) and modeling (Bazhenov et al., 2001a; Bazhenov et al., 2001b) studies. What cellular mechanism might underlie the facilitation we postulate? Short-term synaptic enhancement may have a timescale of minutes (Fisher et al., 1997; Zucker, 1989; Zucker, 1996), which matches the experimental observations (Stopfer and Laurent, 1999). Activation of Ca2+ conductances in AL neurons (or in other locust neurons [Laurent et al., 1993]) followed by increase in intracellular Ca2+ concentration could control these synaptic modifications.
It has been proposed that activity-dependent changes of the AL responses could be important for odor detection and recognition. An initially intense but asynchronous response could provide strong input to and response from the mushroom body (Perez-Orive et al., 2004) and lateral protocerebrum targets, thus underlying rapid detection of novel odorants; more precise PN responses to subsequent samplings would provide a finer characterization (Stopfer and Laurent, 1999). Here, we propose an additional function for fast learning in AL responses—resistance to noise with a resulting increase in the reliability of responses to repeatedly encountered odors. When the input to the AL contains noise (due either to stimulus fluctuations or to noise in the receptor array), a slightly different subset of PNs is activated at each trial with the same odor; therefore, the spatiotemporal patterns of PN activation will be somewhat different each time. We show here that input-specific plasticity within AL synaptic interconnections can substantially reduce the effects of noise, exploiting the fact that noise differs from one trial to the next and thus, each time, activates untrained (weak) synapses. Plasticity at inhibitory synapses only was sufficient to improve the reliability of PN responses against noisy input to LNs. To diminish the effect of noise present in PN inputs also, plasticity in excitatory synapses within the AL network was required as well. This additional plasticity had a small effect on the temporal evolution of AL response patterns during repetitive odor presentations but provided a greater increase in the reliability of PN responses for noisy input. Synaptic plasticity within the locust AL has yet to be characterized. Therefore, our work with realistic models including noise leads us to predict that both excitatory and inhibitory synapses undergo activity-dependent and input-specific facilitation.
In the locust AL, relatively high odor concentrations elicit stronger and more coherent oscillations (Stopfer et al., 2003). Our modeling study suggests that strong and synchronized oscillations in the AL induced by high-intensity stimulation might facilitate both excitatory and inhibitory synapses between LNs and PNs. If so, these changes could facilitate the generation of oscillations in the AL upon subsequent odor stimulation, thus potentially increasing AL response reliability for low concentrations of odors previously encountered at high concentrations. The same odor presented in higher concentrations activates larger sets of glomeruli (see, for example, Friedrich and Korsching, 1997; Sachse and Galizia, 2003; Spors and Grinvald, 2002; Wachowiak and Cohen, 2003; Wang et al., 2003). This suggests that training at a higher concentration of a particular odor will facilitate a larger set of synapses. When another, different stimulus is presented right after one that was applied at higher concentration during learning, we would expect to find an oscillatory response starting from the first trial. The outcome of these experiments will depend, however, on the extent of overlap between sets of intrinsic AL synapses involved in the AL responses for different odors and different odor concentrations.
Conclusion
Our study indicates that synaptic plasticity in the AL can fine tune and optimize network structure to increase the information content and reliability of odor representations for repeatedly encountered odors, as occurs in natural plumes. The absence of fast LN-mediated inhibition during presentations of novel odors prevents PNs from synchronizing but, at the same time, produces more intense bursts of spikes during the initial phase of the response, leading to potentially broader but less specific responses in the mushroom body. A buildup of fast inhibition enables AL oscillations, thus improving odor discrimination. Facilitation of both inhibition and excitation endows the network with a resistance to noise, insuring more reliable responses in the AL, and presumably, in downstream targets, to repeated odors.
Experimental Procedures
Electrophysiology
Locusts were prepared, and recordings were made, as previously described (Bazhenov et al., 2001a; Bazhenov et al., 2001b). Briefly, intact, adult locusts (Schistocerca americana) were restrained, and their brains were exposed within a bath of physiological saline. Odor puffs were delivered by olfactometer through a pipette (1 cm diameter, placed 2–3 cm in front of the animal’s antenna) and were quickly removed by a large vacuum funnel placed 5 cm behind the animal. Intracellular recordings were made using 0.5 M potassium acetate-filled sharp glass micropipettes (200 MΩ); LFP recordings were made using blunt, saline-filled glass micropipettes (tip, ~10 mm; 3–7 MΩ), and were later band-pass filtered (5–55 Hz) by a software algorithm (MatLab, the Mathworks).
Computational Model: Intrinsic Currents
Each PN and LN was modeled by a single compartment that included voltage- and Ca2+-dependent currents described by Hodg-kin-Huxley kinetics. These models were proposed earlier (Bazhenov et al., 2001a; Bazhenov et al., 2001b) and were modified for this study. The model of LNs included a transient Ca2+ current ICa (Laurent et al., 1993), a calcium-dependent potassium current IK(Ca) (Sloper and Powell, 1979), a fast potassium current (Traub and Miles, 1991), and a potassium leak current IKL = gKL(V − EK), thus producing profiles devoid of Na+ action potentials but capable of Ca2+-dependent active responses, as observed experimentally (Laurent and Davidowitz, 1994). Model PNs included a fast sodium current INa (Traub and Miles, 1991), a fast potassium current IK (Traub and Miles, 1991), a transient potassium A-current IA (Huguenard et al., 1991), and a potassium leak current IKL. Current kinetics were adjusted to 23°C. The intrinsic currents were described as follows Iintj = gj mMhN(V − Ej), where gj is a maximal conductance, Ej is reversal potential, and m(t) and h(t) are activation and inactivation variables. In most of the simulations, the maximal conductances and passive properties were Cm = 1.43 × 10⁻⁴ μF, gL = 0.0215 μS, EL = −50 mV, gKL = 0.0029 μS, gK = 1 μS, gCa = 0.29μS, gK(Ca) = 0.0358 μS for LNs and Cm = 1.43 × 10⁻⁴ μF, gL = 0.0215 μS, EL = −55 mV, gKL = 0.0057 μS, gNa = 7.15 μS, gK = 1.43 μS, gA = 1.43 μS for PNs. Many of these conductances were systematically varied in our study to find the limits of observed phenomena.
The ICa current used for LN had M = 2, N = 1, m∞ = 1/(1 + exp (−(V + 20)/6.5)), τm = 1.5, h∞ = 1/(1 + exp((V + 25)/12)), τh = 0.3exp ((V − 40)/13) + 0.002exp(−(V − 60)/29).
The IK(Ca) current used for LN had M = 1, N = 0, m∞ = [Ca]/([Ca] + 2), τm = 100/([Ca] + 2).
The IK current used for LN had M = 4, N = 0, m∞ = A/(A + B), τm = 4.65/(A + B), A = 0.02(−(35 + V)/(exp(−(35 + V)/5) − 1), B = 0.5exp(−(40 + V)/40).
The IA current used for PN had M = 4, N = 1, m∞ = 1/(1 + exp (−(V + 60)/8.5)), τm = (0.25/(exp((V + 35.8)/19.7) + exp(−(V + 79.7)/12.7)) + 0.09), h∞ = 1.0/(1 + exp((V + 78)/6)), τm = 0.25/(exp((V + 46.05)/5) + exp(−(V + 238.4)/37.45)) if V < −63 mV and τm = 4.81 if V > −63 mV.
INa and IK were modeled as in Traub (1982). For all cells, ENa = 50 mV, EK = −95 mV, ECa = 140 mV. For LN, intracellular Ca2+ dynamic was described by a simple first-order model: d[Ca]/dt = −A ICa − ([Ca] − [Ca]∞)/τ, where [Ca]∞ = 2.4 × 10⁻⁴ mM is the equilibrium intracellular Ca2+ concentration, A = 2.86 × 10⁻⁵ μM/(ms × μA) and τ = 150 ms.
Computational Model: Synaptic Currents
All synaptic inputs to each neuron (LN or PN) in the model can be classified as intrinsic (from other LNs and PNs) or extrinsic (from olfactory receptor cells) (see Figure 1). Extrinsic inputs were modeled as current injections as described in the next section. All intrinsic excitatory (presumably cholinergic) and fast inhibitory (presumably GABAergic) synaptic currents were calculated according to Isyn = gsyn [O] (V − Esyn), where gsyn is the maximal conductivity, [O](t) is the fraction of open channels, Esyn is the reversal potential. for cholinergic receptors, for GABAA receptors. Synaptic currents were modeled by first-order activation schemes (Destexhe et al., 1994): d[O]/dt = α(1 − [O])[T] − β[O]. For cholinergic synapses [T] = A H(t0 + tmax − t) H(t − t0) and for GABAergic synapses [T] = 1/(1 + exp(−(V(t) − V0)/σ)), where H(x) is the Heaviside (step-) function, t0 is the time instant of receptor activation, A = 0.5, tmax = 0.3 ms, V0 = −20 mV, and σ = 1.5. The rate constants, α and β, were α = 10 ms−1 and β = 0.2 ms−1 for GABAA synapses and α = 1 ms−1 and β = 0.2 ms−1 for cholinergic synapses.
The slow inhibitory synaptic current (presumptive metabotropic GABA-mediated; see MacLeod and Laurent, 1996) is given by equation Islow = gslow [G]4/([G]4 + K) (V − EK), d[R]/dt = r1 (1 − [R])[T] − r2 [R], d[G]/dt = r3 [R] − r4 [G], where [R] is the fraction of activated receptors, [G] is the concentration of G proteins, EK = −95 mV is potassium reversal potential. The rate constants were r1 = 1 mM−1ms−1, r2 = 0.0025 ms−1, r3 = 0.1 ms−1, r4 = 0.06 ms−1, and K = 100 μM4.
A simple phenomenological model was used to describe the facilitation of intrinsic excitatory (between PNs and from PNs to LNs) and inhibitory (between LNs and from LNs to PNs) synaptic connections (Abbott et al., 1997; Galarreta and Hestrin, 1998; Timofeev et al., 2000; Tsodyks and Markram, 1997). Accordingly, the maximal synaptic conductance was multiplied by a facilitation variable, F = 1 + (Fi + dF − 1.0) exp(−(t − ti)/τ), where dF = 0.025 for cholinergic synapses, dF = 0.15 for GABAA synapses, dF = 0.005 for slow inhibitory synapses, τ = 10 is the time constant of recovery, Fi is the value of F immediately before the ith event, and (t − ti) is the time after ith event. Initial values of the peak synaptic conductances per cell were gGABA = 0.02 μS, gslow = 0.2 μS, gnACh = 0.1 μS. To compare responses in networks with and without facilitation, the initial peak values in the absence of facilitation were set to approximately the same level that is reached after training: gGABA = 0.11 μS, gslow = 0.4 μS, gnACh = 0.3 μS. The strength of individual synapses in the network was calculated at a peak conductance per cell divided by the number of synapses per cell.
Network Geometry and Stimulation
The AL model consisted of 90 PNs and 30 LNs (see Figure 1). All intrinsic interconnections (LN-LN, LN→PN, PN→LN, PN-PN) were random with 0.5 probabilities and were modeled as described in the previous section. In all simulations, small-amplitude current in the form of Gaussian noise (σ = 10%) was introduced to each cell to achieve random and independent membrane potential fluctuations. To simulate external inputs (odor stimulation), 33% of the LNs and PNs, randomly selected, were activated by current pulses that had a rise time constant of 100 ms and a decay time constant of 200 ms. The current used for each pulse was calculated as the total synaptic current produced by N Poisson distributed spike trains (each with average spike rate μ) arriving at N-independent excitatory synapses. Each glomerulus in the locust AL is thought to receive between 100 and 200 axons from olfactory receptor neurons (Laurent, 1996). In our simulations, N was set to 200, and μ was set to 100 Hz to match the membrane potential fluctuations recorded in postsynaptic PNs in vivo (see, for example, Figure 2 in Wehr and Laurent, 1999). In some experiments, to model noisy stimuli, 3% of LNs, and in some cases, PNs, selected randomly every 50 ms, were activated during each stimulus presentation, in addition to the set of neurons representing a “pure” stimulus. In all simulations, “noise” was included in all trials.
Acknowledgments
Supported by grants from NIDCD (M.B. and G.L.) and NSF (G.L.), and an NICHD intramural award (M.S.).
References
- Abbott LF, Varela JA, Sen K, Nelson SB. Synaptic depression and cortical gain control. Science. 1997;275:220–224. doi: 10.1126/science.275.5297.221. [DOI] [PubMed] [Google Scholar]
- Bazhenov M, Stopfer M, Rabinovich M, Abarbanel HD, Sejnowski TJ, Laurent G. Model of cellular and network mechanisms for odor-evoked temporal patterning in the locust antennal lobe. Neuron. 2001a;30:569–581. doi: 10.1016/s0896-6273(01)00286-0. [DOI] [PMC free article] [PubMed] [Google Scholar]
- Bazhenov M, Stopfer M, Rabinovich M, Huerta R, Abarbanel HD, Sejnowski TJ, Laurent G. Model of transient oscillatory synchronization in the locust antennal lobe. Neuron. 2001b;30:553–567. doi: 10.1016/s0896-6273(01)00284-7. [DOI] [PMC free article] [PubMed] [Google Scholar]
- Destexhe A, Mainen ZF, Sejnowski TJ. Synthesis of models for excitable membranes, synaptic transmission and neuro-modulation using a common kinetic formalism. J Comput Neurosci. 1994;1:195–230. doi: 10.1007/BF00961734. [DOI] [PubMed] [Google Scholar]
- Fisher SA, Fischer TM, Carew TJ. Multiple overlapping processes underlying short-term synaptic enhancement. Trends Neurosci. 1997;20:170–177. doi: 10.1016/s0166-2236(96)01001-6. [DOI] [PubMed] [Google Scholar]
- Friedrich RW, Korsching SI. Combinatorial and chemotopic odorant coding in the zebrafish olfactory bulb visualized by optical imaging. Neuron. 1997;18:737–752. doi: 10.1016/s0896-6273(00)80314-1. [DOI] [PubMed] [Google Scholar]
- Friedrich RW, Laurent G. Dynamic optimization of odor representations by slow temporal patterning of mitral cell activity. Science. 2001;291:889–894. doi: 10.1126/science.291.5505.889. [DOI] [PubMed] [Google Scholar]
- Friedrich RW, Habermann CJ, Laurent G. Multiplexing using synchrony in the zebrafish olfactory bulb. Nat Neurosci. 2004;7:862–871. doi: 10.1038/nn1292. [DOI] [PubMed] [Google Scholar]
- Galarreta M, Hestrin S. Frequency-dependent synaptic depression and the balance of excitation and inhibition in the neocortex. Nat Neurosci. 1998;1:587–594. doi: 10.1038/2822. [DOI] [PubMed] [Google Scholar]
- Gray CM, Skinner JE. Centrifugal regulation of neuronal activity in the olfactory bulb of the waking rabbit as revealed by reversible cryogenic blockade. Exp Brain Res. 1988;69:378–386. doi: 10.1007/BF00247583. [DOI] [PubMed] [Google Scholar]
- Hosler JS, Buxton KL, Smith BH. Impairment of olfactory discrimination by blockade of GABA and nitric oxide activity in the honey bee antennal lobes. Behav Neurosci. 2000;114:514–525. doi: 10.1037/0735-7044.114.3.514. [DOI] [PubMed] [Google Scholar]
- Huguenard JR, Coulter DA, Prince DA. A fast transient potassium current in thalamic relay neurons: kinetics of activation and inactivation. J Neurophysiol. 1991;66:1304–1315. doi: 10.1152/jn.1991.66.4.1304. [DOI] [PubMed] [Google Scholar]
- Laurent G. Dynamical representation of odors by oscillating and evolving neural assemblies. Trends Neurosci. 1996;19:489–496. doi: 10.1016/S0166-2236(96)10054-0. [DOI] [PubMed] [Google Scholar]
- Laurent G, Davidowitz H. Encoding of olfactory information with oscillating neural assemblies. Science. 1994;265:1872–1875. doi: 10.1126/science.265.5180.1872. [DOI] [PubMed] [Google Scholar]
- Laurent G, Seymour-Laurent KJ, Johnson K. Dendritic excitability and a voltage-gated calcium current in locust non-spiking local interneurons. J Neurophysiol. 1993;69:1484–1498. doi: 10.1152/jn.1993.69.5.1484. [DOI] [PubMed] [Google Scholar]
- MacLeod K, Laurent G. Distinct mechanisms for synchronization and temporal patterning of odor-encoding neural assemblies. Science. 1996;274:976–979. doi: 10.1126/science.274.5289.976. [DOI] [PubMed] [Google Scholar]
- MacLeod K, Backer A, Laurent G. Who reads temporal information contained across synchronized and oscillatory spike trains? Nature. 1998;395:693–698. doi: 10.1038/27201. [DOI] [PubMed] [Google Scholar]
- Mellon D. Physiological characterization of antennular flicking reflexes in the crayfish. J Comp Physiol [A] 1997;180:553–565. [Google Scholar]
- Murlis J, Elkington JS, Carde RT. Odor plumes and how insects use them. Annu Rev Entomol. 1992;37:505–532. [Google Scholar]
- Perez-Orive J, Mazor O, Turner GC, Cassenaer S, Wilson RI, Laurent G. Oscillations and sparsening of odor representations in the mushroom body. Science. 2002;297:359–365. doi: 10.1126/science.1070502. [DOI] [PubMed] [Google Scholar]
- Perez-Orive J, Bazhenov M, Laurent G. Intrinsic and circuit properties favor coincidence detection for decoding oscillatory input. J Neurosci. 2004;24:6037–6047. doi: 10.1523/JNEUROSCI.1084-04.2004. [DOI] [PMC free article] [PubMed] [Google Scholar]
- Sachse S, Galizia CG. The coding of odour-intensity in the honeybee antennal lobe: local computation optimizes odour representation. Eur J Neurosci. 2003;18:2119–2132. doi: 10.1046/j.1460-9568.2003.02931.x. [DOI] [PubMed] [Google Scholar]
- Sloper JJ, Powell TP. Ultrastructural features of the sensori-motor cortex of the primate. Philos Trans R Soc Lond B Biol Sci. 1979;285:124–139. [PubMed] [Google Scholar]
- Spors H, Grinvald A. Spatiotemporal dynamics of odor representations in the mammalian olfactory bulb. Neuron. 2002;34:301–315. doi: 10.1016/s0896-6273(02)00644-x. [DOI] [PubMed] [Google Scholar]
- Stopfer M, Laurent G. Short-term memory in olfactory network dynamics. Nature. 1999;402:664–668. doi: 10.1038/45244. [DOI] [PubMed] [Google Scholar]
- Stopfer M, Bhagavan S, Smith BH, Laurent G. Impaired odour discrimination on desynchronization of odour-encoding neural assemblies. Nature. 1997;390:70–74. doi: 10.1038/36335. [DOI] [PubMed] [Google Scholar]
- Stopfer M, Jayaraman V, Laurent G. Intensity versus identity coding in an olfactory system. Neuron. 2003;39:991–1004. doi: 10.1016/j.neuron.2003.08.011. [DOI] [PubMed] [Google Scholar]
- Teyke T, Gelperin A. Olfactory oscillations augment odor discrimination not odor identification by Limax CNS. Neuroreport. 1999;10:1061–1068. doi: 10.1097/00001756-199904060-00030. [DOI] [PubMed] [Google Scholar]
- Timofeev I, Grenier F, Bazhenov M, Sejnowski TJ, Steriade M. Origin of slow cortical oscillations in deafferented cortical slabs. Cereb Cortex. 2000;10:1185–1199. doi: 10.1093/cercor/10.12.1185. [DOI] [PubMed] [Google Scholar]
- Traub RD. Simulation of intrinsic bursting in CA3 hippocampal neurons. Neuroscience. 1982;7:1233–1242. doi: 10.1016/0306-4522(82)91130-7. [DOI] [PubMed] [Google Scholar]
- Traub RD, Miles R. Neuronal Networks of the Hippocampus. Cambridge: Cambridge University Press; 1991. [Google Scholar]
- Tsodyks MV, Markram H. The neural code between neocortical pyramidal neurons depends on neurotransmitter release probability. Proc Natl Acad Sci USA. 1997;94:719–723. doi: 10.1073/pnas.94.2.719. [DOI] [PMC free article] [PubMed] [Google Scholar]
- Vanderwolf CH, Zibrowski EM. Pyriform cortex beta-waves: odor-specific sensitization following repeated olfactory stimulation. Brain Res. 2001;892:301–308. doi: 10.1016/s0006-8993(00)03263-7. [DOI] [PubMed] [Google Scholar]
- Wachowiak M, Cohen LB. Correspondence between odorant-evoked patterns of receptor neuron input and intrinsic optical signals in the mouse olfactory bulb. J Neurophysiol. 2003;89:1623–1639. doi: 10.1152/jn.00747.2002. [DOI] [PubMed] [Google Scholar]
- Wang JW, Wong AM, Flores J, Vosshall LB, Axel R. Two-photon calcium imaging reveals an odor-evoked map of activity in the fly brain. Cell. 2003;112:271–282. doi: 10.1016/s0092-8674(03)00004-7. [DOI] [PubMed] [Google Scholar]
- Wehr M, Laurent G. Relationship between afferent and central temporal patterns in the locust olfactory system. J Neurosci. 1999;19:381–390. doi: 10.1523/JNEUROSCI.19-01-00381.1999. [DOI] [PMC free article] [PubMed] [Google Scholar]
- Zucker RS. Short-term synaptic plasticity. Annu Rev Neurosci. 1989;12:13–31. doi: 10.1146/annurev.ne.12.030189.000305. [DOI] [PubMed] [Google Scholar]
- Zucker RS. Exocytosis: a molecular and physiological perspective. Neuron. 1996;17:1049–1055. doi: 10.1016/s0896-6273(00)80238-x. [DOI] [PubMed] [Google Scholar]


