

Abstract
Splicing is regulated by complex interactions of numerous RNA-binding proteins. The molecular mechanisms involved remain elusive, in large part because of ignorance regarding the numbers of proteins in regulatory complexes. Polypyrimidine tract-binding protein (PTB), which regulates tissue-specific splicing, represses exon 3 of α-tropomyosin through distant pyrimidine-rich tracts in the flanking introns. Current models for repression involve either PTB-mediated looping or the propagation of complexes between tracts. To test these models, we used single-molecule approaches to count the number of bound PTB molecules both by counting the number of bleaching steps of GFP molecules linked to PTB within complexes and by analysing their total emissions. Both approaches showed that five or six PTB molecules assemble. Given the domain structures, this suggests that the molecules occupy primarily multiple overlapping potential sites in the polypyrimidine tracts, excluding propagation models. As an alternative to direct looping, we propose that repression involves a multistep process in which PTB binding forms small local loops, creating a platform for recruitment of other proteins that bring these loops into close proximity.
Keywords: alternative splicing, polypyrimidine tract-binding protein, repression, single molecule, stoichiometry
Introduction
The scale of alternative splicing is breathtaking. It has been estimated on the basis of high-throughput sequencing of mRNA that there are about 100 000 significant alternative splicing events in humans, derived from about 90% of the multiexon genes; this corresponds to an average of seven events per multiexon gene (Pan et al, 2008; Wang et al, 2008). The actual number of alternative isoforms of mRNA depends on the combinations produced by each gene, but the number could exceed a million. Despite such overwhelming numbers, it seems that alternative splicing is not the result of errors (Pan et al, 2008) and that the error rate of splicing is so low that any errors may be in large part the result of misincorporation during transcription (Fox-Walsh and Hertel, 2009).
Many, possibly most, alternative splicing events are represented more abundantly in particular tissues (Castle et al, 2008; Wang et al, 2008). The introns flanking tissue-specific exons are enriched in a number of sequence motifs, the most abundant of which contain UCUCU (Castle et al, 2008; Wang et al, 2008). This is recognized as a site, or partial site, for binding of polypyrimidine tract-binding protein (PTB) (Chan and Black, 1995, 1997). PTB was characterized as a PTB (Garcia-Blanco et al, 1989), and then identified as a possible repressor of a muscle-specific exon (Mulligan et al, 1992). Subsequently, it was shown to regulate the expression of a number of mRNA isoforms, particularly some specific to neural and muscle tissue (Grabowski and Black, 2001; Black and Grabowski, 2003; Boutz et al, 2007; Spellman et al, 2007; Venables et al, 2008). As the level of inclusion of exons with nearby intronic UCUCU motifs is inversely correlated among tissues with the abundance of PTB (Castle et al, 2008), repression by PTB seems to be a widespread and important contribution to tissue-specific gene expression. Indeed, genome-wide analysis of PTB–RNA association suggests that PTB is associated with transcripts from over 40% of annotated human genes (Xue et al, 2009).
PTB has four RNA-binding domains of the RRM type, with flexible linkers after domains 1 and 2 (Petoukhov et al, 2006). There are three isoforms of PTB, which differ in the length of the linker between RRMs 2 and 3. PTB4 has the longest linker and is the most effective repressor of Tpm1 exon 3 (Wollerton et al, 2001). The individual RRMs bind RNA with low affinity and weak specificity for short pyrimidine tracts (Oberstrass et al, 2005). Structural analyses of the individual RRMs and of RRMs 3 and 4 together suggest that the first three RRMs could bind a consecutive sequence of at least 15 nucleotides but that the fourth RRM would require linking sequences before binding to a short pyrimidine tract (Oberstrass et al, 2005; Lamichhane et al, 2010). In contrast, the occluded binding site size on poly(U) for the intact protein was estimated to be 5 nts (Perez et al, 1997). The protein was found by selection experiments to recognize a pyrimidine-rich consensus of 26 nts (Singh et al, 1995), although experiments with natural substrates identified shorter high-affinity motifs of UCUCUCU (Chan and Black, 1997) or UCUU (Perez et al, 1997). In the absence of other proteins, PTB binds to RNA with canonical motifs to form small complexes with nanomolar affinity, and then larger complexes non-cooperatively (Singh et al, 1995; Amir-Ahmady et al, 2005; Clerte and Hall, 2006). The numbers of PTB molecules in the larger complexes were hard to predict but seemed to correlate more with the overall length of the pyrimidine tract than with specific motifs. An analysis of genome-wide binding sites suggested that the level of pyrimidines remains elevated over tens of nucleotides around each site (Xue et al, 2009).
The mechanisms by which PTB association represses splicing are unclear. In several cases, pyrimidine-rich tracts are located on both sides of the regulated exon or splice site (Wagner and Garcia-Blanco, 2001; Amir-Ahmady et al, 2005). In the case of the neural exon of the Src gene, which is repressed in most tissues by the binding of PTB, two separate pyrimidine tracts on either side of the exon cooperate to form an ATP-resistant complex containing unknown numbers of proteins (Chou et al, 2000). The effect of this is to prevent the interaction of U1 snRNPs, bound to the 5′ splice site of the exon, with components at the downstream 3′ splice site (Sharma et al, 2005, 2008), but the nature of the impediment is unknown. Pyrimidine tracts are found on both sides of the alternative exon 3 of α-tropomyosin (TPM1), but, compared with the Src gene, they are longer and the pattern of regulation is different. Exons 2 and 3 of TPM1 are mutually exclusive (Figure 1). Exon 3 is used in most tissues because it contains strong splicing signals (Mullen et al, 1991), and the switch to exon 2 in smooth muscle cells is primarily the result of repression of exon 3 through the pyrimidine-rich tracts in the flanking introns (Gooding et al, 1994; Perez et al, 1997). It is likely that the longer pyrimidine tracts (P3 and DY) are bound by PTB in all cells (Singh et al, 1995; Perez et al, 1997; Gooding et al, 1998), but that the strong splicing signals override this except in smooth muscle cells. When the branch site is weakened by mutations, exon 3 is strongly repressed in HeLa cells (Gooding et al, 2006) by the P3 and DY PTB-binding elements (CG and CWJS, unpublished data).
Figure 1.

Sequences implicated in alternative splicing of exons 2 and 3 of TPM1. (A) Diagram of the alternative splicing patterns of exons 2 and 3. The lower pattern is a default pattern, and the upper is predominant in smooth muscle. Exons (boxes) and introns are not to scale; numbers refer to lengths in nucleotides. Splicing of exon 2 to exon 3 is prevented because the branch site (circle) in intron 2 is too close to exon 2. (B) Diagram of the transcripts used in this work. TM1 (562 nts) contains all the elements around exon 3 demonstrated to be involved in the regulation of splicing: P3, 50 nt polypyrimidine tract providing binding sites for splicing factor U2AF65 and regulatory protein PTB; URE, upstream regulatory element of repeated UGC motifs; DUGC, repeated UGC motifs on the 3′ side of the exon; DY, polypyrimidine tract of 40 nts, also bound by PTB. TM2 contains mutations converting the three putative high-affinity UCUU motifs in P3 to UUUU, UUUU and CCUU; TM3 contains two deletions totalling 12 nts in the DY tract; TM4 combines these mutations; TM1 trunc is truncated as shown.
Although it is clear that PTB has a preference for binding to pyrimidine tracts, the connection between PTB binding and inhibition remains elusive. Two speculative models have dominated thinking, both of which have been invoked also to explain the activities of another repressor, hnRNP A1. One suggestion is that repressor molecules bound to sequences flanking the regulated sites associate in a complex, forcing the exon or site into a loop (Blanchette and Chabot, 1999; Chou et al, 2000; Eperon et al, 2000; Wagner and Garcia-Blanco, 2001; Nasim et al, 2002; Oberstrass et al, 2005; Spellman and Smith, 2006). However, direct evidence for this is lacking. Moreover, looping is not easily reconciled with evidence that some other exons are regulated by single-pyrimidine tracts (Shen et al, 2004; Izquierdo et al, 2005), and an alternative model is that extended complexes propagate along the RNA from the initial high-affinity site(s) (Eperon et al, 2000; Wagner and Garcia-Blanco, 2001; Zhu et al, 2001; Spellman and Smith, 2006). Given that estimates for the length of sequence bound or recognized by pure PTB vary so widely and that there is a strong concentration-dependent ability to form large complexes, it is impossible to infer the nature of the repressor complexes from the properties of the pure protein.
A critical factor in developing mechanistic models for any regulated splicing reactions will be the ability to determine the numbers of proteins bound to RNA in complexes formed under splicing conditions. However, there are no methods available for doing this, whether with purified complexes or crude extracts, because of the complexity of the reactions: pre-splicing complexes assemble in the presence of numerous competing RNA-binding proteins, many of which have low specificity and are likely to bind dynamically and sometimes cooperatively. Such complexity may make it difficult to establish general principles for regulation, because different sites may involve different configurations of bound proteins. Despite considerable progress in identifying regulatory proteins and their target sites, we are in the unhappy situation that we do not know the molecular mechanisms operating at even one site.
To address this critical limitation, we have developed single-molecule methods for analysing the stoichiometry of protein–RNA complexes formed in nuclear extracts. We show here that five or six molecules of PTB assemble around exon 3 of rat Tpm1 pre-mRNA, and we propose a model for the organization of the complex. This is the first report describing the measurement of the stoichiometry of proteins in complexes in nuclear extracts, and the method will be of widespread use in investigations of many aspects of gene expression.
Results
It has been shown previously that PTB binds to the pyrimidine-rich tracts flanking exon 3 and that these tracts are essential for repression (Gooding et al, 1994, 1998; Perez et al, 1997). To follow the binding of PTB to RNA among all the other proteins in nuclear extracts, GFP-labelled PTB (isoform 4) was expressed in HEK 293T cells and nuclear extracts were prepared. RNA transcripts corresponding to various portions of exon 3 and its flanking intron sequences (Figure 1) were transcribed from genomic fragments cloned in plasmid pGEM4Z (Gooding et al, 1998; Gromak et al, 2003a) cut with EcoRI or AccI (TM1 Trunc) and annealed to an oligoribonucleotide analogue complementary to the first nine nucleotides of the transcript that had been conjugated with a fluorescent label (Cy5) and biotin. Constructs TM2 and TM4 contain mutations in the three UCUU motifs in element P3 (Gromak et al, 2003a), and constructs TM3 and TM4 contained deletions of two short U-rich tracts in element DY (Gooding et al, 1998). The transcripts were incubated in the extracts under splicing conditions, and the complexes formed were captured from diluted reaction mixtures on streptavidin-treated silica slides. The signals from the GFP and Cy5 fluorophores were detected by total internal reflection fluorescence (TIRF) microscopy (Conibear and Bagshaw, 2000), separated with a beam splitter and acquired on two halves of an emCCD chip (Figure 2). Representative time courses of GFP fluorescence from single molecules of RNA are shown in Figure 3. The survival times of the fluorescence from single molecules were no shorter than those from GFP molecules deposited directly on the surface, indicating that fluorescence was terminated by bleaching rather than by dissociation from the complex.
Figure 2.

Representative image showing co-localization of RNA (red) and PTB protein (green). Nuclear extract containing GFP-PTB was incubated with TM1 RNA previously annealed to Cy5-labelled biotinylated oligonucleotide. The mixture was diluted and injected into a chamber on a prepared silica slide. Fluorescence from molecules attached to the surface was detected by TIRF. Images obtained in the Cy5 and GFP channels have been superimposed. White circles show co-localized Cy5 and GFP signals.
Figure 3.

Time recordings of GFP-PTB molecules. (A) Trace from GFP-PTB in nuclear extract in the absence of added RNA, showing the numbers of photons collected in frames of 300 ms versus time of observation. After about 23 s, the molecule bleached in a single step. (B) Trace from GFP-PTB co-localized with TM1 RNA. Five possible discrete steps are marked by lines. (C) As in (B), but in this case, discrete steps cannot be assigned.
Quantification of PTB molecules in each transcript complex by single-step photobleaching
Novel strategies were needed to quantify the numbers of GFP-PTB molecules associated with each transcript molecule. Unlike analyses done with membrane proteins (Leake et al, 2006; Ulbrich and Isacoff, 2007) or small organic fluorophores (Shu et al, 2007), counting the number of steps in which GFP molecules became progressively bleached was impracticable because the variations in amplitude between individual GFP molecules (see below) effectively masked the individual steps in many cases (compare Figures 3B and C). Selecting only those spots that produced clear steps would leave open the possibility of accidental bias. However, it was readily possible to distinguish complexes with only one GFP-PTB, which behaved like the individual GFP molecules seen in the absence of RNA (Figure 3A), from those containing more than one, which could be identified by the duration of the signal and the larger intensities (Figure 3C). This allowed us to count the numbers of complexes with one GFP-PTB and those with more than one. The total number of PTB molecules in the complexes could be calculated by assuming that (1) the total number of PTB molecules bound was constant and (2) the proportions of PTB and GFP-PTB followed a binomial distribution. The probability (p) that a molecule of PTB bound to RNA was GFP-PTB, rather than endogenous unlabelled PTB, was determined by cross-linking of protein in the extract to radioactive TM1 trunc RNA (Figure 4) and found to be about 0.45.
Figure 4.

Cross-linking of PTB and GFP-PTB in nuclear extracts. SDS–PAGE analysis of proteins labelled with 32P by cross-linking to radioactive RNA. The nuclear extract from 293T cells transfected with plasmid expressing GFP-PTB was the same as that used throughout this work. The other nuclear extracts were from untransfected HeLa and 293T cells, as shown. The TPM1 substrate was TM1 trunc; in lanes labelled C, the extracts were incubated with an adenovirus pre-mRNA used as a substrate for splicing in vitro.
The results from the analysis of about 1600 molecules (Table Ia) show that the fraction of RNA molecules associated with GFP-PTB bleaching in a single step rose from 18%, with the longest wild-type transcript, to 68% with the shortest. Table Ib shows the fraction of molecules expected to show single-step bleaching with p=0.45. The observed value of 18% for the wild-type transcript TM1 falls between the values expected for 5 or 6 molecules of PTB. Similarly, the complexes formed on TM2 and TM3 contain 4–5 molecules, those on TM4 contain 3–4 and those on TM1 trunc contain 2. The observation that removing the three high-affinity UCUU motifs from the P3 element (TM2) reduced the number of bound PTB molecules by only one was surprising and suggested that the common practice of predicting PTB-binding sites by high-affinity motifs is misleading.
Table 1a. Observed proportions of Cy5 (RNA) molecules in which associated GFP-PTB is bleached in a single step.
| Substrate | TM1 | TM2 | TM3 | TM4 | TM1 trunc |
|---|---|---|---|---|---|
| % Single step | 18 (26%) | 28 (36%) | 29 (39%) | 40 (47%) | 68 (71%) |
| No. measured | 472 | 288 | 319 | 342 | 159 |
| The fraction of GFP spots that co-localized with Cy5 spots and exhibited single step bleaching is shown for each substrate tested (% single step). The values in parentheses show the highest value for the fraction when ambiguous assignments are included (see Materials and methods). The total number of measurements with each RNA substrate is shown. | |||||
Table 1b. Proportions of molecules showing single step bleaching predicted with various values of n.
| Total number of PTB/RNA (b) | 6 | 5 | 4 | 3 | 2 | 1 |
|---|---|---|---|---|---|---|
| p=0.45 | 14 | 22 | 33 | 49 | 71 | 100 |
| Theoretical values for the fraction of spots exhibiting a single bleaching behaviour were calculated using a binomial distribution for the complexes formed by b bound PTB molecules with the fraction of PTB-GFP molecules equal to 0.45. The fraction of GFP spots exhibiting single bleaching in extract in the absence of any RNA substrate was >90%. | ||||||
Table II shows the fraction of labelled RNA molecules co-localized with GFP-PTB (Table II), which reflects the affinity of the interactions. The fractions were reduced progressively by mutations in either polypyrimidine tract (TM2 and TM3), both tracts (TM4) and by truncation of the RNA immediately downstream of P3 (TM1 trunc). These results provide an independent confirmation of the significance of the single-step photobleaching results in Table Ia.
Table 2. Efficiency of formation of the complexes for various substrates.
| TM1 | TM2 | TM3 | TM4 | TM1 trunc | Oligonucleotide | |
|---|---|---|---|---|---|---|
| No. Cy5 spots | 334 | 657 | 866 | 1344 | 824 | 1724 |
| % Associated with GFP-PTB | 66 | 47 | 52 | 32 | 23 | <5 |
| No. measured | 334 | 657 | 866 | 1344 | 824 | 1724 |
| The fraction of Cy5 spots that co-localized with GFP spots relative to the total number Cy5 spots detected within imaging area is shown for each substrate tested. | ||||||
Quantification of PTB molecules in each transcript complex by measurement of integrated intensities
Our second strategy involved counting the total number of detected photons (TNPs) from GFP in each complex before bleaching. For single GFP-PTB molecules, in the absence of RNA, the probability density function for the TNP fits a normal probability density function (Figure 5B). On this basis, a probability density function was calculated assuming that the TNP would be Gaussian for each GFP-PTB within a complex and that the number of complexes with i bound GFP-PTB molecules (i=1,2,3…b) would follow a binomial distribution, as above. The observed TNP for all molecules in each experiment was converted to a cumulative distribution and fitted by the corresponding cumulative distribution calculated from the function described above (Figure 5). The fitting procedure was done with various values of p, the probability that a PTB molecule bound to the RNA was GFP labelled. The best global fit was obtained with p close to 0.45 (Figure 5), suggesting that TM1 binds 5–6 molecules, TM2 and TM3 bind 4–5, TM4 binds 3–4 and TM1 trunc binds 1–2. These results are in good agreement with the results from the first method (Tables I and II), although the first strategy is more sensitive to the numbers of molecules in smaller complexes, and the second strategy is more sensitive to the numbers of molecules in the larger complexes.
Figure 5.

Cumulative distributions of total photon counts. (A) Observed cumulative distributions of the total photons collected for each RNA in nuclear extract. Numbers were normalized to the total number of spots analysed for each transcript, shown in Table Ia. The abscissa is in counts/pixel, that is, total counts over the 8 × 8 area per pixel. (B) The cumulative distribution for GFP-PTB in extract in the absence of added RNA, with a curve fitted assuming that each spot contained only one fluorescent protein molecule. Inset, plot of residuals. Abscissa as in (A). (C–G) Cumulative distributions for GFP-PTB bound to transcripts, with different fits fitted assuming that the total number of PTB molecules bound was as shown in the individual legends.
Together, our results show that five or six molecules of PTB are bound to the wild-type α-tropomyosin RNA. Even though these results were derived from non-muscle extracts, the complexes are likely to represent the repressed state of exon 3. Mutations that weaken the exon 3 branch site lead to high levels of exon 3 repression in HeLa cells (Gooding et al, 2006), which remains dependent on the P3 and DY PTB-binding elements (CG and CWJS, manuscript in preparation). As our transcripts do not contain the branch site, there would be no interference with formation of a repressed complex.
Fitting PTB to the polypyrimidine tracts
With the knowledge that only five or six molecules of PTB are bound to TM1, and that the first three RRM domains of each PTB molecule contact in total only about 15 nucleotides (Oberstrass et al, 2005), with additional binding by RRM4 elsewhere, our first conclusion is that we can exclude models in which PTB molecules occupy the RNA for 500 nucleotides continuously between the upstream and downstream sites. Instead, PTB must act directly through the discrete upstream and downstream regions that it recognizes directly.
As the assignment of high-affinity sites does not predict the number of PTB molecules bound, nor their sites of binding, we have combined the data in Table III with the sequence specificities derived for each domain from the structures (Oberstrass et al, 2005) to model PTB in the repressed complex, assuming that in nuclear extract competition with other proteins would tend to enforce binding only with optimal sites. We allowed the inter-domain separation to range from 1 to 6 nucleotides (based on an average inter-domain distance of 4.5 nm (Petoukhov et al, 2006). RRM4 has a low-binding specificity (YCN) and, because of the back-to-back packing of RRM3 and RRM4, it binds preferentially 15 or more nucleotides away from RRMs 1–3 (Oberstrass et al, 2005; Lamichhane et al, 2010). As there would be a YC sequence at a distance >15 nts from any possible site for RRMs 1–3, RRM4 binding does not provide a constraint and was not taken into account. Analysis of the entire sequence of TM1 showed that there were numerous overlapping candidate sites, almost entirely located within the known P3 and DY-binding elements (Figure 6A). The maximum number of proteins that could be accommodated simultaneously in P3 was three, although there are a number of possible arrangements (Figure 6B). To test whether up to three proteins could bind in practice, gel shift assays were done with TM1 trunc RNA and various proportions of recombinant N-terminally truncated PTB1 and full-length PTB4 proteins at a saturating total PTB concentration of 4 μM, in the absence of nuclear extract. The results confirm that this region could accommodate three PTB molecules (Figure 6C).
Table 3. Values of n, the number of PTB molecules per molecule of RNA, inferred from the best fits to cumulative distributions of total photon counts.
| Substrate | TM1 | TM2 | TM3 | TM4 | TM1 trunc |
|---|---|---|---|---|---|
| n | 5–6 | 4–5 | 4–5 | 3–4 | 2 |
| Results from Tables Ia and Ib and Figures 5C–G. | |||||
Figure 6.

Ways of accommodating five PTB molecules on TM1 pre-mRNA. (A) Possible binding sites for PTB monomers (domains 1–3), based on the sequence specificities inferred from the structures (Oberstrass et al, 2005). Each vertical line represents the first nucleotide in the potential binding site. The ordinate shows the number of potential binding sites that begin at the same nucleotide; such sites arise because of the range of values allowed for the distance between the motifs recognized by each domain. The abscissa shows the position in the regulatory region, with the P3 and DY elements and exon 3 delineated. (B) Possible arrangements for the binding of three molecules of PTB to the P3 element. Each horizontal line shows one possible arrangement. Coloured bars show the region bound by the three separate molecules in each arrangement. Identical arrangements arise on different horizontal lines when RRM2 is predicted to bind at different positions within a monomer but RRM domains 1 and 3 are at the same positions. The region marked ends at the last specific nucleotide recognized by domain 3 and does not include the two additional nucleotides bound by the domain (Oberstrass et al, 2005). (C) Gel shift analysis of PTB binding capacity of TM1 trunc RNA. The left-hand lane contained RNA only. The other lanes contained, from the left, RNA incubated with His-tagged PTB4 at 4, 3.5, 3, 2.5, 2, 1.5, 1, 0.5 and 0 μM, and sufficient His-tagged PTB1-N (containing a deletion of the N-terminal 54 amino acids) to maintain a total PTB concentration of 4 μM. Electrophoresis was done on a 4% polyacrylamide gel. Labels to the right of the image show our interpretation of the compositions of the bands. (D) Gel shift analysis of PTB binding capacity of mutant TM1 trunc RNA. The substrate is derived from TM2 and contains the mutations in the P3 element that change the three putative high-affinity UCUU motifs in P3 to UUUU, UUUU and CCUU and strongly reduce repression. The protein concentrations and conditions of electrophoresis are as in Figure 6C. (E) Possible arrangements for the binding of two PTB molecules to the DY element, labelled as in (B), in which both molecules are located at optimal sites. (F) Gel shift analysis of PTB binding capacity of RNA from the DY element. The transcript contains nucleotides 449–562, that is, all of the DY element shown in Figure 6E. The protein concentrations and conditions of electrophoresis are as in Figure 6C. Possible assignments are shown.
The correspondence between the binding we observed in nuclear extract and the structure-based predictions was underscored by the mutant TM2, in which mutations had altered all three of the UCUU sequence motifs previously believed to be the high-affinity binding sites in P3 (Perez et al, 1997). These mutations reduce repression of exon 3 in smooth muscle (Gromak et al, 2003b) and HeLa cells (CG and CWJS, manuscript in preparation). Our results in Tables I and III showed a reduction by one in the number of PTB molecules bound in nuclear extract, and the number of molecules predicted as described above to bind to P3 was also reduced by one. In contrast, gel shift assays showed that the mutations did not affect the binding of pure PTB to TM1 trunc (Figure 6D). This discrepancy in the gel shift assays is explained by the use of the very high concentrations of pure PTB and the high protein:RNA ratio used to measure stoichiometry by gel shifts, under which conditions and in the absence of competing or accessory nuclear proteins the protein may bind to suboptimal sites.
If three molecules of PTB are bound to element P3 in TM1, then only two or three could be bound to DY. The mutations in TM3 cause loss of only one PTB from DY. Predictions based on the domain structures, as above, suggest that up to two molecules could bind DY simultaneously at optimal-binding sites (Figure 6E), and that only one molecule would be able to bind this region in TM3. Gel shift assays of DY with recombinant PTB appeared to show two bands with the N-terminally truncated PTB1-N (Figure 6F), but up to three extra bands appeared as PTB4 was added. Moreover, the background was more prominent, suggesting that the complexes were less discrete or less stable than those on P3. One interpretation of this is that each molecule of DY RNA was bound by either two or three molecules of PTB. This might be explained by a suboptimal arrangement accommodating three molecules that is favoured when high concentrations of pure protein are used, as noted above for the occupancy of mutant P3 sequences. If this occurred to some extent in nuclear extracts, then the presence of complexes containing either two or three molecules of PTB in DY would account for the observation that all transcripts except TM1 trunc (which lacks DY) appear to be bound by either n or n+1 molecules of PTB.
We conclude that the use of single-molecule methods has enabled us to measure the numbers of proteins in a splicing repressor complex assembled in nuclear extracts on wild-type and mutant sequences. These measurements have allowed us to apply data from domain structures to identify probable sites of binding of the proteins and to test the ability of the model to accommodate the effects of the mutations.
Discussion
We have described here the first use of single-molecule methods to measure the number of molecules of a protein in a complex assembled in nuclear extract. This is essential information for any mechanistic models, but it has been entirely lacking in all earlier research into the regulation of pre-mRNA splicing and other steps in gene expression. The difficulty arises partly from the nature of the proteins involved and from the complexity of the reactions. Bioinformatic and selection approaches to identify sequence motifs that affect the selection or use of splice sites have produced so many motifs (Coulter et al, 1997; Liu et al, 1998; Schaal and Maniatis, 1999; Fairbrother et al, 2002; Wang et al, 2004, 2005, 2008; Zhang and Chasin, 2004; Han et al, 2005; Zhang et al, 2005, 2008; Castle et al, 2008) that about three quarters of all the nucleotides in an exon (Zhang et al, 2009) or a quarter of all possible hexamer motifs (Wang and Burge, 2008) are likely to affect splicing. This is borne out by experiments (Pagani et al, 2003; Singh et al, 2004). It is presumed that most of these sequences are recognized by proteins, but predicting which proteins bind where is not straightforward. Numerous proteins bind pre-mRNA (Gabut et al, 2008), but there are very few cases in which their target sequences are well defined. Even in cases where the properties have been studied extensively, the binding sites attributed to an important protein such as SF2/ASF depend on whether they are assayed with pure protein (Tacke and Manley, 1995), functional selection (Liu et al, 1998; Smith et al, 2006) or cross-linking in cells (Sanford et al, 2008) and in all cases they are diverse. It is likely, therefore, that the composition of pre-mRNP is the result of competition among proteins with overlapping binding preferences, each with a range of affinities for different sequences (Abdul-Manan and Williams, 1996) and sometimes able to bind cooperatively. Prediction is therefore difficult, experimental validation in bulk assays requires purification with all the artefacts that entails, and purified proteins will have opportunities that would be denied to them in the nucleus. However, the problem of pre-mRNP composition can be addressed by single-molecule methods.
We expected to be able to count the number of fluorescent proteins attached to the pre-mRNA by following bleaching steps (Figure 3). However, this proved impracticable and subjective for a high proportion of molecules due to the differences in amplitudes of emission from individual molecules. The presence of a significant fraction of unlabelled PTB in the extract was an advantage, because it allowed a large fraction of the complexes to form with only one GFP-PTB molecule, which can be identified readily. We assumed that the proportions of complexes containing various numbers of labelled and unlabelled PTB followed a binomial distribution. This approach was supported by the discovery that the proportions of complexes containing a single GFP-PTB increased as expected with increasing numbers of mutations in the substrates that compromised PTB binding (Table Ia). Moreover, there was an inverse relationship between this proportion and the proportion of RNA molecules associated with GFP-PTB, as predicted. In addition, we measured the TNPs from co-localized GFP-PTB/RNA spots until they bleached, which produced a modified Gaussian distribution (see Materials and methods). This produced results that were almost entirely consistent with the first method (Table III).
These approaches allowed the number of bound proteins to be determined, within errors due to uncertainties intrinsic to the splicing complex and TIRF microscopy. For instance, we modelled the distributions of complexes assuming that each molecule of each transcript type contained the same number of PTB molecules. This is partly supported by gel shift assays of TM1 in nuclear extract, which produce a single, well-defined band (Supplementary Figure S1), and by single-molecule studies with recombinant PTB that show that TM1 has 5–6 binding sites for PTB (Y Kafasla and DC, data not shown). Another source of uncertainty arose from the large variations of emission amplitudes. These may be the result of restricted movement of tethered complexes randomly oriented on the imaging surface, strong polarization of the evanescent field and the collection efficiency function of the objective. The close proximity of bound PTB molecules to each other (distances <10 nm) does not exclude homoFRET occurring between GFP molecules. The latter can modulate (in a non-linear manner) the overall intensities of GFP molecules and their life times (Luchowski et al, 2008). The fraction of complexes with single GFP-PTB molecules might be reduced by the slight tendency of eGFP to dimerize, although our results in the absence of RNA suggest that this affects <10% of the complexes. Nevertheless, we believe that these uncertainties are relatively small and our simple models give good approximations of the experimental data.
Knowing that TM1 contains five or six molecules of PTB, it became feasible to predict the binding sites on the substrate. Potential sites were mapped by combining the binding preferences of individual domains (Oberstrass et al, 2005) with estimates for the lengths of flexible linkers between them (Petoukhov et al, 2006). Interestingly, this approach revealed a multiplicity of arrangements that satisfied the conditions, but it was possible at most to fit only three optimally bound molecules on P3 and two on DY. The multiplicity of possible sites for the protein in P3 and DY and the multiplicity of arrangements possible for three domains within each site could contribute to a much higher apparent affinity for the first PTB molecule to bind. The lack of experimental evidence for binding to other candidate sequences in TM1 (at ∼340 and 410 nucleotides in Figure 6A) might be the result of weaker apparent binding, because the level of multiplicity is much reduced, as well as competition with other proteins. The first PTB molecule bound to P3 or DY might interfere with subsequent binding by additional molecules. However, PTB comprises flexibly linked domains that each recognize only two specific nucleotides (Oberstrass et al, 2005), and we suggest that this arrangement might permit relatively facile shuffling on pyrimidine tracts, thereby reducing the interference with binding of second and third molecules.
Our results provide important insights into the nature of the repressor complex. Figure 7A represents models in which repressor complexes use cooperative interactions to propagate along the RNA away from high-affinity sites (Wagner and Garcia-Blanco, 2001; Spellman and Smith, 2006). PTB does not itself show strong protein–protein interactions, but Raver1 contributes to repression of exon 3 (Gromak et al, 2003a) and could fulfil this function. It has four potential PTB-binding motifs that interact with the α-helical face of RRM2 (Rideau et al, 2006), and it was possible that it could facilitate the formation of extended complexes. However, the length of RNA bound by a single molecule of PTB is quite insufficient for five molecules to span over 500 nucleotides, and we consider that this model can be rejected for PTB.
Figure 7.

Models for the repression of exon 3 by PTB and associated proteins. (A) Propagation of extended complexes from high-affinity sites (Wagner and Garcia-Blanco, 2001; Spellman and Smith, 2006). The P3 and DY elements are shown as blue lines. Molecules of PTB are represented by ovals. (B) Looping formation between the P3 and DY elements, each bound by RRM domains 3 or 4 (Wagner and Garcia-Blanco, 2001; Oberstrass et al, 2005; Spellman and Smith, 2006). PTB is shown in black; each RRM domain is represented by an oval, RRMs 1, 2 and 3 connected by linkers and in contact with the RNA, and RRM4 in close contact with RRM3 through their α-helical surfaces. (C) Model based on our results. Left, five or six molecules of PTB are associated with the transcript; three are associated through domains 1–3 with P3 and two or three similarly with DY. RRM4 of each PTB molecule is proposed to contact a relatively close C-rich tract. Right, raver1 could interact with RRM2 of each PTB monomer, thereby stabilizing either the PTB assembly on each element or, as suggested by the arrow, between the elements. MBNL1 multimers might further contribute to repression by binding the UGC motifs in the loops formed by the PTB complex.
As both P3 and DY are essential for repression through binding of PTB, models have been suggested in which there are looping interactions between proteins bound to the two regions. Loops might repress splicing, as seen in the effects of secondary structures around exons in vitro (Solnick, 1985). RRM domains 3 and 4 of PTB associate back-to-back and bind the RNA in opposite orientations, with a preference for at least 15 nucleotides between them (Oberstrass et al, 2005; Lamichhane et al, 2010). A natural suggestion is therefore that the 450 nts between P3 and DY are placed in such a loop (Oberstrass et al, 2005; Spellman and Smith, 2006). It is difficult to predict the likelihood of collision between PTB attached to one strand with a second RNA sequence, because the binding of proteins to the sequences within the potential exon-containing loop will affect the flexibility of the RNA. However, we note that other interactions that might involve looping are restricted to a range of <300 nts (Lavigueur et al, 1993; Graveley et al, 1998), and it would be expected that shorter loops would be more likely to form.
As the only known requirements for loop formation by RRM4 are that the distance from RRM3 is 15 nts or more and the domain binds YC (Oberstrass et al, 2005; Lamichhane et al, 2010), it is not possible to predict with any confidence where RRM4 might bind. RRM4 is known to be essential for the repression of splicing but to make little or no contribution to the affinity of PTB (Liu et al, 2002). If the probability of binding by RRM4 is increased by proximity (beyond 15 nts) to RRM3 and by an abundance of cytosines, then it is possible that it binds heterogeneously to any of a number of C-rich tracts downstream of P3 and upstream of DY, forming small loops as shown in Figure 7C. Raver1 may interact with PTB proteins on each side of the exon or it may bridge the now-smaller distance across the exon. The small loops would contain the UGC-rich URE and DUGC elements. Muscleblind-like protein (MBNL) is known to bind these sequences and we have evidence that it contributes to repression of exon 3 (CG and CWJS, manuscript in preparation). MBNL binds structured regions (Warf and Berglund, 2007; Yuan et al, 2007), and it may be that one function of PTB is to facilitate re-structuring of the RNA. MBNL can self-associate and even form large rings (Yuan et al, 2007), and it would be a good candidate for stabilizing a loop that sequestered the 3′ and 5′ splice sites of the exon (Figure 7D). What we suggest, therefore, is that assembly proceeds in at least two stages, and that PTB association provides a platform for subsequent recruitment of Raver1 and/or MBNL or other regulatory proteins. It is now an important and practical objective to determine the numbers of molecules of Raver1 and MBNL in these complexes. We believe that the single-molecule approaches described here will prove to be of widespread use in revealing the stoichiometry of many other complexes involved in gene expression.
Materials and methods
Plasmids, oligonucleotides and extracts
The plasmids used for transcription and the mutant versions of Tpm1 were as described (Gooding et al, 1998; Gromak et al, 2003a). For transcription, plasmids were digested with either EcoRI (full-length RNAs) or AccI (TM1 trunc) and purified by phenol/chloroform extraction. Transcription was done with T7 RNA polymerase (Epicentre) in 40 mM Tris–HCl, pH 7.9, 20 mM MgCl2, 10 mM NaCl, 2 mM spermidine, 10 mM DTT and NTPs each at 4 mM, with incubation at 37°C for 4–5 h. Transcripts were purified by treatment with DNase1, phenol/chloroform extraction, separation on an S-300 MicroSpin column (GE Healthcare; for the full-length transcripts) and ethanol precipitation. The quality of the transcripts was checked by gel electrophoresis.
For tethering RNA to the surface, oligonucleotide Cy5-5′-TUGUCUCCCAU-3′-biotin was used (Eurogentec, Belgium) where the underlined bases are LNA analogues and the others are 2′-OMe analogues. The oligonucleotide was complementary to the first nine nucleotides of either pre-mRNA. It had been purified by gel electrophoresis, electroeluted, desalted and lyophilized.
Annealing was done with RNA and oligonucleotide both at 1 μM in 10 mM Hepes, pH 8.0, 100 mM NaCl by heating the mixture to 80°C for 5 min, cooling over 1.5 h to 50°C, and placing on ice for 1.5–2 h. The presence of any residual unannealed oligonucleotide (<10%) was checked by gel electrophoresis followed by imaging of Cy5 fluorescence on a PhosphorImager 9400 (Typhoon, GE Healthcare). Note that its presence has little effect on the data as <5% of the molecules co-localize with GFP-PTB (see Table II).
Nuclear extracts were prepared from transfected HEK293T cells as described (Lee et al, 1988). Western blots showed that the GFP-PTB comprised about 70% of the total PTB in the cells (data not shown). Cross-linking was done in nuclear extracts as described (Eperon et al, 2000), using RNA transcribed with [α-32P]UTP. For gel shift assays, transcripts were incubated with purified recombinant protein (Wollerton et al, 2001) and analysed as before (Gooding et al, 1998). Gel shift assays of TM1 RNA incubated in nuclear extract showed no evidence of gross heterogeneity in complex formation (Supplementary Figure S1).
Preparation of samples
Splicing complexes were assembled by incubating the annealed RNA at 50 nM under standard splicing conditions and then diluted with buffer A (10 mM Hepes, pH 7.5, 50 mM NaCl) to a final RNA concentration of about 3 pM. Samples were analysed using a flow chamber, as described (Conibear and Bagshaw, 2000). First, biotinylated BSA (Sigma) was diluted in a buffer A to 10 μg/ml and injected into the chamber, followed by rinsing in the same buffer A, injection of streptavidin (Pierce) diluted to 10 μg/ml, rinsing again, and flushing with the same buffer containing RNasin. 25 μl of diluted incubation mixture was then injected into flow chamber. When a sufficient number of fluorescent spots appeared on both halves of the emCCD chip, the chamber was flushed again with the same buffer.
Acquisition of data
Single molecules were detected by a custom-built prism-based total internal reflectance fluorescence microscope (Conibear and Bagshaw, 2000). Excitation was done with an argon ion laser at 488 nm, with an incident power at the prism of ∼100 W/cm2, and a HeNe laser at 633 nm with an incident power of ∼50 W/cm2. Fluorescence emission was collected by a 63x 1.2 N.A. Zeiss C-apochromat water immersion lens, split by a dichroic mirror (540DCLP, Omega) and projected onto two halves of the detector chip (iXon DV887 emCCD camera, Andor Technology, UK) through emission filters specific for eGFP and Cy5 chromophores (510DF23 and 670DF40, Omega, respectively) using a home-built beam splitter. The acquisition rate was 300 ms per time bin. Cy5 fluorescence was acquired until the molecules were bleached (about 15–30 frames) and then imaging was continued with 488 nm laser excitation for 300–400 frames. The camera conversion factor (counts/photon) was determined as described (Cherny et al, 2009). The spatial resolution of the microscope was ∼130 nm/pixel in the imaging plane.
For each time series, an accumulated image was calculated to identify co-localized spots. Usually >23% of Cy5 signals were co-localized with GFP signals. In the presence of oligonucleotide alone, the fraction of co-localized Cy5 spots was <5%. Time series intensities were analysed for co-localized spots using an area of 8 × 8 pixels, as the average apparent width (FWHM of a Gaussian fit) of the spots was 2.6–2.8 pixels. Spots that deviated significantly from a Gaussian fit were not counted (<5%).
Analysis of bleaching steps
More than 90% of the signals from individual GFP-PTB molecules in the absence of exogenous RNA showed a single-bleaching step. The duration of emission varied significantly in the range 2–30 s with the mean of about 10 s. Emissions from GFP-PTB associated with Cy5-labelled RNA showed a noticeably longer duration, with a dramatic increase in the number of apparent bleaching steps but a reduction in their resolution. Emissions from a fraction of these GFP-PTB molecules exhibited single-bleaching behaviour similar to that observed in the absence of RNA. Assuming that the number of bound PTB molecules, b, is constant but specific for each RNA tested and taking into account that complexes formed with unlabelled PTB only are not detectable, the fraction of complexes with only one bound GFP-PTB molecule, Pb,exp1, can be calculated using a binomial distribution,
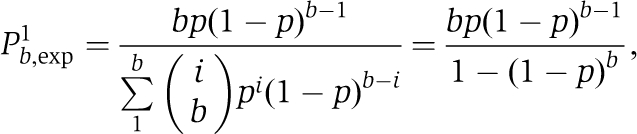 |
where p is the probability that bound PTB is GFP labelled (p is close to 0.5). Calculating the fraction of the complexes exhibiting a singular bleaching behaviour allows b to be estimated for each type of complex.
There are possibly several uncertainties in b. One of them is partial GFP bleaching at the beginning of the experiment (<10%). From the above formula it follows that
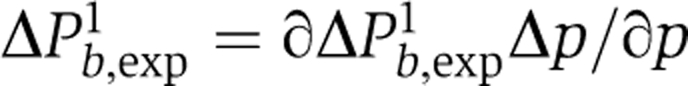 |
and therefore ∣ΔPb,exp1∣ is in the range 0.04–0.06 when P is close to 0.5 and b=2–6. The latter can be translated into an error of b using
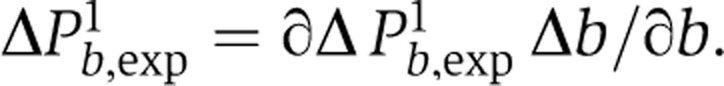 |
. This means b can be underestimated due to partial GFP bleaching by ∼0.6 for b=5, ∼0.45 for b=4, ∼0.3 for b=3 and ∼0.15 for b=2. Another source of errors is the large variation of intensities and/or duration of the emission for individual GFP molecules (see below), obscuring the detection of complexes exhibiting a single-step bleaching. These uncertainties (given in Table Ia) lead to similar errors in the estimation of b as above but with the opposite sign.
Analysis of the TNPs
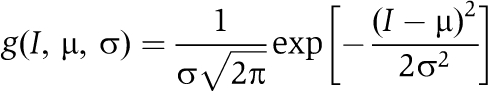
The majority of the signals (>90%) from individual GFP-PTB molecules in the absence of exogenous RNA showed a single-bleaching step behaviour characteristic to single molecules, albeit with a wide range of amplitudes from 50 to 250 photons per time bin with large variance. Emissions from GFP-PTB associated with Cy5-labelled RNA showed a much larger amplitude and variance indicative of several GFP-PTB molecules within each complex. To calculate the TNPs, the intensities for each time trace were corrected for the background signal. The latter was calculated as the mean from the same area after total bleaching of GFP. If there was no apparent bleaching before the end of the acquisition, juxtaposed 8 × 8 areas were used for background calculation. In the absence of RNA, the distribution of TNP has a Gaussian-like shape spanning the region from ∼200 to 10 000 photons, with a maximum around ∼1200 photons (Supplementary Figure S2), whereas in the presence of TM1 substrate RNA, the distribution is much broader with an apparent maximum around ∼3500 photons. To gain insight into this distribution, we applied the Kolmogorov–Smirnov (KS) statistic, which is superior for small sample sizes (Lilliefors, 1967). We note that the small fraction of the molecules (<10%) that did not exhibit single-bleach behaviour was excluded from the analysis. Briefly, we took the range of intensities from 0 to 10 000 photons, divided it into with 2000 steps and binned the data accordingly. Normalization by N, the number of measured GFP spots, yielded a discrete density function, e(i), i=1, m (m=2000 in our case). Such a distribution density is related to a Gaussian p.d.f. of the variable I, with μ and variance, σ2:
 |
The cumulative distribution of the experimental data,
 |
, was fit by the cumulative distribution of the function g(I, μ, σ):
 |
The best fit, varying μ and σ, was obtained by minimizing the KS statistic:
The D value was found (using Mathematica 5 and Global Optimization module) to be ∼0.70, which is below the 0.20 significance level (D0.20=0.736; Lilliefors, 1967), implying that the experimental distribution of TNP can be adhered to a normal probability density function. The distribution of TNP did not depend on the intensity of the 488 nm laser in the range from 20 to 50 mW. We note that our aim was to define a model describing the distribution of TNP rather than absolute values for the mean and variance.
Cumulative distributions were built similarly for the data from each experiment with TM RNA. Using the above assumptions, that is (1) the number of bound PTB molecules, b, is constant (b>1) but specific for each RNA, (2) the fraction of complexes with 0, 1, 2…,b PTB-GFP molecules follows a binomial law, (3) the complexes lacking PTB-GFP molecules are not detectable and (4) PTB and GFP-PTB exhibit similar affinity for the specific sites, the corrected fraction for the complexes with i (i=1, 2,…b) PTB-GFP molecules is equal to
 |
Assuming that each GFP-PTB molecule in a complex would behave likewise, the p.d.f. for the complexes with i bound PTB-GFP molecules will be:
The p.d.f. for the population of complexes containing b bound PTB molecules would be:
 |
The cumulative distribution of GFP(I, μ, σ, b) would be:
 |
Individual fits for each RNA substrate were optimized first by varying μ, σ and b with p around 0.45 to estimate b. It became clear that b corresponds to 5–6 for TM1, 4–5 for TM2 and TM3, 3–4 for TM4 and ∼2 for truncated TM1 RNA. The combination 5, 4, 4, 3 and 2 for TM1, TM2, TM3, TM4 and TM1 trunc RNA, respectively, is fitted better by slightly higher values of p (e.g. 0.47, as shown in Figures 5C–G), whereas the combination 6, 5, 5, 4 and 2 is fitted better by slightly lower values, such as 0.42. As every experimental cumulative distribution exhibits small deviations from the expected distribution, seen as a deficiency at the smaller numbers of TNP and overpopulation for the middle values, the expected distributions with the values of b that fit most closely for each substrate with the same values for μ, σ and p are shown in Figure 5C–G). We note that the assumption about homogeneity of the complexes, that is b is constant for each substrate, is not very stringent. Simple calculations show that heterogeneity of the complexes, that is the presence of complexes containing −1 or +1 bound PTB molecules of up to 20–30%, will effectively lead to the cumulative distributions within the indicated boundaries. The TNP distribution can also be analysed by a novel method using an exponential approximation for the data beyond the maximum (DC, unpublished results). This gives similar results.
Prediction of sites and arrangements of binding
The binding preferences for RRM domains 1–4 of PTB were inferred from NMR structures to be YCU, CU(N)N, YCUNN and YCN, respectively (Oberstrass et al, 2005). On the basis of an average inter-domain distance of 4.5 nm for domains 1, 2 and 3 (Petoukhov et al, 2006), we constrained their separation to be 1–6 nucleotides. RRM4 was omitted because there is no clear distance constraint (Oberstrass et al, 2005; Lamichhane et al, 2010). Thus, an optimal-binding site was taken to be YCUN(1–6)CUN(3–8)YCU, where N is any nucleotide. The total number of configurations is 144, which is the product of the variable lengths of the spacers and the two pyrimidines (Y). An array of 22 bases was defined in C++ and all allowed configurations were generated, which were then compared with the RNA sequence at every position. Each nucleotide position matching the optimal site was given a value of 1, and the sum of these taken as a score, the maximum score possible being 8. Alignments were ranked according to their score. The figures show positions that scored the maximum. For determining whether two or three PTB molecules would fit on a sequence, an initial array was scored and those showing a perfect match held while a second array was scored and so on. In this case, gaps of at least three bases between adjacent arrays were required. Configurations scoring the maximum possible (24) were plotted.
Supplementary Material
Acknowledgments
We thank Y Kafasla (Cambridge) for the purified PTB1-N protein used in Figure 6. This work was supported by the BBSRC (project grant BBS/B/0367X, ICE and CRB), the Wellcome Trust (programme grant 077877, CWJS), a Wellcome Trust VIP award (DC) and by the EC grant EURASNET-LSHG-CT-2005-518238 (European Network of Excellence in Alternative Splicing; CWJS and ICE).
Footnotes
The authors declare that they have no conflict of interest.
References
- Abdul-Manan N, Williams KR (1996) hnRNP A1 binds promiscuously to oligoribonucleotides: utilization of random and homo-oligonucleotides to discriminate sequence from base-specific binding. Nucleic Acids Res 24: 4063–4070 [DOI] [PMC free article] [PubMed] [Google Scholar]
- Amir-Ahmady B, Boutz PL, Markovtsov V, Phillips ML, Black DL (2005) Exon repression by polypyrimidine tract binding protein. RNA 11: 699–716 [DOI] [PMC free article] [PubMed] [Google Scholar]
- Black DL, Grabowski PJ (2003) Alternative pre-mRNA splicing and neuronal function. Prog Mol Subcell Biol 31: 187–216 [DOI] [PubMed] [Google Scholar]
- Blanchette M, Chabot B (1999) Modulation of exon skipping by high-affinity hnRNP A1-binding sites and by intron elements that repress splice site utilization. EMBO J 18: 1939–1952 [DOI] [PMC free article] [PubMed] [Google Scholar]
- Boutz PL, Stoilov P, Li Q, Lin CH, Chawla G, Ostrow K, Shiue L, Ares M Jr, Black DL (2007) A post-transcriptional regulatory switch in polypyrimidine tract-binding proteins reprograms alternative splicing in developing neurons. Genes Dev 21: 1636–1652 [DOI] [PMC free article] [PubMed] [Google Scholar]
- Castle JC, Zhang C, Shah JK, Kulkarni AV, Kalsotra A, Cooper TA, Johnson JM (2008) Expression of 24 426 human alternative splicing events and predicted cis regulation in 48 tissues and cell lines. Nat Genet 40: 1416–1425 [DOI] [PMC free article] [PubMed] [Google Scholar]
- Chan RC, Black DL (1995) Conserved intron elements repress splicing of a neuron-specific c-src xon in vitro. Mol Cell Biol 15: 6377–6385 [DOI] [PMC free article] [PubMed] [Google Scholar]
- Chan RC, Black DL (1997) The polypyrimidine tract binding protein binds upstream of neural cell-specific c-src exon N1 to repress the splicing of the intron downstream. Mol Cell Biol 17: 4667–4676 [DOI] [PMC free article] [PubMed] [Google Scholar]
- Cherny DI, Eperon IC, Bagshaw CR (2009) Probing complexes with single fluorophores: factors contributing to dispersion of FRET in DNA/RNA duplexes. Eur Biophys J 38: 395–405 [DOI] [PubMed] [Google Scholar]
- Chou MY, Underwood JG, Nikolic J, Luu MH, Black DL (2000) Multisite RNA binding and release of polypyrimidine tract binding protein during the regulation of c-src neural-specific splicing. Mol Cell 5: 949–957 [DOI] [PubMed] [Google Scholar]
- Clerte C, Hall KB (2006) Characterization of multimeric complexes formed by the human PTB1 protein on RNA. RNA 12: 457–475 [DOI] [PMC free article] [PubMed] [Google Scholar]
- Conibear PB, Bagshaw CR (2000) A comparison of optical geometries for combined flash photolysis and total internal reflection fluorescence microscopy. J Microsc 200: 218–229 [DOI] [PubMed] [Google Scholar]
- Coulter LR, Landree MA, Cooper TA (1997) Identification of a new class of exonic splicing enhancers by in vivo selection. Mol Cell Biol 17: 2143–2150 [DOI] [PMC free article] [PubMed] [Google Scholar]
- Eperon IC, Makarova OV, Mayeda A, Munroe SH, Caceres JF, Hayward DG, Krainer AR (2000) Selection of alternative 5′ splice sites: role of U1 snRNP and models for the antagonistic effects of SF2/ASF and hnRNP A1. Mol Cell Biol 20: 8303–8318 [DOI] [PMC free article] [PubMed] [Google Scholar]
- Fairbrother WG, Yeh RF, Sharp PA, Burge CB (2002) Predictive identification of exonic splicing enhancers in human genes. Science 297: 1007–1013 [DOI] [PubMed] [Google Scholar]
- Fox-Walsh KL, Hertel KJ (2009) Splice-site pairing is an intrinsically high fidelity process. Proc Natl Acad Sci USA 106: 1766–1771 [DOI] [PMC free article] [PubMed] [Google Scholar]
- Gabut M, Chaudhry S, Blencowe BJ (2008) SnapShot: the splicing regulatory machinery. Cell 133: 192.e1. [DOI] [PubMed] [Google Scholar]
- Garcia-Blanco MA, Jamison SF, Sharp PA (1989) Identification and purification of a 62 000-dalton protein that binds specifically to the polypyrimidine tract of introns. Genes Dev 3: 1874–1886 [DOI] [PubMed] [Google Scholar]
- Gooding C, Clark F, Wollerton MC, Grellscheid SN, Groom H, Smith CW (2006) A class of human exons with predicted distant branch points revealed by analysis of AG dinucleotide exclusion zones. Genome Biol 7: R1. [DOI] [PMC free article] [PubMed] [Google Scholar]
- Gooding C, Roberts GC, Moreau G, Nadal-Ginard B, Smith CW (1994) Smooth muscle-specific switching of alpha-tropomyosin mutually exclusive exon selection by specific inhibition of the strong default exon. EMBO J 13: 3861–3872 [DOI] [PMC free article] [PubMed] [Google Scholar]
- Gooding C, Roberts GC, Smith CW (1998) Role of an inhibitory pyrimidine element and polypyrimidine tract binding protein in repression of a regulated alpha-tropomyosin exon. RNA 4: 85–100 [PMC free article] [PubMed] [Google Scholar]
- Grabowski PJ, Black DL (2001) Alternative RNA splicing in the nervous system. Prog Neurobiol 65: 289–308 [DOI] [PubMed] [Google Scholar]
- Graveley BR, Hertel KJ, Maniatis T (1998) A systematic analysis of the factors that determine the strength of pre-mRNA splicing enhancers. EMBO J 17: 6747–6756 [DOI] [PMC free article] [PubMed] [Google Scholar]
- Gromak N, Matlin AJ, Cooper TA, Smith CW (2003a) Antagonistic regulation of alpha-actinin alternative splicing by CELF proteins and polypyrimidine tract binding protein. RNA 9: 443–456 [DOI] [PMC free article] [PubMed] [Google Scholar]
- Gromak N, Rideau A, Southby J, Scadden AD, Gooding C, Huttelmaier S, Singer RH, Smith CW (2003b) The PTB interacting protein raver1 regulates alpha-tropomyosin alternative splicing. EMBO J 22: 6356–6364 [DOI] [PMC free article] [PubMed] [Google Scholar]
- Han K, Yeo G, An P, Burge CB, Grabowski PJ (2005) A combinatorial code for splicing silencing: UAGG and GGGG motifs. PLoS Biol 3: e158. [DOI] [PMC free article] [PubMed] [Google Scholar]
- Izquierdo JM, Majos N, Bonnal S, Martinez C, Castelo R, Guigo R, Bilbao D, Valcarcel J (2005) Regulation of Fas alternative splicing by antagonistic effects of TIA-1 and PTB on exon definition. Mol Cell 19: 475–484 [DOI] [PubMed] [Google Scholar]
- Lamichhane R, Daubner GM, Thomas-Crusells J, Auweter SD, Manatschal C, Austin KS, Valniuk O, Allain FH, Rueda D (2010) RNA looping by PTB: evidence using FRET and NMR spectroscopy for a role in splicing repression. Proc Natl Acad Sci USA 107: 4105–4110 [DOI] [PMC free article] [PubMed] [Google Scholar]
- Lavigueur A, La Branche H, Kornblihtt AR, Chabot B (1993) A splicing enhancer in the human fibronectin alternate ED1 exon interacts with SR proteins and stimulates U2 snRNP binding. Genes Dev 7: 2405–2417 [DOI] [PubMed] [Google Scholar]
- Leake MC, Chandler JH, Wadhams GH, Bai F, Berry RM, Armitage JP (2006) Stoichiometry and turnover in single, functioning membrane protein complexes. Nature 443: 355–358 [DOI] [PubMed] [Google Scholar]
- Lee KA, Bindereif A, Green MR (1988) A small-scale procedure for preparation of nuclear extracts that support efficient transcription and pre-mRNA splicing. Gene Anal Tech 5: 22–31 [DOI] [PubMed] [Google Scholar]
- Lilliefors H (1967) On the Kolmogorov-Smirnov test for normality with mean and variance unknown. J Am Stat A 62: 399–402 [Google Scholar]
- Liu H, Zhang W, Reed RB, Liu W, Grabowski PJ (2002) Mutations in RRM4 uncouple the splicing repression and RNA-binding activities of polypyrimidine tract binding protein. RNA 8: 137–149 [DOI] [PMC free article] [PubMed] [Google Scholar]
- Liu HX, Zhang M, Krainer AR (1998) Identification of functional exonic splicing enhancer motifs recognized by individual SR proteins. Genes Dev 12: 1998–2012 [DOI] [PMC free article] [PubMed] [Google Scholar]
- Luchowski R, Matveeva EG, Gryczynski I, Terpetschnig EA, Patsenker L, Laczko G, Borejdo J, Gryczynski Z (2008) Single molecule studies of multiple-fluorophore labeled antibodies. Effect of homo-FRET on the number of photons available before photobleaching. Curr Pharm Biotechnol 9: 411–420 [DOI] [PMC free article] [PubMed] [Google Scholar]
- Mullen MP, Smith CW, Patton JG, Nadal-Ginard B (1991) Alpha-tropomyosin mutually exclusive exon selection: competition between branchpoint/polypyrimidine tracts determines default exon choice. Genes Dev 5: 642–655 [DOI] [PubMed] [Google Scholar]
- Mulligan GJ, Guo W, Wormsley S, Helfman DM (1992) Polypyrimidine tract binding protein interacts with sequences involved in alternative splicing of beta-tropomyosin pre-mRNA. J Biol Chem 267: 25480–25487 [PubMed] [Google Scholar]
- Nasim FU, Hutchison S, Cordeau M, Chabot B (2002) High-affinity hnRNP A1 binding sites and duplex-forming inverted repeats have similar effects on 5′ splice site selection in support of a common looping out and repression mechanism. RNA 8: 1078–1089 [DOI] [PMC free article] [PubMed] [Google Scholar]
- Oberstrass FC, Auweter SD, Erat M, Hargous Y, Henning A, Wenter P, Reymond L, Amir-Ahmady B, Pitsch S, Black DL, Allain FH (2005) Structure of PTB bound to RNA: specific binding and implications for splicing regulation. Science 309: 2054–2057 [DOI] [PubMed] [Google Scholar]
- Pagani F, Buratti E, Stuani C, Baralle FE (2003) Missense, nonsense, and neutral mutations define juxtaposed regulatory elements of splicing in cystic fibrosis transmembrane regulator exon 9. J Biol Chem 278: 26580–26588 [DOI] [PubMed] [Google Scholar]
- Pan Q, Shai O, Lee LJ, Frey BJ, Blencowe BJ (2008) Deep surveying of alternative splicing complexity in the human transcriptome by high-throughput sequencing. Nat Genet 40: 1413–1415 [DOI] [PubMed] [Google Scholar]
- Perez I, Lin CH, McAfee JG, Patton JG (1997) Mutation of PTB binding sites causes misregulation of alternative 3′ splice site selection in vivo. RNA 3: 764–778 [PMC free article] [PubMed] [Google Scholar]
- Petoukhov MV, Monie TP, Allain FH, Matthews S, Curry S, Svergun DI (2006) Conformation of polypyrimidine tract binding protein in solution. Structure 14: 1021–1027 [DOI] [PubMed] [Google Scholar]
- Rideau AP, Gooding C, Simpson PJ, Monie TP, Lorenz M, Huttelmaier S, Singer RH, Matthews S, Curry S, Smith CW (2006) A peptide motif in Raver1 mediates splicing repression by interaction with the PTB RRM2 domain. Nat Struct Mol Biol 13: 839–848 [DOI] [PubMed] [Google Scholar]
- Sanford JR, Coutinho P, Hackett JA, Wang X, Ranahan W, Caceres JF (2008) Identification of nuclear and cytoplasmic mRNA targets for the shuttling protein SF2/ASF. PLoS One 3: e3369. [DOI] [PMC free article] [PubMed] [Google Scholar]
- Schaal TD, Maniatis T (1999) Selection and characterization of pre-mRNA splicing enhancers: identification of novel SR protein-specific enhancer sequences. Mol Cell Biol 19: 1705–1719 [DOI] [PMC free article] [PubMed] [Google Scholar]
- Sharma S, Falick AM, Black DL (2005) Polypyrimidine tract binding protein blocks the 5′ splice site-dependent assembly of U2AF and the prespliceosomal E complex. Mol Cell 19: 485–496 [DOI] [PMC free article] [PubMed] [Google Scholar]
- Sharma S, Kohlstaedt LA, Damianov A, Rio DC, Black DL (2008) Polypyrimidine tract binding protein controls the transition from exon definition to an intron defined spliceosome. Nat Struct Mol Biol 15: 183–191 [DOI] [PMC free article] [PubMed] [Google Scholar]
- Shen H, Kan JL, Ghigna C, Biamonti G, Green MR (2004) A single polypyrimidine tract binding protein (PTB) binding site mediates splicing inhibition at mouse IgM exons M1 and M2. RNA 10: 787–794 [DOI] [PMC free article] [PubMed] [Google Scholar]
- Shu D, Zhang H, Jin J, Guo P (2007) Counting of six pRNAs of phi29 DNA-packaging motor with customized single-molecule dual-view system. EMBO J 26: 527–537 [DOI] [PMC free article] [PubMed] [Google Scholar]
- Singh NN, Androphy EJ, Singh RN (2004) In vivo selection reveals combinatorial controls that define a critical exon in the spinal muscular atrophy genes. RNA 10: 1291–1305 [DOI] [PMC free article] [PubMed] [Google Scholar]
- Singh R, Valcarcel J, Green MR (1995) Distinct binding specificities and functions of higher eukaryotic polypyrimidine tract-binding proteins. Science 268: 1173–1176 [DOI] [PubMed] [Google Scholar]
- Smith PJ, Zhang C, Wang J, Chew SL, Zhang MQ, Krainer AR (2006) An increased specificity score matrix for the prediction of SF2/ASF-specific exonic splicing enhancers. Hum Mol Genet 15: 2490–2508 [DOI] [PubMed] [Google Scholar]
- Solnick D (1985) Alternative splicing caused by RNA secondary structure. Cell 43: 667–676 [DOI] [PubMed] [Google Scholar]
- Spellman R, Llorian M, Smith CW (2007) Crossregulation and functional redundancy between the splicing regulator PTB and its paralogs nPTB and ROD1. Mol Cell 27: 420–434 [DOI] [PMC free article] [PubMed] [Google Scholar]
- Spellman R, Smith CW (2006) Novel modes of splicing repression by PTB. Trends Biochem Sci 31: 73–76 [DOI] [PubMed] [Google Scholar]
- Tacke R, Manley JL (1995) The human splicing factors ASF/SF2 and SC35 possess distinct, functionally significant RNA binding specificities. EMBO J 14: 3540–3551 [DOI] [PMC free article] [PubMed] [Google Scholar]
- Ulbrich MH, Isacoff EY (2007) Subunit counting in membrane-bound proteins. Nat Methods 4: 319–321 [DOI] [PMC free article] [PubMed] [Google Scholar]
- Venables JP, Koh CS, Froehlich U, Lapointe E, Couture S, Inkel L, Bramard A, Paquet ER, Watier V, Durand M, Lucier JF, Gervais-Bird J, Tremblay K, Prinos P, Klinck R, Elela SA, Chabot B (2008) Multiple and specific mRNA processing targets for the major human hnRNP proteins. Mol Cell Biol 28: 6033–6043 [DOI] [PMC free article] [PubMed] [Google Scholar]
- Wagner EJ, Garcia-Blanco MA (2001) Polypyrimidine tract binding protein antagonizes exon definition. Mol Cell Biol 21: 3281–3288 [DOI] [PMC free article] [PubMed] [Google Scholar]
- Wang ET, Sandberg R, Luo S, Khrebtukova I, Zhang L, Mayr C, Kingsmore SF, Schroth GP, Burge CB (2008) Alternative isoform regulation in human tissue transcriptomes. Nature 456: 470–476 [DOI] [PMC free article] [PubMed] [Google Scholar]
- Wang J, Smith PJ, Krainer AR, Zhang MQ (2005) Distribution of SR protein exonic splicing enhancer motifs in human protein-coding genes. Nucleic Acids Res 33: 5053–5062 [DOI] [PMC free article] [PubMed] [Google Scholar]
- Wang Z, Burge CB (2008) Splicing regulation: from a parts list of regulatory elements to an integrated splicing code. RNA 14: 802–813 [DOI] [PMC free article] [PubMed] [Google Scholar]
- Wang Z, Rolish ME, Yeo G, Tung V, Mawson M, Burge CB (2004) Systematic identification and analysis of exonic splicing silencers. Cell 119: 831–845 [DOI] [PubMed] [Google Scholar]
- Warf MB, Berglund JA (2007) MBNL binds similar RNA structures in the CUG repeats of myotonic dystrophy and its pre-mRNA substrate cardiac troponin T. RNA 13: 2238–2251 [DOI] [PMC free article] [PubMed] [Google Scholar]
- Wollerton MC, Gooding C, Robinson F, Brown EC, Jackson RJ, Smith CW (2001) Differential alternative splicing activity of isoforms of polypyrimidine tract binding protein (PTB). RNA 7: 819–832 [DOI] [PMC free article] [PubMed] [Google Scholar]
- Xue Y, Zhou Y, Wu T, Zhu T, Ji X, Kwon YS, Zhang C, Yeo G, Black DL, Sun H, Fu XD, Zhang Y (2009) Genome-wide analysis of PTB-RNA interactions reveals a strategy used by the general splicing repressor to modulate exon inclusion or skipping. Mol Cell 36: 996–1006 [DOI] [PMC free article] [PubMed] [Google Scholar]
- Yuan Y, Compton SA, Sobczak K, Stenberg MG, Thornton CA, Griffith JD, Swanson MS (2007) Muscleblind-like 1 interacts with RNA hairpins in splicing target and pathogenic RNAs. Nucleic Acids Res 35: 5474–5486 [DOI] [PMC free article] [PubMed] [Google Scholar]
- Zhang C, Li WH, Krainer AR, Zhang MQ (2008) RNA landscape of evolution for optimal exon and intron discrimination. Proc Natl Acad Sci USA 105: 5797–5802 [DOI] [PMC free article] [PubMed] [Google Scholar]
- Zhang XH, Arias MA, Ke S, Chasin LA (2009) Splicing of designer exons reveals unexpected complexity in pre-mRNA splicing. RNA 15: 367–376 [DOI] [PMC free article] [PubMed] [Google Scholar]
- Zhang XH, Chasin LA (2004) Computational definition of sequence motifs governing constitutive exon splicing. Genes Dev 18: 1241–1250 [DOI] [PMC free article] [PubMed] [Google Scholar]
- Zhang XH, Leslie CS, Chasin LA (2005) Dichotomous splicing signals in exon flanks. Genome Res 15: 768–779 [DOI] [PMC free article] [PubMed] [Google Scholar]
- Zhu J, Mayeda A, Krainer AR (2001) Exon identity established through differential antagonism between exonic splicing silencer-bound hnRNP A1 and enhancer-bound SR proteins. Mol Cell 8: 1351–1361 [DOI] [PubMed] [Google Scholar]
Associated Data
This section collects any data citations, data availability statements, or supplementary materials included in this article.