Abstract
We present a new approach to enhance mixing in T-type micromixers by introducing a constriction in the microchannel under periodic electro-osmotic flow. Two sinusoidal ac electric fields with 180° phase difference and similar dc bias are applied at the two inlets. The out of phase ac electric field induces oscillation of fluid interface at the junction of the two inlet channels and the constriction. Due to the constriction introduced at the junction, fluids from these two inlets form alternative plugs at the constricted channel. These plugs of fluids radiate downstream from the constriction into the large channel and form alternate thin crescent-shaped layers of fluids. These crescent-shaped layers of fluids increase tremendously the contact surface area between the two streams of fluid and thus enhance significantly the mixing efficiency. Experimental results and mixing mechanism analysis show that amplitude and frequency of the ac electric field and the length of the constriction govern the mixing efficiency.
INTRODUCTION
Laboratory-on-a-chip (LOC) or micrototal analysis system refers to miniaturized devices which can perform biomedical and∕or chemical analyses. LOC is the technology that integrates microfluidic system on a microscale chip and can be considered as the miniaturization of a laboratory to a small device. The so-called laboratory is created by means of mixers, reservoirs, pumps, valves, reactor, separator, and other components to manipulate buffer fluids or cells. Compared to a conventional laboratory test, LOC provides several advantages, including low consumption of reagents, less production of chemical waste, high throughput, rapid analysis, and a significant improvement in performance. These compact devices are portable and therefore allow samples to be analyzed on site, a rather impossible task for a conventional laboratory. These devices are normally cheap and disposable after use.
There are two common approaches to transport fluid in LOC devices, namely, pressure driven flow and electrokinetic flow. Either approach has its pros and cons. Electrokinetic flow or electro-osmosis involves the movement of fluids confined within microchannel walls under the application of an electric field. It is extensively employed in microfluidic devices for pumping and mixing. Electrokinetic flow is preferred in certain applications because of its pluglike flow profile, the ease of fabrication, and integration into other electrical devices.
Mixing of two or more fluids is one of the key operations for LOC devices where rapid mixing of reagent∕reactants is often required. However, owing to small channel dimensions and low flow rates, the Reynolds number for flows in microfluidic device is typically very small (below 100). Hence, mixing through turbulent flow induced by inertial∕viscous effects for aqueous solutions is not feasible in these miniaturized devices. Therefore, diffusion is the dominant mechanism in micromixing due to the absence of turbulence.
Various approaches have been developed to enhance mixing in microchannels. Cross stream flow circulation induced by asymmetric grooves at the channel floor1 with pressure driven flow or asymmetrical2∕symmetrical3 planar electrode with ac electro-osmosis has been found to improve mixing. Erickson and Li4 studied mixing enhancement by introducing oppositely charged surface heterogeneities at the microchannel walls to promote local flow circulation. Oddy et al.5 developed a micromixer based on electrokinetic instability (EKI) caused by high conductivity gradient between two fluids. Other approaches to enhance mixing include hydrodynamic focusing,6 placing of nonconductive,7 or conductive8 obstacles and two layers crossing channel flow.9
Applying a fluctuating driving force at the inlets of a mixer is a simple way to enhance mixing. Glasgow and Aubrey10 improved mixing in a T-mixer by applying sinusoidal pressure at the two inlets. Lin et al.11 presented a T-mixer with switching dc field to transport and mix the fluid samples. Luo et al.12 demonstrated numerically the combination of rectified ac and dc electric fields to induce a wavelike pattern at the interface of a T-mixer. Coleman et al.13 proposed sequential injection of two fluids by alternate switching of electric field with an expansion chamber to enhance mixing. Yan et al.14 enhanced mixing efficiency in T-mixers with pulsating electro-osmosis and pattern blocks. These active mixing methods with time periodic driving force generally require careful selection of driving frequency and oscillation amplitude for optimum mixing efficiency.15
We present here a new and simple method to improve micromixing through a constriction under periodic electro-osmotic flow. A constriction is introduced at the junction of a T-mixer. Two sinusoidal voltages which are out of phase by 180° with a dc bias are applied at the two inlets. The dc voltage is primarily to drive the fluid continuously from the inlets toward the outlet. The out of phase sinusoidal ac voltages cause the flow rate from the two inlets to vary and thus induce fluctuation of two-stream interface at the T-junction. This causes the formation of alternate plugs of fluids in the constriction. At the exit of the constriction, the plugs spread into thin crescent-shaped layers so as to facilitate diffusion process due to the tremendous increase in contact area between the two fluids. Factors governing the mixing efficiency, specifically the amplitude and frequency of the sinusoidal voltage are investigated and the mechanism involved for mixing enhancement are discussed in details.
DEVICES AND MATERIALS
Device fabrication
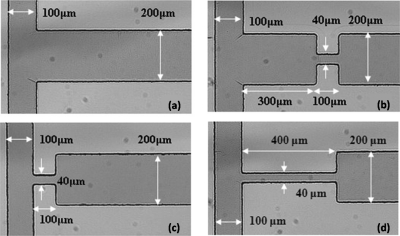
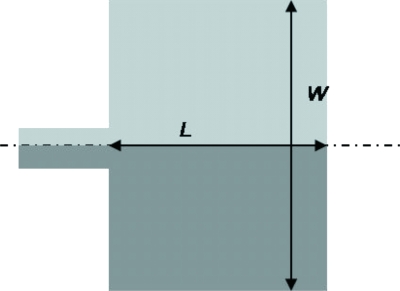
Four designs of T-mixer were fabricated in this study and they are shown in Fig. 1. For all the four designs, the width of the two inlets channels is 100 μm while the width of the outlet channel width is 200 μm. All the channels have the same depth of 50 μm and the channel length from one inlet to the outlet is 1 cm. Design A is a conventional T-mixer which serves as a reference for mixing enhancement to other mixers. Design B is a T-mixer with a constriction (100 μm long and 40 μm wide) located 300 μm downstream from the T-junction. A constriction with similar dimensions (i.e., 100 μm long and 40 μm wide) is introduced right at the T-junction of the two inlet channels for design C. Design D is similar to design C except that the constriction is 400 μm long.
Figure 1.
Dimensions of micromixer: (a) design A, (b) design B, (c) design C, and (d) design D.
All channels in these micromixers were fabricated from polydimethylsiloxane (PDMS) with the soft lithography technique. In brief, negative photoresist SU-8 50 (MicroChem) was spin coated on a silicon wafer and soft baked on a hotplate. The geometries of the micromixers were patterned on the SU-8 with a mask aligner (MA6, Karl Suss) through a photolithography mask. The UV-exposed SU-8 was baked again and then developed in the SU-8 Developer (MicroChem). After developing, protruding patterns of the micromixers were formed on the silicon wafer, serving as the master to replicate the PDMS (Sylgard 184, Dow Corning Corporation) microchannels. PDMS was prepared by mixing the base and the curing agent at 10:1 weight ratio. The mixture was then poured onto the silicon master and cured for 1 h at 80 °C. Two inlet and one outlet reservoirs were formed on the cured PDMS surface with a hole puncher. It was then bonded to a polished microscope glass slide via oxygen plasma treatment.
Solution preparation
The fluid employed was 1 mM sodium bicarbonate (NaHCO3) buffer solution. To observe mixing of the two inlet streams, fluorescent dye (fluorescein disodium salt, C20H10Na2O5) was added to one of the fluid streams. The amount of fluorescent dye was controlled so that the conductivities of the two streams were the same (90.5±1.5 μS∕cm) to ensure no concentration gradient induced EKI.
Experimental setup
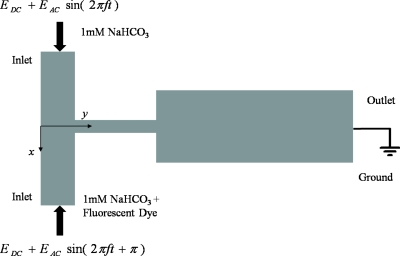
Voltages were applied across the inlet and outlet reservoirs to drive the fluids by electro-osmosis. The voltage supply was generated by a function generator (AFG3022 Tektronix) through a high voltage amplifier. Two sinusoidal ac electric fields of amplitude Eac with a dc bias of Edc were applied at the inlets (see Fig. 2). The two waveforms were out of phase by 180°. An oscilloscope (Hameg Instrument Combiscope) was employed to monitor the voltage applied. The voltage applied to each of the three geometries are listed in Table 1. Taking into consideration of higher electrical potential drop across constriction, the chosen voltages ensured that the electro-osmotic flow velocity, which was proportional to the electric field strength, was the same for the three different designs. This allows the evaluation of the mixing efficiency under the same mean flow velocity at the outlet channel for all three designs. The frequency f and the amplitude Eac of the ac electric field were varied to observe their effect on mixing efficiency, but they have no effect on the mean flow velocity at the outlet channel. The various values of Eac will be expressed in reference to the dc electric field Edc.
Figure 2.
Sinusoidal electric field with amplitude Eac and frequency f, and dc bias Edc are applied at two inlet reservoirs of microchannel (not drawn to scale). Two waveforms are out of phase by 180°.
Table 1.
Electrical potential and electric field applied at inlets.
| Mixer design | Voltage applied (V) | Electric field (V cm−1) |
|---|---|---|
| A | 258 | 258 |
| B | 270 | 258 |
| C | 270 | 258 |
| D | 300 | 258 |
A mercury lamp was employed as the illumination source to excite the fluorescent dye. The optical system comprises an inverted microscope (Nikon Eclipse TE2000-S) with a set of epifluorescent attachments. The image acquisition system consists of an interline transfer charged-couple device (CCD) camera (HiSense MkII) and a FLOWMAP system hub. The resolution of the CCD camera is 1344×1024 pixels with 12 bits gray scale. The camera is capable of capturing images at 5 frames∕s (5 Hz). Due to the periodic nature of the flow pattern, the frequency of the ac electric field is chosen to be noninteger values (for example 2.1 Hz, 4.1 Hz, etc.) to capture the mixing images at different phases of the cycle such that with postprocessing, a good representation for the whole cycle can be constructed. The recorded images were converted to BMP format and postprocessed using a program written in MATLAB.
Reynolds number Re is defined as ρuW∕μ, where ρ is the density of fluid, u is the flow velocity, W is the width of the outlet channel, and μ is the dynamic viscosity of fluid. Based on the Smoluchowski equation, electro-osmotic flow velocity is given by εrε0ζE∕μ, where εr is the dielectric constant of the fluid, ε0 is the permittivity of free space, ζ is the zeta potential [−38 mV (Ref. 16)], and E is the electric field. Re=0.18 was maintained for all investigated micromixers. Peclet number Pe is defined as Wu∕D, where D is the diffusion coefficient. The diffusion coefficient of fluorescein dye in water is determined as 1.5×10⁻⁹ m2∕s.17 Therefore Pe=104 for all micromixers was investigated. Strouhal number St that describes the ratio of flow characteristic time to pulsing period10 is defined as fW∕u, where f is the frequency of ac electric field. St=0.54, 1.05, 1.56, 2.08, 3.10, and 4.13 for f=2.1, 4.1, 6.1, 8.1, 12.1, and 16.1 Hz, respectively.
RESULTS AND DISCUSSION
Mixing efficiency evaluation
Mixing efficiencies of the micromixers were evaluated based on the captured fluorescent images. The concentration ci at a point for a given image is represented by the image intensity value Ii, with the limiting values of concentrations cmax and cmin corresponding to Imax and Imin, respectively. By normalizing the fluorescent intensity Īi as Ii∕(Imax−Imin), the mixing efficiency ηeff is defined as
| (1) |
where N is the total number of points examined in the cross-stream direction, Īi is the normalized intensity at each point, Ī∞ is the normalized intensity in the complete mixing state (value 0.5), and Ī0i is the normalized intensity at each point where no mixing occurs. Ī0i is equal to 0 for one stream or 1 for the other stream, with the number of pixels proportional to the flow rate of the streams. For our experimental condition of both streams having equal flow rate, the expression (Ī0i−Ī∞)2 takes the value of (±0.5)2. The mixing efficiencies of all the micromixers were evaluated at 1200 μm downstream of the T-junction over the width of the channel (5×300 pixels area).
Experimental results for mixer design A
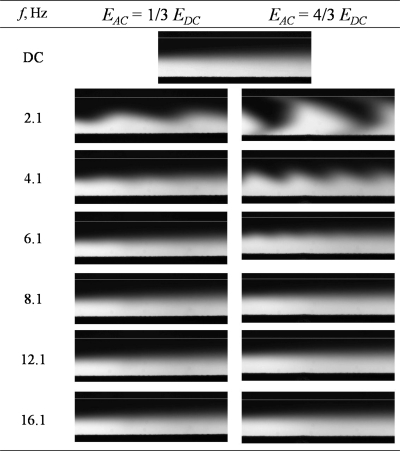
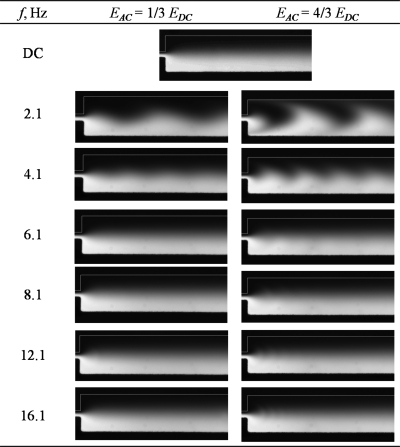
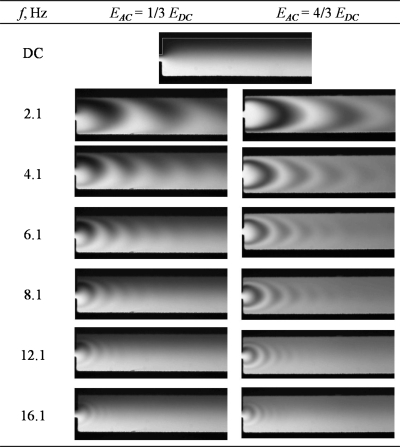
Figure 3 shows the experimental images captured for mixer design A under ac frequencies. It can be observed that the two fluid streams were not well mixed when only a dc electric field was applied. The mixing process only occurred at the middle portion of the channel by mass diffusion. When two ac electric fields of 2.1 Hz and amplitude of 4∕3Edc with a phase difference of 180° were applied at the two inlets, large fluctuation of the fluid interface was observed at the T-junction and wavy patterns were formed at the fluid interface. As the frequency was increased and∕or ac amplitude was decreased, the fluctuation of the fluid interface diminished gradually and the amplitude of the wavy pattern decreased. Almost no wavy pattern was observed for frequencies f≥8.1 Hz; this is likely because the small wavy pattern was blurred by the diffusion of the solute.
Figure 3.
Mixing condition at different ac amplitudes Eac and frequencies f for micromixer design A (dc electric field, Edc=258 V cm−1).
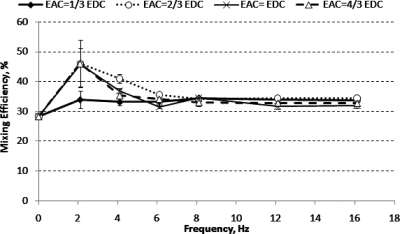
Figure 4 shows that the mixing efficiency achieved (at 1.2 mm downstream) under a dc electric field was only 28%. Adding an ac electric field with f=2.1 Hz and Eac≥2∕3Edc increased the mixing efficiency to 46%. However, the folding of fluid interface was not significant due to the low frequency. Thus the contact area between the two fluid streams only increased slightly, resulting in marginally improved mixing efficiency. Further increasing the frequency to 4.1 Hz induced a more compact folding of fluid interface but the amplitude of the folding was reduced significantly (see Fig. 3). Increasing the frequency beyond 4.1 Hz reduced mixing efficiency gradually. The mixing efficiencies for all ac amplitudes were found to be almost similar for f≥8.1 Hz.
Figure 4.
Mixing efficiency for micromixer design A (at 1.2 mm downstream from T-junction) under various applied ac amplitudes, Eac, and frequencies.
For a channel with a smaller width, the mixing efficiency would have been slightly higher as the amplitude of the wavy pattern is comparable to the width of the channel (Lin et al.11 and Luo et al.12). As the channel width increases, the wavy pattern generated by the fluctuation of the fluid interface at the T-junction does not provide sufficient folding and thus, contact area for mixing enhancement.
Experimental results for mixer design B
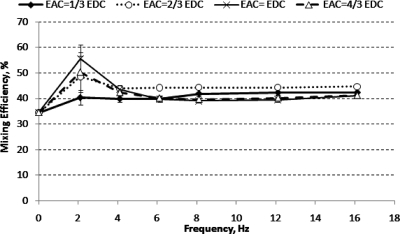
Figure 5 shows the mixing conditions for mixer design B under ac frequencies. The folding pattern did not differ significantly from a straight channel (design A) under the same parametric values although the patterns appeared to be fuzzier due to the diffusion in the constriction. Figure 6 shows that the mixing efficiencies of design B only improved slightly (up to a maximum of 55%) as compared to design A. The slight increase in mixing efficiency is expected due to the shortening of diffusion distance in the constriction. This result illustrates that introducing a constriction downstream (300 μm) from the T-junction will not enhance mixing significantly as compared to the simple straight T-junction under various ac amplitudes and frequencies.
Figure 5.
Mixing condition at different ac amplitudes Eac and frequencies f for micromixer design B (dc electric field, Edc=258 V cm−1).
Figure 6.
Mixing efficiency for micromixer design B (at 1.2.mm downstream from T-junction) under various applied ac amplitudes, Eac, and frequencies.
Experimental results for mixer design C
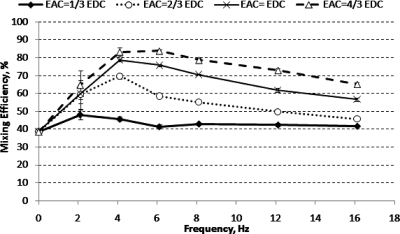
When two sinusoidal voltages with 180° phase difference are applied at the inlets of mixer design C, alternate crescent-shaped layers of the two fluids were formed and radiated downstream of the constriction, see Fig. 7. The shapes and sizes of the fluid layers depend on the frequencies and amplitudes of the ac electric field. The formation of alternate thin layers of fluids increased the contact area between the two streams of fluids tremendously. Figure 8 shows that the mixing efficiency increased with increasing ac amplitude. The mixing efficiency increased with increasing f until a maximum was reached. Further increase in f resulted in a decrease in mixing efficiency gradually. The highest mixing efficiency achieved with mixer design C is 84% (with f=6.1 Hz and Eac=4∕3Edc).
Figure 7.
Mixing condition at different ac amplitudes Eac and frequencies f for micromixer design C (dc electric field, Edc=258 V cm−1).
Figure 8.
Mixing efficiency for micromixer design C (at 1.2 mm downstream from T-junction) under various applied ac amplitudes, Eac, and frequencies.
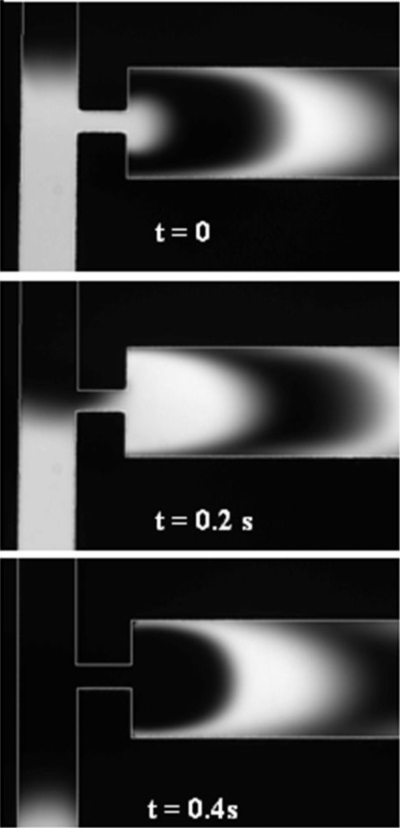
Figure 9 illustrates the sequence of fluorescent images at the constriction (f=2.1 Hz, Eac=4∕3Edc). The periodic fluctuation of the two-stream fluid interface at the inlet of the constriction was caused by the ac electric fields which were out of phase by 180°. At t=0, the electric field for the bottom inlet was stronger than the top inlet, allowing only the stream carrying fluorescent dye from the bottom channel to flow into the constriction. The image at t=0.2 s shows that the plug of fluid with fluorescence was being driven through the constriction and spread at the exit of the constriction. At t=0.4 s, the electric field for the top inlet was stronger, allowing only the stream from the top to flow into the constriction. These alternation flows from the top and bottom channels caused the formation of alternate plugs of fluids in the constriction. The plugs of fluids then spread and radiated out from the constriction in a semicircular manner at the sudden expansion at the exit of the constriction. The plugs became thin, crescent-shaped layers of fluids as they radiated out from the constriction to a channel with much larger width. This spreading effect increased the contact area tremendously between the two fluid streams and thus, enhanced significantly the mixing efficiency.
Figure 9.
Sequence of images at constriction for micromixer design C for f=2 Hz and Eac=4∕3Edc captured at 0.2 s intervals.
Experimental results for mixer design D
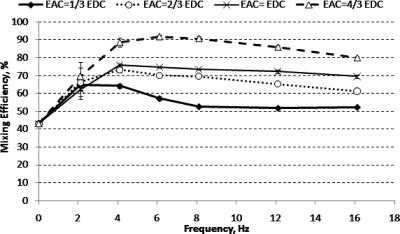
The constriction of mixer design D (400 μm) is four times as long as the constriction of mixer design C (100 μm). The mixing conditions after the constriction at various frequencies and ac amplitudes are shown in Fig. 10. Alternate crescent-shaped patterns were formed in a similar fashion as in mixer design C when ac electric fields are applied. Similarly, the mixing efficiency increased with increasing ac amplitude. Figure 11 shows that a mixing efficiency of 92% can be achieved at f=6.1 Hz and Eac=4∕3Edc; this is higher than the maximum mixing efficiency (84%) observed for mixer design C under the same applied frequency and voltages. This shows that a longer constriction is more favorable for mixing enhancement.
Figure 10.
Mixing condition at different ac amplitudes Eac and frequencies f for micromixer design C (dc electric field, Edc=258 V cm−1).
Figure 11.
Mixing efficiency for micromixer design D (at 1.2 mm downstream from T-junction) under various applied ac amplitudes, Eac, and frequencies.
Although the mixing efficiencies for mixer designs C and D are evaluated at the same downstream location (1200 μm from the T-junction), the mixing times for the two mixers are different. Electric field in the constriction is five times higher than the electric field in the outlet channel. Therefore, fluids are transported at a higher velocity in the constriction as compared to the outlet channel. Thus, mixer design D that has a longer constriction experienced a shorter mixing time. The mixing times for mixer designs C and D are estimated as 1.44 and 1.13 s, respectively, for the same mixing length of 1200 μm.
MIXING MECHANISM ANALYSIS
The mixing enhancement achieved by mixer designs C and D involves two distinct phases: formation of alternative fluid plugs in the constriction and the spreading of these plugs at the exit of the constriction.
Formation of fluid plugs
An expression describing the position of the confluent fluid interface at the T-junction will be derived. The movement of the fluid interface is caused by the varying strength of the electric field. In this analysis, only the x component of the electric field is considered because the fluid interface is fluctuating in this direction (see Fig. 2). The instantaneous electric field at the T-junction, E(t) can be approximated as the combination of the dc and ac electric fields,
| (2) |
The first term in Eq. 2 represents the difference in the two 180° out of phase ac electric fields with angular frequency ω while the second term is the dc electric field. The dc electric field is approximated as a linear function of position, x, with D as the constant of proportionality. Although the dc electric field is in fact not uniform at the T-junction, this approximation can be regarded as the first term of the Taylor series expansion for the electric field.18
With the Smoluchowski equation, the governing equation for the position of the interface of the confluent stream can be written as
| (3) |
For initial condition x=0 at t=0 and solving this first-order ordinary differential equation (ODE) for x(t), the position of the fluid interface x(t) at steady oscillation (i.e., t→∞) may be given by
| (4) |
Equation 4 shows that the fluid interface is oscillating at the same angular frequency ω as the applied ac electric field, and it has an amplitude A given by
| (5) |
Equation 5 indicates that decreasing frequency and∕or increasing ac electric field amplitude will increase the value of A. Plugs of fluids can be formed when A is larger than the width of the channel which is located directly adjacent to the junction of the two side channels. Formation of alternate plugs of fluids is observed for mixers designs C and D because A is larger than the width of the constriction which is only 40 μm. For a channel without a constriction immediately after the T-junction (mixer designs A and B), plugs of fluids can only be formed at very low frequency and∕or very large ac electric field (to obtain a large A value) as the channel width is large (200 μm).
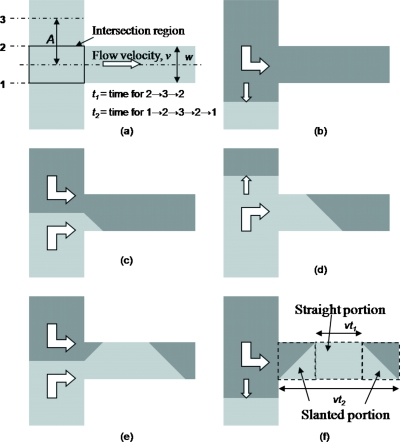
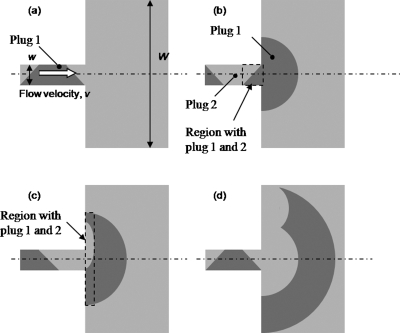
To further understand the formation of the fluid plugs in the constriction, an expression describing the volume of the fluid plugs is derived. As the depth of the channel is constant, an approximate two-dimensional (2D) analysis will be appropriate, and only the area from the top view of the channel may be considered instead of the volume. In this preliminary analysis to elucidate the mechanism, the plug of fluid can be approximated as a trapezium by assuming that the fluid interface movement is uniform at the intersection area, see Fig. 12. Slanted side edges of the trapezoidal plugs are formed when the interface is in the intersection region, while the top and bottom parallel edges of the trapezoidal plugs are formed when the interface is above or below the intersection region.
Figure 12.
Sequence for formation of trapezoidal fluid plugs in constriction. White arrows show fluid flow direction.
The length of the top horizontal edge is vt1 whereas the length of the bottom horizontal edge is vt2, where v is the flow velocity in the constriction, t1 is the time for the fluid interface to move to positions 2→3→2, and t2 is the time for the fluid interface to move to positions 1→2→3→2→1 (see Fig. 12). The area of the trapezium is given by
| (6) |
where w is the width of the constriction. However, it is noted that the sum of t1 and t2 is the period of the oscillation. Therefore,
| (7) |
where f is the frequency of the oscillation for the fluid interface (which is also the frequency of the applied ac electric field). This expression shows that the area of a fluid plug formed in the constriction is inversely proportional to the frequency of the interface fluctuation.
Spreading of fluid plug
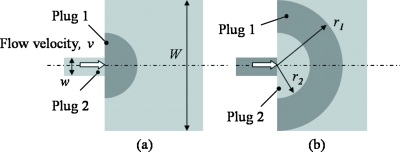
At the exit of the constriction, the plugs of fluid spread in a semicircular manner. Without considering diffusion in this spreading process, the area of the semicircular pattern of fluid at the exit of the constriction is equal to the area of the trapezoidal plugs of fluid in the constriction. Therefore the radius of the semicircular pattern r can be written as
| (8) |
However, the radius of the pattern is restricted by the downstream channel width, which is 200 μm. The value of r is large for a low value of f. Therefore, it can be observed that for low frequencies (2.1 and 4.1 Hz), instead of a uniform semicircular pattern, a semicircular pattern which seems elongated in the downstream direction is formed due to the restriction of the channel wall (see Fig. 7, for example). In this approximate analysis, this distortion is not considered.
The crescent-shaped layers of fluid radiating from the constriction are formed by consecutive semicircular plugs of fluids. These layers of fluids increase the contact area of the two fluids and shorten the diffusion distance of solute for complete mixing. In this 2D analysis, the volume to contact surface ratio R is equivalent to area to contact perimeter ratio. R can be estimated as the ratio of the area of the crescent, which can be estimated from the enclosed area between the two semicircular, arcs as indicated in Fig. 13b, to the total length of these two semi circular arcs. Therefore, R can be derived as
| (9) |
where r1 and r2 are the radii of the two adjacent semicircular arcs [see Fig. 13b]. When plug 1 is fully spread, r1 is equal to half of the width of the main channel. r2 may be determined by assuming that the crescent-shaped area formed by the two arcs is the same as the area of the trapezoidal plug [given by Eq. 7]. Therefore, r2 can be expressed as
| (10) |
Substituting r1 and r2 into Eq. 9 gives
| (11) |
Indeed, R can be interpreted as the characteristic length for the diffusion process. From Eq. 11, it is noted that as f increases, R decreases. This means that the characteristic length for the diffusion process decreases as f increases due to the thinner layer of crescent formed. This trend can be clearly observed from the experimental results (see Figs. 710) where the crescent-shaped layers of fluid became thinner as f increased.
Figure 13.
Sequence for spreading of fluid plugs at exit of constriction.
In contrast, for confluent flow of two fluids without the formation of crescent-shaped plugs, the contact area is only at one edge of the stream (Fig. 14). For the same volume of fluid as a semicircular plug, the length of contact L is
| (12) |
where W is the width of the main channel. Therefore, the volume to contact surface ratio Rnorm can be derived as
| (13) |
Rnorm is indeed the characteristic length for the diffusion process across half of the channel width. Comparing Eqs. 11, 13 shows that the magnitude of R is much smaller than Rnorm. The percentage reduction in volume to contact surface ratio is
| (14) |
This means that the formation of the thin crescent shape layers reduces the characteristic length for the diffusion process by at least 50% as compared to a normal confluent flow for two fluids and thus, enhances mixing significantly.
Figure 14.
Length of contact for normal diffusive mixing process.
Although Eq. 11 suggests that the contact area (and thus mixing efficiency) increases as the frequency of ac electric field is increased, experimental results show that the mixing efficiency increases to a maximum up to a certain optimum frequency and then decreases with further increase in frequency (see Figs. 811). Beyond this optimum frequency, the mixing efficiency reduces gradually. The following analysis provides an explanation for the existence of this optimum frequency.
The spreading analysis so far assumes that the plugs of fluid spread uniformly and symmetrically from a trapezium pattern to a semicircular pattern. However, the exact spreading process is more complicated. Due to the slanted edge of the trapezium, the semicircular pattern is in fact not symmetrical. The slanted portion [see Fig. 12f] of the fluid plugs consists of two different fluids. In other words, there is uneven concentration distribution across the width in this portion of the plug. The two fluids spread separately to the edges of the channel (see Fig. 15), forming a concentration gradient across the width of the channel. This causes inhomogeneous mixing of the two fluids, thus reducing the mixing efficiency.
Figure 15.
Sequence for unsymmetrical spreading of trapezoidal plug at exit of constriction.
The significance of this effect depends on the proportion of the slanted portions of the trapezium to the whole plug of the fluid. The length of the top edge of plug 1 is given by vt1 [see Fig. 12f]. It is assumed that the times for the interface to travel to positions 2→3 and 3→2 are the same. By using Eq. 4, t1 (time to travel to position 2→3→2) is given by
| (15) |
where w is the width of the constriction and ω=2πf. The length of the bottom edge of plug 1 is given by vt2 [see Fig. 12f]. Since the sum of t1 and t2 is the period of the oscillation, t2 can be written as
| (16) |
From Eq. 15, the ratio S of the length of the slanted portion to the length of the trapezoidal plug can be derived,
| (17) |
Substituting Eq. 15 into Eq. 17 gives
| (18) |
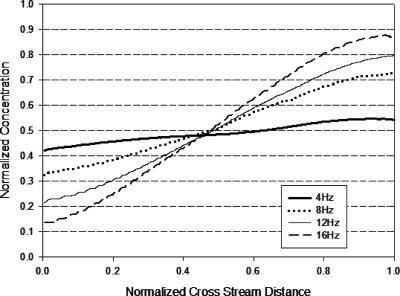
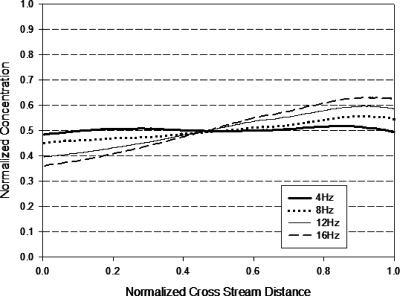
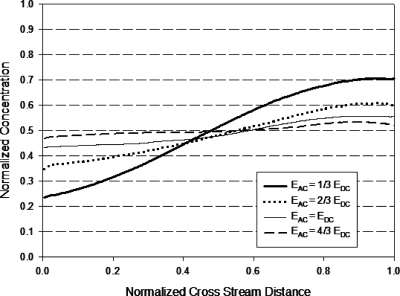
It is observed that S increases with decreasing A; from the expression for A [Eq. 5], it means that S increases with increasing f and∕or decreasing Eac. A higher S value indicates a higher proportion of the slanted part formed and leads to less homogeneous mixing (formation of concentration gradient across the channel width). This conclusion is in agreement with the experimental results obtained. Figures 1617 show that the concentration gradient across the width of the channel increased as f increased. Figure 18 illustrates that as the ac amplitude decreased, the concentration gradient across the width of the channel increased.
Figure 16.
Normalized concentration distribution across width of micromixer design C (at 1.2 mm after T-junction) with applied ac amplitude Eac=4∕3Edc. Cross stream distance is normalized with width of channel (200 μm).
Figure 17.
Normalized concentration distribution across width of micromixer design D (at 1.2 mm after T-junction) with applied ac amplitude Eac=4∕3Edc. Cross stream distance is normalized with width of channel (200 μm).
Figure 18.
Normalized concentration distribution across width of micromixer design D (at 1.2 mm after T-junction) with applied ac frequency 6.1 Hz. Cross stream distance is normalized with width of channel (200 μm).
A comparison between Figs. 1617 shows that mixer design D produced a more homogenous solution with less cross-stream gradient as compared to mixer design C. The long constriction allows more diffusion to occur, resulting in a reduction in the concentration gradient at the slanted portion of the trapezoidal plug and causes more homogeneous spreading. Although not shown in the experimental results, Eqs. 11, 18 suggest that reducing the constriction width will increase the mixing efficiency through an the increase in the contact area and the formation of plugs with less concentration gradient.
It should be noted that for A smaller than w, Eq. 18 is not defined. This is expected because complete trapezoidal plugs are not formed when the amplitude is smaller than the width of the constriction. The limiting case is when A=w, S=1. This shows that when the amplitude A is the same as the width of the constriction, the trapezium becomes a triangle.
Although this approximate analysis is based on simple models, it provides an insight on the mixing mechanism and highlights the factors affecting the mixing efficiency of the micromixer. This would facilitate the optimization of its mixing efficiency and design.
CONCLUSIONS
We have developed an efficient and simple T-shaped micromixer. By using a simple constriction at the T-junction, significant mixing enhancement can be achieved in a short distance under electrokinetic flow driven by a periodic electric field. Two out of phase ac electric fields with dc bias applied at the inlets induce fluctuation of two mixing streams interface at the T-junction. To achieve high mixing efficiency, the amplitude of the two-stream interface oscillation has to be larger than the width of the channel immediately after the T-junction to allow the formation of the alternate plugs of fluids. These fluid plugs spread at the exit of the constriction to form crescent-shaped layers of fluids which increase tremendously the interfacial surfaces between the two mixing streams, and thus the mixing efficiency.
Experimental results and mixing enhancement analysis suggest that the constriction length, the ac amplitude Eac and frequency f are important parameters that govern the mixing efficiency. Increasing the constriction length and∕or Eac increases the mixing efficiency due to the formation of fluid plugs with more uniform concentration distribution. Increasing f allows the formation of thinner layers of fluid but results in less homogeneous mixing because of the increased asymmetry of the plugs. Thus, there is an optimum frequency that yields the highest mixing efficiency. For the investigated geometrical dimensions of the mixers, the highest mixing efficiency was achieved in a frequency range of 4–6 Hz (St=1.05–1.56).
ACKNOWLEDGMENTS
The authors gratefully acknowledge the Agency for Science, Technology and Research (A*STAR) Singapore for its financial support (SERC Grant No. 052 101 0013).
References
- Stroock A. D., Dertinger S. K. W., Ajdari A., Mezic I., Stone H. A., and Whitesides G. M., Science 295, 647 (2002). 10.1126/science.1066238 [DOI] [PubMed] [Google Scholar]
- Sasaki N., Kitamori T., and Kim H. B., Lab Chip 6, 550 (2006). 10.1039/b515852d [DOI] [PubMed] [Google Scholar]
- Ng W. Y., Goh S., Lam Y. C., Yang C., and Rodriguez I., Lab Chip 9, 802 (2009). 10.1039/b813639d [DOI] [PubMed] [Google Scholar]
- Erickson D. and Li D., Langmuir 18, 1883 (2002). 10.1021/la015646z [DOI] [Google Scholar]
- Lin H., Storey B. D., Oddy M. H., Chen C. -H., and Santiago J. G., Phys. Fluids 16, 1922 (2004). 10.1063/1.1710898 [DOI] [Google Scholar]
- Park H. Y., Qiu X., Rhoades E., Korlach J., Kwok L. W., Zipfel W. R., Webb W. W., and Pollack L., Anal. Chem. 78, 4465 (2006). 10.1021/ac060572n [DOI] [PubMed] [Google Scholar]
- Chen C. o-K. and Cho C. -C., J. Colloid Interface Sci. 312, 470 (2007). 10.1016/j.jcis.2007.03.033 [DOI] [PubMed] [Google Scholar]
- Jain M., Yeung A., and Nandakumar K., Biomicrofluidics 3, 022413 (2009). 10.1063/1.3167279 [DOI] [PMC free article] [PubMed] [Google Scholar]
- Xia H. M., Wan S. Y. M., Shu C., and Chew Y. T., Lab Chip 5, 748 (2005). 10.1039/b502031j [DOI] [PubMed] [Google Scholar]
- Glasgow I. and Aubry N., Lab Chip 3, 114 (2003). 10.1039/b302569a [DOI] [PubMed] [Google Scholar]
- Lin C. H., Fu L. M., and Chien Y. S., Anal. Chem. 76, 5265 (2004). 10.1021/ac0494782 [DOI] [PubMed] [Google Scholar]
- Luo W. J., Chang K. C., and Wang J. S., J. Appl. Sci. 8, 1632 (2008). 10.3923/jas.2008.1632.1641 [DOI] [Google Scholar]
- Coleman J. T., McKechnie J., and Sinton D., Lab Chip 6, 1033 (2006). 10.1039/b602085b [DOI] [PubMed] [Google Scholar]
- Yan D., Yang C., Miao J., Lam Y. C., and Huang X., Electrophoresis 30, 3144 (2009). 10.1002/elps.200900162 [DOI] [PubMed] [Google Scholar]
- Chang C. C. and Yang R. J., Microfluid. Nanofluid. 3, 501 (2007). 10.1007/s10404-007-0178-z [DOI] [Google Scholar]
- Mourzina Y., Kalyagin D., Steffen A., and Offenhässer A., Talanta 70, 489 (2006). 10.1016/j.talanta.2005.12.063 [DOI] [PubMed] [Google Scholar]
- Wu Z., Nguyen N. -T., and Huang X., J. Micromech. Microeng. 14, 604 (2004). 10.1088/0960-1317/14/4/022 [DOI] [Google Scholar]
- Shin S., Kang I., and Cho Y. -K., Colloids Surf., A 294, 228 (2007). 10.1016/j.colsurfa.2006.08.024 [DOI] [Google Scholar]


