Abstract
We propose a novel approach to resolve simultaneously the distributions of velocities and concentration of multiple, submicron species in microfluidic devices using microparticle image velocimetry, and particle counting. Both two-dimensional measurement and three-dimensional analysis of flow fields, from the stacked images, are achieved on applying a confocal fluorescence microscope. The displacements of all seeding particles are monitored to determine the overall velocity field, whereas the multicolor particles are counted and analyzed individually for each color to reveal the distributions of concentration and velocity of each species. A particle-counting algorithm is developed to determine quantitatively the spatially resolved concentration. This simultaneous measurement is performed on a typical T-shaped channel to investigate the mixing of fluids. The results are verified with numerical simulation; satisfactory agreement is achieved. This measurement technique possesses reliability appropriate for a powerful tool to analyze multispecies mixing flows, two-phase flows, and biofluids in microfluidic devices.
INTRODUCTION
Microfluidic devices receive much attention and have been widely used for chemical analysis and biological applications;1, 2, 3 one can conveniently pretreat, manipulate, mix, separate, and extract samples relying on the behavior of functional microflows in devices with microstructured channels. A profound understanding of the microflows in these devices is therefore essential for their optimization. Experimental and numerical approaches are useful to analyze a flow and to observe its temporal and spatial phenomena in devices. Computational fluid dynamics (CFD) is a universal tool to characterize the flow dynamics of fluids in devices, but this method is difficult to apply for calculations on fluids in a full-scale device because of enormous grids (a hardware limitation) and the drawback of numerical diffusion.
In experiments, a measurement technique is indispensable to dissect the velocity and concentration fields in microdevices. Microparticle image velocimetry4, 5, 6 (micro-PIV) and microparticle tracking velocimetry7 are techniques developed to visualize the velocity field based on advances in optics and digital image processing. Micro-PIV has been applied to diagnose various flows, such as transient flow in microfluidic devices, internal flows in a moving droplet, and biological flows. For concentration fields in microfluidics, the microlaser induced fluorescence (micro-LIF) measurement is an attractive technique, in which the intensity of emitted fluorescence is related to concentration by assuming a linear proportional relationship between them.8, 9, 10, 11, 12 The distributions of fluids can also be tracked by using the particle distributions.13, 14 Baltussen et al.13 used this way to observe the mixing of fluids in an active micromixer and then determinate the mixing quality through numerical simulation. Dominik et al. revealed velocity profile and the penetration of fluids in a twice-folded microchannel by seeding particles to a partial stream of the flow.14 However, the velocity profile can only be partially obtained in this way. Other measurements were therefore needed to obtain the overall velocity field and the quantitative concentration distribution.
The depth of field (DOF) of the microscope plays a significant role in micro-PIV measurement. When the DOF is large, unfocused particles will degrade the quality of the PIV images and accuracy of velocity prediction. Moreover, investigation of the mixing patterns via particle distribution will also suffer a serious overlapping problem when the DOF is large. A technique termed confocal fluorescence microscopy that combines confocal microscopy and fluorescence enables one to capture a relatively small DOF image with a pinhole effectively cutting off light from out-of-focus plane.15, 16, 17, 18, 19 This technique also enables optical slicing that facilitates reconstruction of three-dimensional (3D) images of microflows with image processing to stack the thin sections from various depths.
The methods of measuring velocity or concentration fields are several and increasing, but a technique for simultaneous measurement of species concentration and the velocity of flow patterns is less explored and developed. The typical measurement always needs two separated experiments to obtain the velocity and concentration fields,5, 19 for instance, a micro-PIV measurement for velocity field and a micro-LIF measurement for concentration distribution.19 For the mixing of microfluids, 3D and complicated microflows induced by designed microstructures11, 15, 20 or active disturbances21, 22 are typically used to boost the mixing or reactions of samples; this coupling of mass and momentum transport is interesting but lacks detailed investigation. If a reaction of samples occurs in a microreactor, the outcome depends on the uniformity and the transient variation of the samples, which are dominated by both flow and concentration fields.
To analyze the velocities and concentrations distributions at the same moment and space, we therefore propose a novel measuring approach involving micro-PIV and multicolor particle-counting techniques. This approach is implemented with a confocal fluorescence microscope to inspect two-dimensional (2D) microflows and to reconstruct 3D microflows in detail. We monitored the motion of seeding particles that possess a varied fluorescence color to reveal an overall velocity field and the velocity of individual species; the distribution of the particles was then analyzed with a particle-counting method so as to define the concentration profiles quantitatively. Such mixing of fluids in a typical T-shaped channel was investigated as a case study through both measurements and verification with CFD simulation. We demonstrate that this technique tracks simultaneously the velocity and concentration distributions; it will thus be used to analyze the mixing mechanisms of complex microfluidic devices and characterize their performance at the same time; whereas that effect is requiring much time and effort to realize with a typical measurement or a numerical simulations. This technique, furthermore, tracks the velocities of individual species, and hence provides information about the interactions between the mass transfer and the momentum transfer in a microchannel, which is very important in improving the efficiency of microfludic devices. This approach has several potential applications, such as tracking biochemical reactions by using chemically sensitive and temperature-sensitive particles. We contend that this approach is qualified to be applicable to track a reaction flow in microdevices, multispecies mixing flow, two-phase flow, and flow of biological fluids such as blood.
EXPERIMENTS
Apparatus
The simultaneous measurement of velocity and concentration fields was implemented in a T-shaped microchannel of total length 290 mm; the cross section of the channel is a trapezoid (80, 320, and 440 μm in height, short base, and long base, respectively) because of inaccuracy of microfabrication. The microchannel was fabricated with a common PDMS (polydimethylsiloxane) replica-molding technique, briefly described as follows.9, 15 A silicon wafer containing a SU-8 (MicroChem) relief structure complementary to the microchannels was fabricated with a photolithographic method. The PDMS layer with a T-shaped channel was then fabricated on casting a 10:1 (by mass) mixture of PDMS precursor and curing agent (Sylgard 184, Dow Corning) against the silicon master and curing the mixture at 80 °C over 2 h. After the PDMS layer and a cover slide were activated with an oxygen-plasma treatment, the microchannel was packaged.
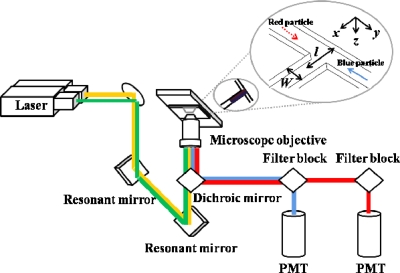
The blue and red fluorescent particles (diameter dp 200 nm, aqueous suspension, Duke Scientific Corp.), with excitation∕emission at wavelengths of 405∕495 and 560∕620 nm, respectively, were pumped into a microchannel with a syringe pump (KDS220, KD Scientific Inc.) at flow rate from 0.5 to 4.0 μl min−1. The density ρp of fluorescent particles is about 1005 kg m−3, which is closed to the working fluid we used (de-ionized water; the density ρw is about 1000 kg m−3; viscosity μw 0.001 Pa s); hence the sedimentation of particles is minimized. The sliced particle images were recorded with a confocal microscope (Nikon A1R). A sketch of the light path of the confocal microscope appears in Fig. 1. The excitation light, provided by a diode laser (405 nm, 324±12 mW) and an argon laser (561 nm, 272±1 mW), were directed into a set of resonant mirrors to produce rapid line scanning. The laser beams were then directed into an objective lens (Plane Apochromat VC 10×, numerical aperture of 0.45) with a dichroic mirror, which reflects light at wavelengths of 405, 488, and 561 nm while passing other wavelengths. The sampled volume was uniformly illuminated lines by lines with the laser beams; emission there from was collected with the same objective lens. To eliminate stray light, the emitted light was directed to pass through a pinhole (diameter 12.8 μm) behind the dichroic mirror. The intensities of the light emitted in wavelength ranges of 425–475 and 570–620 nm, with respective filter blocks, were measured with two separate photomultiplier tubes (PMTs).
Figure 1.
Schematic of the confocal system.
A commercial software package (NIS-Elements AR, Nikon, Japan) was used to construct the 2D particle images from the fluorescence signals recorded with the PMT. The pixel resolution of the image was 512×128 at a frame rate of 120 frames∕s. The optical sliced thickness was ∼6.2 μm;18 the observed effective particle diameter (de) was about 3–4 pixels (8–10 μm), which was close to the estimation (∼12 μm) using the convolution of the diffraction-limited image with the geometric image.23
In order to verify that these particles follow the flow effectively, the relaxation period τp necessary for the particles to attain their terminal velocity was calculated from6
| (1) |
which shows that each particle readily attains its terminal velocity during an interval Δt=8.3 ms separating the two frames of an image pair. The falling velocity Up is calculated from5
| (2) |
which is clearly negligible relative to the measured velocities (∼1 mm s−1).
Numerical model
The 3D numerical simulations were performed on a platform with a commercial finite-volume computer code (CFD-ACE+, CFD Research Corporation). The governing equations consist of conservation equations of mass, momentum, and species. The setting of a numerical model for the T-shaped channel was based on previous work;24 the tests of grid independence refer also to that. In order to match the geometry of the fabricated channel, the numerical model was performed with a trapezoidal cross section. The simulated system is assumed to have a steady and incompressible laminar flow field with small Reynolds number (Re<0.1); a finite-volume method is used to discretize the conservation equations. The CFD-ACE+ code adopted the SIMPLEC scheme for pressure correction;25 the space variable was interpolated with a second-order scheme that is a combination of the central scheme and the upwind scheme to minimize the effect of numerical diffusion. The convergence criterion for the variation of each variable was set to 1×10⁻⁴.
RESULTS AND DISCUSSION
Velocity and concentration analysis
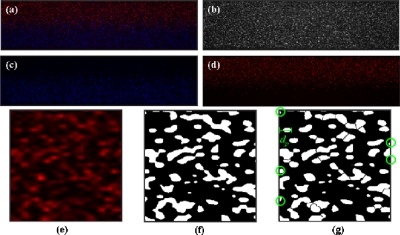
Figure 2a shows a typical particle image from our simultaneous measurement. The intensities of blue and red fluorescence recorded with individual PMT were readily separated [Figs. 2c, 2d]. To determinate the velocity field, we converted the blue and red fluorescent images to 256 gray levels and combined them together to get the profile of all the particles [Fig. 2b]. A standard cross-correlation scheme (Insight 5, TSI Inc.) was used to process these merged images to produce the raw vector field. This scheme implemented a multipass interrogation in which in the first pass cross correlation was calculated for an interrogation spot of area 32×32 pixel2; the interrogation spot was then divided into four subareas 16×16 pixel2 for the second pass calculation. The interrogation spots overlapped by half; a Gaussian fit was used to resolve the subpixel displacement. The interval between two images was 8.33 ms and the temporally averaged velocity fields were obtained from 360 consecutive data. Because the maximum displacement is about 28 μm (11 pixels, one-third of the interrogation spot), the maximum velocity we can detect is 3.3 mm s−1. Using a lager spot can improve this upper limit, but the resolution will become smaller. The maximum velocity is also limited by the line scanning speed of the confocal laser scanning microscope, which is 15 600 lines s−1. The effective diameter of a particle is about 4 pixels, and thus a particle is scanned within 0.26 ms. As the flow velocity larger than 10 mm s−1, a particle would displace more than 1 pixel during scanning so that the peak-detection scheme might become inapplicable.
Figure 2.
Example of particle images and the particle-counting process: (a) original particle image; (b) merged image for evaluation of overall velocities; (c) separated image for evaluation of the concentration of blue particles; (d) separated image for evaluation of the concentration of red particles; (e) a sampling window (16×16 pixel2); (f) typical threshold method; (g) watershed-segmentation method (the black lines between particles are the boundaries marked by this method). (e)–(g) are enlarged five times for clarity.
The spatially resolved distributions of concentration were evaluated with particle counting as described below. The red or blue fluorescence images [Fig. 2c or Fig. 2d] were first divided into several sampling windows [Fig. 2e]. A typical threshold method, in which the threshold value was determined by the maximum value of the background noise (the signal-to-noise ration is about 6.5 dB), was used to discriminate particles (white) from background [black, Fig. 2f]. The particle numbers were then counted with a connected component-labeling algorithm, in which a label matrix is applied to assign a unique index to all pixels belonging to the same connected component. The number of connected components (i.e., number of particles) is therefore equal to the number of indices.26
Because of the diffraction of light, the diameters of particles in images (i.e., effective diameter) are usually larger than their actual diameter.23 The fluorescence signals from separate particles are sometimes merged with each other. The typical threshold method cannot resolve such merged fluorescence, and thus underestimated the particle numbers. The remedy was to separate these merged particle images using a watershed-segmentation algorithm.26 In this algorithm, the image gradient is considered as a topographic surface; the topography is flooded from its minima. By preventing the merging of the waters coming from separate sources, one can partition the image into two separate sets—the catchment basins and the watershed lines. The catchment basins correspond to the homogeneous gray-level regions of the image, whereas the watershed lines correspond to the boundaries between two homogeneous regions (i.e., the boundary between two particles). Once the boundaries are located, the typical threshold method and the connected component-labeling algorithm are applied to count the particles. As shown in Fig. 2g, most merged particle images were successfully separated when the watershed-segmentation algorithm was applied.
Some particles were located at the edges of the sampling window [marked with green circles in Fig. 2g]. These particles were all counted as “one particle” in the connected component-labeling algorithm, despite being only a part of a particle; the particle number became thereby overestimated, especially for a small sampling window. A Gaussian weighting function was hence used to decrease the weighting of a particle located at the edge of a sampling windows, i.e.,
| (3) |
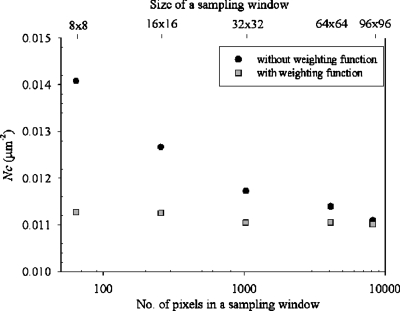
in which dp is the maximum distance from the edge of a particle to the nearest edge of the sampling window, with unit pixel, and de is the effective diameter, unit pixel, for which we used a value of 4. With the weighting function, a particle near the edge of a sampling window was no longer regarded as a particle but a partial particle. Figure 3 presents the particle-counting results for the sampling windows with varied sizes. Without the weighting function, the particle number per unit area (Nc) increases from 0.0111 to 0.0141 μm−2 with window size decreasing from 96×96 to 8×8 pixel2; the counting results hence depend on the window size. Once the weighting function is applied, the particle number per unit area remains constant (0.0111±0.0001) regardless of the window size.
Figure 3.
Particle-counting results for sampling windows of various sizes.
To conform to the PIV measurement, a sampling window with 16×16 pixels2 and 50% overlap was used in this work. The concentration measurement using this particle-counting method was further tested in a T-shaped channel flow with flow rate in a range of 0.5–4.0 μl min−1. The particle-counting results (16×16 pixels) for the flow rates of 4, 2, 1, and 0.5 l min−1 are 0.011 147, 0.011 137, 0.011 16, and 0.011 139, respectively. Because the differences are only about 0.1%, we conclude that the particle-counting algorithm is independent of the flow rate.
Calibration of the concentration measurement
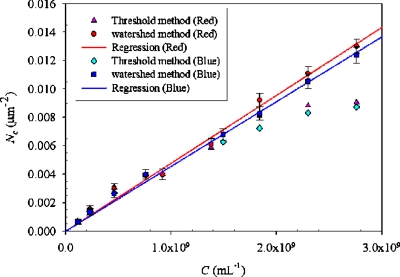
To relate the results of particle counting, Nc, to the particle concentration, C, we performed concentration measurements on a T-channel flow at a rate of 2.0 μl min−1 with a single-fluorescence particle at number density in a range (1.15×10⁸)–(2.76×10⁹) ml−1 (Fig. 4). As described above, a typical threshold method cannot resolve two individual particles while their fluorescence is merged. This fluorescence merging problem becomes more important with increasing number density. As shown in Fig. 4, the particle numbers counting by the typical threshold method is no longer increased linearly with increasing number density for N>1.5×10⁹ ml−1. In other words, the typical threshold method is valid only for number density N<1.5×10⁹ ml−1 in our apparatus.
Figure 4.
Relation between species concentration C and measured particle number Nc.
Figure 4 shows that the relation between the particle concentration and particle-counting results is satisfactorily linear when the watershed-segmentation algorithm was applied. The slopes of linear regression for red and blue particles are (4.78±0.17)×10−12 and (4.56±0.13)×10−12, respectively. With this relation between counting results and particle concentration, we evaluated the particle concentration with these formulas,
| (4) |
Because of the random distribution of particles, an extra uncertainty would be induced when this particle-counting method is applied to determine the instantaneous concentrations—i.e., calculated the concentration distributions from a particle image. The difference in the estimated concentration distributions from two separated images depends on the total number of particles in a sampling window. For a window size 16×16 pixel2, the uncertainty decreases from ±15% to ±4% with Nc increasing from 0.001 μm−2 (C≈2.3×10⁸ ml−1) to 0.01 μm−2 (C≈2.3×10⁹ ml−1). Although this difference is decreased with a greater concentration of particles, both the watershed-segmentation algorithm and the PIV analysis fail when the particles become too dense. We thus selected a particle concentration 2.3×10⁹ ml−1 for the following measurements. In this concentration, only about 4% extra uncertainty is induced when analyzing the concentration from an instantaneous image. For steady-state flows, this uncertainty is greatly reduced through evaluation of the concentrations from several recordings and then averaging these results. This study performs this method to a steady-state flow so that we use 120 images to obtain a converged, temporally averaged, particle-counting result (less than 1% difference is shown when more images are averaged).
Flow and concentration (number density) fields
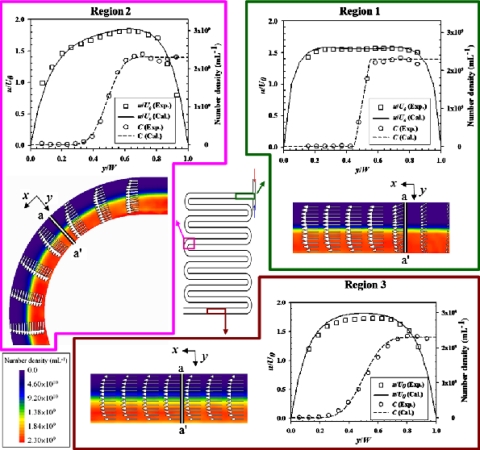
We analyzed simultaneously the flow and concentration fields at various regions in the mid-depth plane of the T-shaped channel, as shown in Fig. 5; the vector distribution and the color patterns indicate the velocity and concentration fields, respectively. The transverse distance (y) is normalized to its local width [i.e., w=w(z), which is 380 μm at the center]. The magnitude of U0 is 0.556 mm s−1 (Re=0.5), which is defined as an average velocity of the entire inflow; that is
| (5) |
in which Qin is the volumetric flow rate of a inflow and A is the cross-sectional area of the microchannel. The profiles of the fields are depicted along lines a-a′ for respective parts, denoted as regions 1–3; the experimental data (open square for velocity field, open circle for concentration field) coincide satisfactorily with the trends of the simulation results (solid line for velocity field, dotted line for concentration field). The maximum relative errors for both velocity and concentration fields between experimental and numerical results are about 5%.
Figure 5.
Field analysis (blue fluorescent particle for concentration distribution) in various regions of the T-shaped channel.
Region 1 is the confluence of the two inflows. During the convergence, the trend of the velocity field gradually alters to the X-direction and concurrently evolves into a fully developing profile. The profile of concentration shows that the interface between the two fluids is distinct. While flowing downstream, the fluids are driven to mix only by molecular diffusion; the interface between the two fluids thus expands by degrees and the concentration profile becomes smooth (see region 2). The velocity profile (tangential) along a normal direction (a-a′) is an asymmetrical curve that is induced by the action of the outer flow on the inner flow at a curve of the channel. The outer flow is forced to slow down when running into the outer side of the curve; the inner flow therefore accelerates for conservation of mass. In region 3 (the downstream channel), the velocity profile presents a fully developed status; the maximum velocity (Uc,max) occurring at the center of the channel is about 1 mm s−1. The interface shows a gentle gradient of concentration.
An investigation of the concentration field is a significant issue for microfluidic mixing and reactions. The distribution of concentration is represented based on the notion of number density, C, normalized as follows:
| (6) |
in which C′ is the normalized number density and C0 is the number density of the inflow (i.e., the maximum concentration, 2.3×10⁹ ml−1).
A mixing index Mi commonly used to describe the mixing quality of fluids is defined as
| (7) |
in which n is the amount of the sampling windows, is the normalized number density of sampling window i, is the normalized number density for the inflow, and is the normalized number density for a fully mixed flow. The mixing index implements a concept of a scale of fluid mixing; a mixing index of value unity implies fluids fully mixed, whereas zero represents fluids fully unmixed.
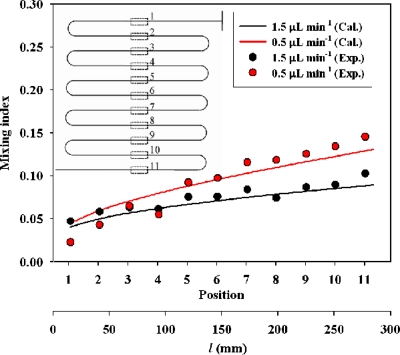
The mixing quality of fluids was analyzed experimentally and numerically at various positions of the T-shaped channel, as shown in Fig. 6; we tested the fluid mixing at flow rates of 1.5 and 0.5 μl min−1. The diffusion coefficient, ∼10−12 m2 s−1, of fluids for the numerical setting is analogous to that for particles of size 0.2 μm mobile in a typical aqueous solution for experiments. A trend in which the mixing index increased with distance downstream during diffusion between fluids in the results of experiments agrees satisfactorily with that of numerical simulation; the average relative error between experimental and numerical results is about 10%. The mixing index calculated by Eq. 7 would be affected by the amount of data points (n). In usual, more data points are needed to produce a better fit when the concentration gradient is large. The flow near the inlet has a larger gradient (at the interface of two streams) so that the deviation is larger. The error derived also from the image processing—the method of counting particles, which possesses an uncertainty of 5%; minor error arose from other experimental parameters. The mixing index of fluids at flow rate 0.5 μl min−1 is superior to that at 1.5 μl min−1 because a greater duration of fluids flowing in the channel yields better mixing of the fluids.
Figure 6.
Mixing index at various positions and mixing distance l.
Because the diffusivity of the seeding particle (∼10−12 m2 s−1) is smaller than solute species or molecules (about 10−9∼10−10 m2 s−1), using our measurement method to investigate the mixing of fluid is currently limited to submicron species, such as larger biochemical species or cells. Employing a smaller seeding particle will provide a better match to the diffusion coefficient of a typical solute, but the particle size we used now is already the low limit of present micro-PIV technique. Our method is suitable for a device whose mixing process is dominated by momentum transfer. Although the size of seeding particles is larger than that of most fluorescent dyes (diffusivity ∼10−10–10−12 m2 s−1) commonly utilized to perform a mixing test for evaluation of the performance of devices, the mixing of a fluorescent dye reflects only the concentration field of fluids and cannot provide the information of momentum transport phenomena. At present, a technique for simultaneous measurement of species concentration and the velocity of flow patterns has not been completely developed yet; the simultaneous measurement method introduced in this work helps to obtain thorough information inside the microdevices.
Investigation of 3D flow and concentration fields
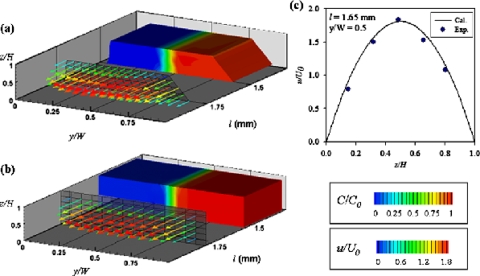
The 3D flow and concentration fields were reconstructed on stacking various sliced images with image processing, as shown in Fig. 7a; the simulation result is shown in Fig. 7b. The sliced images were captured at depths of 0.15H, 0.32H, 0.49H, 0.66H, and 0.80H. Because the physical field of view is fixed, the 3D reconstructed image displays a trapezoidal channel after normalizing y to its local width. Figure 7c shows a velocity profile depicted along the Z-direction. The velocity field of our experiments corresponds to that of our numerical results for the most central area of the fields, which demonstrates that the proposed simultaneous measuring technique has the ability to visualize 3D flow and concentration fields in the microchannel.
Figure 7.
3D flow (arrows) and concentration (contour) patterns obtained from (a) experiments and (b) numerical simulation; (c) velocity profile along the Z-direction.
CONCLUSION
We propose a novel method for simultaneous measurement of the distributions of velocities and concentrations in microfluidic devices. Blue and red fluorescent particles are seeded into the microfluidic device to track the displacement of the particles and the mixing of the fluids. The velocities and concentrations are determined with typically a cross-correlation scheme and a particle-counting technique, respectively. The algorithm to count particles, which adopts the watershed-segmentation algorithm to diminish the fluorescence merging problem and utilizes a Gaussian weighting function to avoid overestimation of the particle number at the edges, successfully quantify the concentration distribution with an uncertainty of about ±4%.
The multicolor micro-PIV measurement was performed on a typical T-shaped channel. The 2D velocity and the concentration distribution at the mid-depth plane in the channel were monitored, and a mixing index was used to describe the quality of fluid mixing. The results agree satisfactorily with the results from numerical simulations (5% difference for velocity and concentration distributions and 10% difference for the mixing index). The 3D flow fields, visualized on stacking 2D flow fields, agree with the predictions of numerical modeling.
Dissecting the velocity and concentration fields is essential for understanding and optimizing a microfluidic device. Our work demonstrates that multicolor micro-PIV measurement can investigate simultaneously the 2D velocity and concentration distributions, and reconstruct the 3D flow patterns. This technique will be severed as an advance tools for comprehending the interactions between the momentum transfer and mass transfer in the complex microfludic devices. Because of the limitation of the seeding particle size, this method is not yet suitable for precisely tracking small molecular species, especially when the flow is dominated by diffusion transfer. It is, however, the best way currently available to simultaneously resolve the velocity and concentration distributions in a microfluidic device. We are now planning to utilize this advanced technique to track biochemical and chemical reactions and the temperature field using chemically sensitive and temperature-sensitive particles. This approach will become widely implemented to solve microscale flows, such as for blood in microvascular vessels and 3D complex flows in microfluidic devices.
ACKNOWLEDGMENTS
National Science Council of the Republic of China partially supported this work under Contract Nos. NSC 96-2628-E-002-255-MY3, NSC 96-2628-E-002-257-MY3, and NSC 96-2218-E-002-041.
References
- Jiang X., Ng J. M. K., Stroock A. D., Dertinger S. K. W., and Whitesides G. M., J. Am. Chem. Soc. 125, 5294 (2003). 10.1021/ja034566+ [DOI] [PubMed] [Google Scholar]
- Wagner J. and Köhler J. M., Nano Lett. 5, 685 (2005). 10.1021/nl050097t [DOI] [PubMed] [Google Scholar]
- Goluch E. D., Nam J. M., Georganopoulou D. G., Chiesl T. N., Shaikh K. A., Ryu K. S., Barron A. E., Mirkin C. A., and Liu C., Lab Chip 6, 1293 (2006). 10.1039/b606294f [DOI] [PubMed] [Google Scholar]
- Lee S. J. and Kim S., Microfluid. Nanofluid. 6, 577 (2009). 10.1007/s10404-009-0409-6 [DOI] [Google Scholar]
- Tung K. Y., Lee C. C., and Yang J. T., Microfluid. Nanofluid. 7, 545 (2009). 10.1007/s10404-009-0415-8 [DOI] [Google Scholar]
- Lindken R., Rossi M., Große S., and Westerweel J., Lab Chip 9, 2551 (2009). 10.1039/b906558j [DOI] [PubMed] [Google Scholar]
- Peterson S. D., Chuang H. S., and Wereley S. T., Meas. Sci. Technol. 19, 115406 (2008). 10.1088/0957-0233/19/11/115406 [DOI] [Google Scholar]
- Omrane A., Santesson S., Aldén M., and Nilsson S., Lab Chip 4, 287 (2004). 10.1039/b402440k [DOI] [PubMed] [Google Scholar]
- Duffy C. F., MacCraith B., Diamond D., O’Kennedy R., and Arriaga E. A., Lab Chip 6, 1007 (2006). 10.1039/b601896c [DOI] [PubMed] [Google Scholar]
- P. B.Howell, Jr., Golden J. P., Hilliard L. R., Erickson J. S., Mott D. R., and Ligler F. S., Lab Chip 8, 1097 (2008). 10.1039/b719381e [DOI] [PMC free article] [PubMed] [Google Scholar]
- Pal S., Kim M. J., and Song J. M., Lab Chip 8, 1332 (2008). 10.1039/b804066d [DOI] [PubMed] [Google Scholar]
- Atalay Y. T., Witters D., Vermeir S., Vergauwe N., Verboven P., Nicolaï B., and Lammertyn J., Biomicrofluidics 3, 044103 (2009). 10.1063/1.3250304 [DOI] [PMC free article] [PubMed] [Google Scholar]
- Baltussen M., Anderson P., Bosab F., and den Toonder J., Lab Chip 9, 2326 (2009). 10.1039/b901660k [DOI] [PubMed] [Google Scholar]
- Barz D. P. J., Zadeh H. F., and Ehrhard P., AIChE J. 54, 381 (2008). 10.1002/aic.11382 [DOI] [Google Scholar]
- Stroock A. D., Dertinger S. K. W., Ajdari A., Mezić I., Stone H. A., and Whitesides G. M., Science 295, 647 (2002). 10.1126/science.1066238 [DOI] [PubMed] [Google Scholar]
- Yang J. T., Chen C. K., Hu I. C., and Lyu P. C., J. Microelectromech. Syst. 16, 826 (2007). 10.1109/JMEMS.2007.899338 [DOI] [Google Scholar]
- Yang J. T., Fang W. F., and Tung K. Y., Chem. Eng. Sci. 63, 1871 (2008). 10.1016/j.ces.2007.12.027 [DOI] [Google Scholar]
- Park J. S., Choi C. K., and Kihm K. D., Exp. Fluids 37, 105 (2004). [Google Scholar]
- Hoffmann M., Schlüter M., and Räbiger N., Chem. Eng. Sci. 61, 2968 (2006). 10.1016/j.ces.2005.11.029 [DOI] [Google Scholar]
- Fang W. F. and Yang J. T., Sens. Actuators B 140, 629 (2009). 10.1016/j.snb.2009.05.007 [DOI] [Google Scholar]
- den Toonder J., Bos F., Broer D., Filippini L., Gillies M., de Goede J., Mol T., Reijme N., Talen W., Wilderbeek H., Khatavkar V., and Anderson P., Lab Chip 8, 533 (2008). 10.1039/b717681c [DOI] [PubMed] [Google Scholar]
- Lee S. H., van Noort D., Lee J. Y., Zhang B. T., and Park T. H., Lab Chip 9, 479 (2009). 10.1039/b814371d [DOI] [PubMed] [Google Scholar]
- Meinhart C. D., Wereley S. T., and Santiago J. G., Exp. Fluids 27, 414 (1999). 10.1007/s003480050366 [DOI] [Google Scholar]
- Yang J. T., Huang K. J., and Lin Y. C., Lab Chip 5, 1140 (2005). 10.1039/b500972c [DOI] [PubMed] [Google Scholar]
- Patankar S. V., Numerical Heat Transfer and Fluid Flow (Hemisphere, New York, 1980), pp. 41–135. [Google Scholar]
- Gonzalez R. C., Woods R. E., and Eddins S. L., Digital Image Processing Using MATLAB, 1st ed. (Prentice-Hall, Englewood Cliffs, NJ, 2004), Chap. 10, pp. 448–453. [Google Scholar]


