Abstract
Exposure to xenoestrogens occurs against a backdrop to physiological levels of endogenous estrogens. Endogenous estrogen levels vary from low levels in early childhood to high levels during pregnancy and in young women. However, few studies have addressed how xenoestrogens interact with endogenous estrogens. The current study was designed to characterize the individual dose-response curves of estradiol-17β (E2), bisphenol A (BPA), tetrabromo-bisphenol A (TBBPA), and bisphenol AF (BPAF, 4,4'-hexafluoroisopropylidene diphenol) on estrogen-dependent luciferase expression in T47D-KBluc cells and to determine how binary (8 × 8 factorial) and ternary (4 × 4 × 4 factorial) mixtures of an endogenous estrogen (E2) interact with BPA and/or BPAF. Log EC50 and hillslope values with SEs, respectively, for individual compounds were as follows: E2, −12.10M ± 0.06071, 0.7702 ± 0.1739; BPA, −6.679M ± 0.08505, 1.194 ± 0.2137; and BPAF, −7.648M ± 0.05527, 1.273 ± 0.1739. TBBPA was not evaluated in mixture studies because of its minimally estrogenic response at 3 ×10⁻⁵M and elicited cytotoxicity at higher concentrations. Both the binary mixtures of E2 with BPA and BPAF and the ternary mixture of E2, BPA, and BPAF behaved in an additive manner. For binary mixtures, as E2 concentration increased, higher concentrations of BPA and BPAF were necessary to induce a significant increase in the estrogenic response. Understanding the behavior of mixture interactions of xenoestrogens, like BPA and BPAF, with endogenous estrogens will allow a better assessment of the potential risk associated with exposure to these chemicals, individually or as mixtures.
Keywords: in vitro, mixtures, estradiol, bisphenol A, mixtures, bisphenol AF
Bisphenol A (BPA) is a high production volume chemical used to manufacture polycarbonate plastics, as well as epoxy resins used as protective liners in metallic cans, and as an additive in various plastics. Tetrabromo-bisphenol A (TBBPA) is used primarily as a flame retardant in epoxy resin circuit boards, electronic enclosures, paper, plastic, and textiles (NTP, 2002; Olsen et al., 2003) and bisphenol AF (BPAF) is used in fluoroelastomers, polyamides, polyesters, polycarbonate copolymers, and other specialty polymers (Akahori et al., 2008; NTP, 2008; Perez et al., 1998). BPA and BPAF have been shown to induce estrogen-dependent responses in vivo and in vitro via binding to estrogen receptor (ER) ERα and ERβ (Akahori et al., 2008; Bay et al., 2004; Wetherill et al., 2007; Yamasaki et al., 2003), whereas studies on the estrogenicity of TBBPA in vitro are inconsistent. Both BPAF and TBBPA have been nominated for toxicological characterization by the NTP, National Institute of Environmental Health Sciences (NTP, 2002, 2008). Exposure to BPA and BPAF may co-occur as there is concern of potential exposure of the general population to BPAF from its use as a monomer of polycarbonate and other polymers and resins and the use of fluoroelastomer gaskets and hoses in food processing equipment; however, information on specific use and potential exposure were not available (NTP, 2008). Exposure of BPA and its analogs to human and wildlife populations is widespread and well documented (Bay et al., 2004; CERHR, 2008; NTP, 2008); but association of exposure to these compounds with adverse health effects remains controversial.
In different life stages, environmental estrogen exposures would occur concurrently with endogenous hormones. Furthermore, humans display widely varying concentrations of circulating estradiol-17β (E2) depending on their gender and life stage. For example, children have circulating E2 concentrations ranging from 0.3 to 50pM (0.08–13 ng/l) with boys falling on the lower end of the range (Aksglaede et al., 2006; Bay et al., 2004; Ikegami et al., 2001; Klein et al., 1994). During pregnancy, especially in late pregnancy, circulating concentrations of E2 are as high as 60–88nM (16.35–24 μg/l) (Smith et al., 2009; Troisi et al., 2003a, 2003b). Therefore, data examining the interaction of environmental estrogens like BPA or its analogues with the ER when combined with endogenous estrogens such as E2 are needed to provide a more accurate representation of the potential effects of these anthropogenic chemicals in vivo. The objective of the current study was to assess in vitro mixtures of BPA and BPAF with a wide range of concentrations of the natural estrogen E2 to elucidate whether these mixtures behave, in an additive, synergistic, or antagonistic manner. The study was also designed to determine concentrations of BPA and BPAF that enhanced the estrogenic effect of increasing concentrations of E2 in order to simulate how these xenoestrogens might interact with physiological levels of estrogens during different life stages and for different genders.
Using a transcriptional activation assay, individual compounds and binary and ternary mixtures of an endogenous estrogen (E2) with BPA or its analogues (TBBPA and BPAF) were tested. Dose-response parameters (EC50 and hillslope) obtained from individual chemical experiments were incorporated into a dose-addition model to predict the responses elicited by mixtures of E2 and BPA, E2 and BPAF, and E2, BPA, and BPAF in order to develop a predicted response surface plot. Additionally, EC50 values and mixture concentrations were incorporated into the toxic equivalence (TEQ) model of additivity to develop an estrogen equivalence (EEQ) model, in order to compare the EEQ predictions with those obtained with dose-addition modeling. The TEQ model is a specific type of dose-addition model that assumes same slopes and requires less data to calculate (Safe, 1998a, 1998b; Van den Berg et al., 1998).
Modeled predictions were tested experimentally to determine if the dose-addition model provided accurate predictions of mixture effects and whether predictions based upon the EEQ model differed significantly from dose-addition model. Although several studies have investigated the estrogenic effects of BPA in vitro, few address whether the estrogenic activity of BPA functions in an additive manner with endogenous estrogens. Understanding the behavior of mixture interactions of BPA with endogenous estrogens will allow better assessment of the potential risk of individual xenoestrogen exposures and exposure to mixtures of xenoestrogens.
MATERIALS AND METHODS
Test chemicals.
The following chemicals were tested individually, stated by common name, abbreviation, CAS number, purchase source, purity (as reported by the manufacturer), and IUPAC name. E2 (CAS# 50-28-2, Sigma-Aldrich, 98%, (17β)-estra-1,3,5(10)-triene-3,17-diol); BPA (CAS# 80-05-7, Sigma-Aldrich, 99+%, 4,4'-dihydroxy-2,2-diphenylpropane); TBBPA (CAS# 79-94-7, Sigma-Aldrich, 97%, 2,2′,6,6′-tetrabromo-4,4′-isopropylidenediphenol); BPAF (CAS# 1478-61-1, AccuStandard, 100%, 4,4′-(hexafluoroisopropylidene)diphenol); ICI 182,780 (ICI; CAS# 129453-61-8, ICI Pharmaceuticals (7R,8R,9S,13S,14S,17S)-13-methyl-7-[9-(4,4,5,5,5-pentafluoropentylsulfinyl)nonyl]-6,7,8,9,11,12,14,15,16,17-decahydrocyclopenta[a]phenanthrene-3,17-diol).
T47D-KBluc transcriptional activation assay.
T47D-KBluc cells naturally express both ERα and ERβ and are stably transfected with a triplet estrogen-responsive element promoter-luciferase reporter gene construct. The T47D-KBluc cells are sensitive to potent estrogens like E2, ethynyl estradiol, and diethylstibesterol and also to weaker environmental estrogens like genistein and 4-nonylphenol (Wilson et al., 2004). A brief summary of the T47D-KBluc assay is presented below; please refer to Wilson et al. (2004) for greater detail.
The stock cells (T47D-KBluc, ATCC # CRL-2865) were maintained in 75-cm2 culture flasks with vented caps (Corning 430641) at 37°C, 5% CO2 in RPMI (Gibco 13200-076) growth media supplemented with 10% fetal bovine serum (FBS) (Hyclone #SH30071.03), 2mM glutamine, and 100 U/ml penicillin, 100 μg/ml streptomycin, and 0.25 μg/ml amphotericin. Cell passage numbers 40 through 50 were used during the performance of this study. Stock cells were subcultured once per week onto a new culture flask with fresh growth media and fed at midweek. One week prior to the assay, cells were placed in withdrawal media consisting of RPMI supplemented with 10% dextran-coated charcoal-stripped FBS (Hyclone #SH30068.03) (DCC-FBS RPMI) to remove all estrogens from the culture. Cells were incubated 1 week in withdrawal media with media replacement at midweek before being used in an assay. After incubation in low estrogen media, cells were seeded onto 96-well luminometer plate (Costar 3610) at 104 cells/100 μl/well in 5% DCC-FBS RPMI and allowed to attach overnight. Cells were dosed with test chemical the following day.
Chemical stock solutions were prepared in 100% ethanol in glass amber vials with Teflon-lined caps and stored at room temperature. Dosing solutions were prepared by diluting chemical stocks in fresh 5% DCC-FBS RPMI to desired concentrations. Ethanol concentration did not exceed 0.3%; a vehicle concentration which has been shown to result in no adverse impact on the assay results (Wilson et al., 2004). Chemically treated cells were incubated overnight and harvested the following day. Luciferase activity was determined using a BMG LUMIstar 96-well plate luminometer (BMG Labteck, Durham, NC) and quantified in relative light units (RLUs) (Wilson et al., 2004).
Binary mixtures.
Binary mixtures of E2 with either BPA or BPAF were run in an 8 × 8 factorial design. Each plate had four replicates of an ethanol vehicle control, an ICI (1μM) antagonist control with 100pM E2 or 1μM BPA/BPAF and a positive control of 100pM E2 and 1 μM BPA or BPAF depending on the mixture being tested. The ICI (1μM) antagonist control was used to demonstrate that the observed effect with the test chemical is solely ER mediated. Each plate also had one binary mixture for each point in the 8 × 8 factorial design. Concentrations used encompassed the complete dose-response range for each compound. For E2, the concentrations were as follows: vehicle control, 30fM, 100fM, 300fM, 1pM, 3pM, 10pM, and 30pM. For BPA, the concentrations were vehicle control, 3nM, 10nM, 30nM, 100nM, 300nM, 1μM, and 3μM. For BPAF, the concentrations were vehicle control, 1nM, 3nM, 10nM, 30nM, 100nM, 300nM, and 1μM. The binary mixtures of E2 and BPA had a total of 12 runs (each run is equivalent to one 96-well assay plate), whereas the binary mixtures of E2 and BPAF had a total of 15 runs.
Ternary mixtures.
Ternary mixtures of E2 with BPA and BPAF were tested using a 4 × 4 × 4 factorial design. The ternary mixtures were repeated for a total of six runs. In addition, each run had an ethanol vehicle control and an E2 dose-response curve each with four replicate wells at each concentration. The E2 dose-response curve had the following concentrations: 30fM, 100fM, 300fM, 1pM, 3pM, 10pM, and 100pM. The concentrations used in the ternary mixture were as follows: for E2, 1fM, 30fM, 300fM, and 10pM; for BPA, 1nM, 10nM, 30nM, and 300nM; for BPAF, 300pM, 3nM, 10nM, and 100nM. The concentrations of E2, BPA, and BPAF chosen for the ternary mixtures were 0, 10, 35, and 85% response for each compound. The percent response concentrations used for the ternary mixture ensured that if antagonism or synergism occurred among the chemicals, the mixture spectrum was broad enough to detect such phenomena.
Data and statistical analysis.
RLUs for each run were normalized by converting values to fold induction by dividing the RLU for each well by the average RLU for the ethanol vehicle control. Fold induction values were then log transformed to control for heterogeneity of variance. Log10-transformed fold induction (log-fold) values for each plate (run) were further converted to percent of maximal E2 response using the following procedure. The concurrent E2 curve for each run in log-fold (y-axis) was plotted in GraphPad Prism 5.01 (GraphPad Software, San Diego, CA) versus chemical concentration. Concentration values (x-axis) were log transformed and then a nonlinear regression curve fit analysis (four-parameter logistic regression) were performed on the E2 data using a constrained bottom parameter held constant equal to 0.0. The calculated top parameter (maximal response) of the nonlinear regression analysis for E2 was used to convert the log-fold data into percent response for each test well. Specifically, the log-fold response was divided by the top parameter (in log fold) and then multiplied by 100. Once each run was converted to percent of the maximal E2 response, data from all runs for each chemical were combined.
Percent response data were combined, and observed means were compared with predicated values. Observed and predicted data were plotted in GraphPad Prism using a nonlinear regression curve fit. Dose-addition predicted values were calculated using the concentration addition model (power function written in Microsoft excel format): R = (1/(1 + (1/(POWER((ΣCi/EC50i), average hillslope))))) × 100, where C = concentration of each chemical in mixture/EC50 of said chemical and “i” refers to individual compounds (Rider and LeBlanc, 2005). Data were visualized with three-dimensional response surface plots and scatter plots created with SigmaPlot 11.0 (Systat Software, San Jose, CA). The EEQ model (the EEQ model equation used: EEQ = Σ[E2i] × EQFi + Σ[BPAi] × EQFi + Σ[BPAFi] × EQFi) was modified from the TEQ model used for dioxins and dioxin-like chemicals (Bhavsar et al., 2008; Safe, 1998a, 1998b; Van den Berg et al., 2006). Individual compound estrogen equivalent factors were calculated by dividing the E2 EC50 by each individual compound EC50.
The combined dose-response data for each chemical for all binary and ternary mixture assays were plotted in GraphPad Prism and a nonlinear regression curve fit analysis performed to obtain EC50 and hillslope values. EC50 and hillslope values for each chemical in the binary and ternary mixtures were used to calculate the predicted responses. Statistical analysis to determine if the dose-response curves were different from one another for BPA and BPAF were computed using a sum of squares F-test run (α = 0.05) on bottom, top, log EC50, and hillslope parameters in GraphPad Prism 5.01 (GraphPad Software, San Diego, CA). Statistical calculations of 95% confidence limits (CLs) for binary and ternary mixtures were calculated using Proc Means SAS 9.1 (SAS Institute, Cary, NC). In order to determine at which concentrations BPA or BPAF would induce an observable response in our mixtures with E2, a one-way ANOVA was run on log-transformed fold data at each concentration of E2 within the binary mixtures to determine the “no-observed-effect concentration” (NOEC) for BPA or BPAF through Proc GLM LS Means using SAS 9.1.
RESULTS
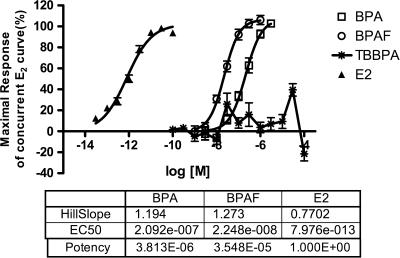
Dose-response curves for individual compounds, E2, BPA, BPAF, and TBBPA, were plotted in Figure 1. The log EC50 and hillslope mean data with SE, respectively, were as follows: E2, −12.10M ± 0.06071, 0.7702 ± 0.1739; BPA, −6.679M ± 0.08505, 1.194 ± 0.2137; and BPAF, −7.648M ± 0.05527, 1.273 ± 0.1739. The log EC50 values were statically different between BPA and BPAF (p < 0.0001) with BPAF being the slightly more potent environmental estrogen. No statistical difference was found in top, bottom, and hillslope parameters for BPAF and BPA response curves. TBBPA induced a weak, equivocal estrogenic response in the T47D-KBluc assay only at a concentration of 30μM. Activity in the assay then declined at 100μM because of cytotoxicity. Therefore, because of its ambiguous estrogenicity, TBBPA was excluded from further evaluation.
FIG. 1.
T47D-KBluc assay ER transcriptional activation dose-response of individual chemicals, E2, BPA, BPAF, and TBBPA, fitted with a nonlinear regression (variable slope) curve. The EC50 and hillslope values were calculated through GraphPad Prism 5.01. Relative potency calculated by dividing EC50 values of individual compounds by E2 EC50 value. Data are plotted as mean ± SE. E2 n = 12; BPA n = 12; BPAF n = 15; TBBPA n = 15.
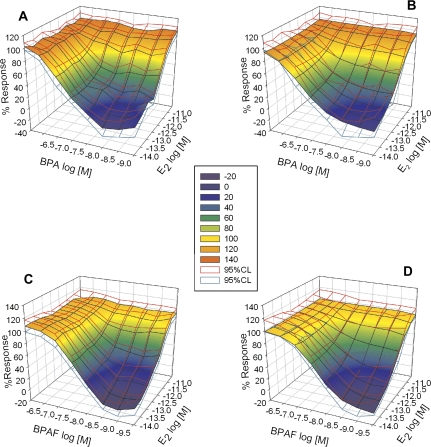
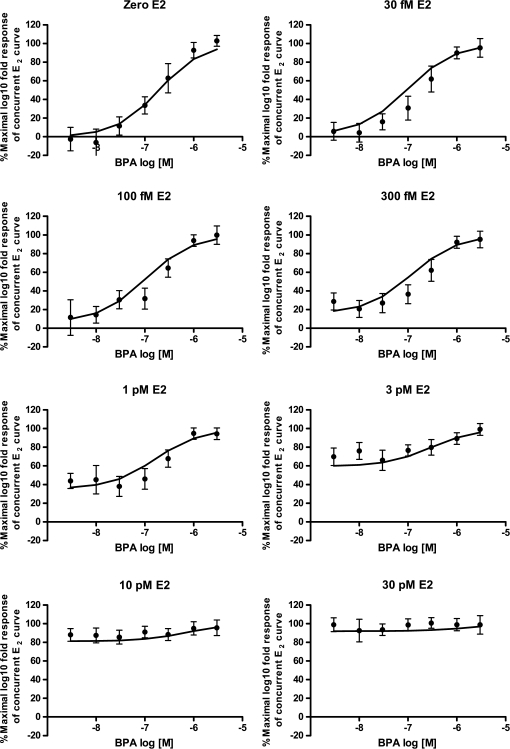
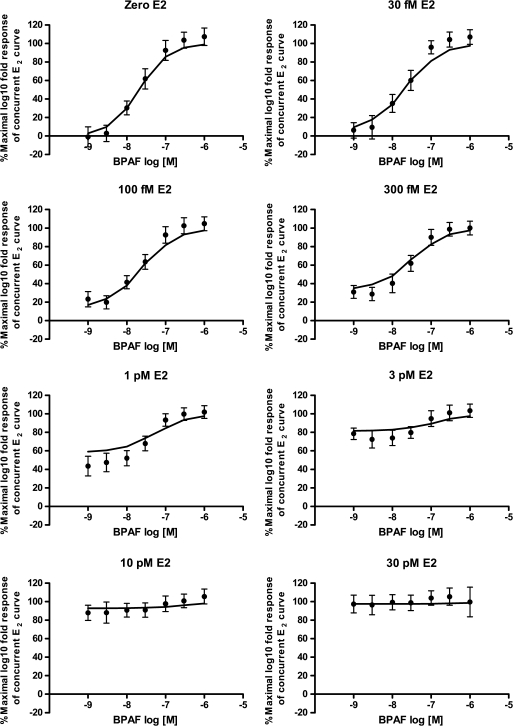
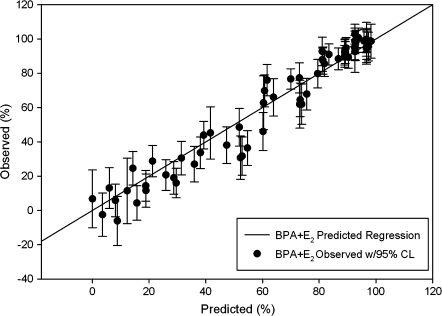
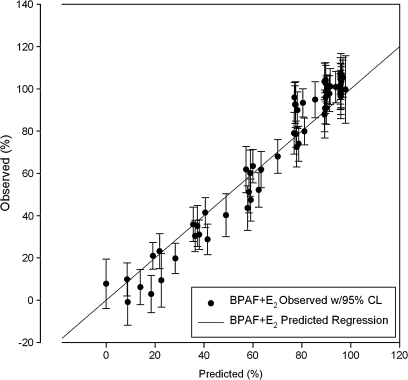
Overall for both test compounds, the dose-addition and EEQ models accurately predicted the observed response of the binary mixtures. Figures 2A and 2C, 3, and 4 depict the observed data (means with 95% CLs) for the binary mixtures of BPA with E2 and BPAF with E2, respectively. There were some areas of the response surface curves where the model slightly over- or underpredicted the experimental response. Overlaying the predicted values with the 95% CLs of the observed data indicate that the deviations from the predicted response were infrequent for both BPA and BPAF (Figs. 2B and D, 3, and 4). The scatter plots of the observed means for the binary mixtures of BPA and BPAF both compared well with the predicted regression lines of the EEQ model (BPA r2 = 0.971, BPAF r2 = 0.969) with only minor deviations from predicted values (Figs. 5 and 6).
FIG. 2.
Predictions of dose-addition data generally fall within 95% CLs of the observed data. Observed (A and C) and dose-addition modeled data (B and D) compared with 95% CLs from observed data (red = upper CL, dark cyan = lower CL) for binary mixtures of BPA plus E2 (A and B) and BPAF plus E2 (C and D).
FIG. 3.
Predictions of dose-addition data generally fall within 95% CLs of the observed data. Binary mixture response of E2 and BPA, fitted with a nonlinear regression (variable slope) curve fit and 95% CLs. Line represents the predicted dose-addition model.
FIG. 4.
Predictions of dose-addition data generally fall within 95% CLs of the observed data. Binary mixture response of E2 and BPAF, fitted with a nonlinear regression (variable slope) curve fit and 95% CLs. Line represents the predicted dose-addition model.
FIG. 5.
Binary mixture of BPA plus E2 shows good correlation between predicted and observed data. Regression line plots the predicted EEQ of the binary mixtures for both axes x and y. Individual points plot the means with 95% CLs of observed results on the y-axis and predicted EEQ on the x-axis. The scatter allows for the evaluation of the efficacy of the EEQ model.
FIG. 6.
Binary mixture of BPAF plus E2 shows good correlation between predicted and observed data. Regression line plots the predicted EEQ of the binary mixtures for both axis x and y. Individual points plot the means with 95% CL of observed results on the y-axis and predicted EEQ on the x-axis. The scatter allows for the evaluation of the efficacy of the EEQ model.
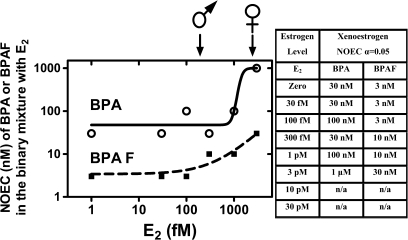
With an increase in E2 concentrations, both the BPA and BPAF dose-response curves shifted to the right resulting in increasing EC50 values with each E2 increment. To further evaluate the impact of BPA or BPAF on the E2 dose-response, the NOECs for binary mixtures of BPA or BPAF with E2 were determined as increasing concentrations of each test compound were added (Fig. 7).
FIG. 7.
The NOEC for E2 plus BPA or BPAF. The NOECs are for BPA or BPAF when combined with the stated concentrations of E2 and indicate which concentration of BPA or BPAF is necessary to induce a statistically significant response in the binary mixture. Increasing levels of BPA or BPAF are required to enhance the estrogenicity of the in vitro mixture as the E2 levels increase. Arrows indicate lowest measured E2 levels in humans and prepubertal boys and girls, respectively. T47D-KBluc assay reached saturation and maximal response was induced; hence, NOEC cannot be calculated; n/a, not applicable.
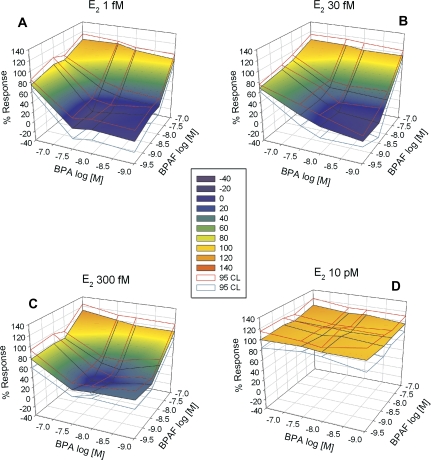
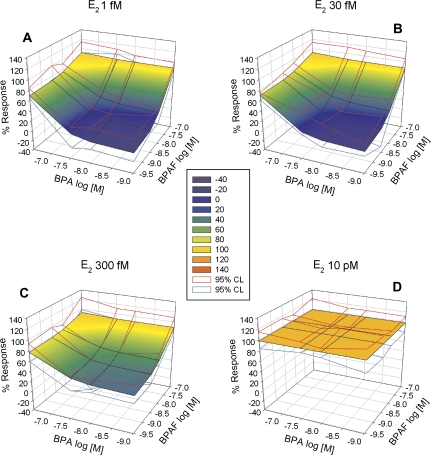
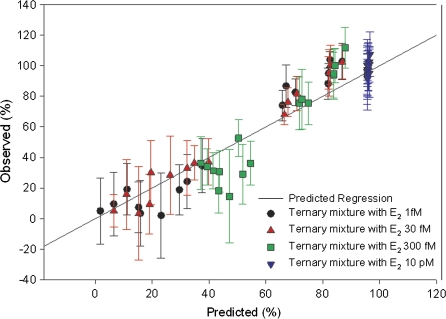
The ternary mixture also behaved in a dose-additive manner (Fig. 8). At an E2 concentration of 10pM, the model system reached saturation, and addition of BPA and BPAF at any higher concentrations did not produce any additional increase in activity. Similar to the predicted results from the binary mixtures, some areas of the ternary response surface curve were slightly different with minor deviations from the observed responses (Fig. 9). The majority of those differences occurred at an E2 concentration of 300fM. The EEQ model predicted the observed responses as well as the dose-addition model (Fig. 10) and observed means compared well with the predicted regression line (r2 = 0.949).
FIG. 8.
Observed ternary mixtures of BPA and BPAF plus E2 (A = 1fM, B = 30fM, C = 300fM, and D = 10pM) a with 95% CLs from observed data (red = upper CL, dark cyan = lower CL).
FIG. 9.
Predictions of dose-addition data generally fall within 95% CLs of the observed data. Dose-addition predictions for ternary mixtures of BPA and BPAF plus E2 (A = 1fM, B = 30fM, C = 300fM, and D = 10pM) a with 95% CLs from observed data (red = upper CL, dark cyan = lower CL).
FIG. 10.
Ternary mixture of BPA and BPAF plus E2 shows good correlation between predicted and observed data. Regression line plots the predicted EEQ of the ternary mixture for both axes x and y. Individual points plot the mean with 95% CLs of observed results on the y-axis and predicted EEQ on the x-axis. Black circles correspond to ternary mixtures with 1fM E2; red triangles correspond to ternary mixtures with 30fM E2; blue squares correspond to ternary mixtures with 300fM E2; and black cross with green lines correspond to ternary mixtures with 10pM E2. The scatter allows for the evaluation of the efficacy of the EEQ model.
DISCUSSION
Understanding the behavior of mixture interactions of xenoestrogens like BPA and BPAF with endogenous estrogens is important in assessing their potential risk to humans. The current study characterized the dose-response effects of E2, BPA, BPAF, and TBBPA in the T47D-KBluc transcriptional activation assay. Based on the individual chemical dose-response analyses, binary and ternary mixtures of an endogenous estrogen (E2) with BPA or BPAF were tested and their interactions evaluated. The current study demonstrates that the binary and ternary mixtures of selected estrogens behaved in a dose-additive manner. Both the dose-addition model and the EEQ model predicted the mixtures results well. Additionally, NOECs of the binary mixtures of BPA and BPAF with E2 demonstrates that increasing levels of BPA or BPAF are required to enhance the estrogenicity of the in vitro mixture as the E2 levels increase. There was no evidence that BPA or BPAF acted synergistically or in an antagonistic manner when combined with E2.
Estrogens have numerous functions in vertebrates. In males, estrogens are essential for normal testicular (Hess et al., 2001), prostate (Chen et al., 2009), brain (McCarthy et al., 2008), and behavioral development (McCarthy, 2008). Estrogens play a role in adipocyte development and function as well as in bone growth and epiphyseal plate closure in both sexes (Cooke and Naaz, 2004; Syed and Khosla, 2005; Vandenput and Ohlsson, 2009). In females, the role of estrogens is fundamental during puberty and reproductive cycling (Johnson and Everitt, 2004; Knobil and Neill, 1993). An important factor when investigating environmental estrogens is how they interact with the varying concentrations of endogenous estrogens in different genders and at different human life stages. The circulating estrogen concentration varies at different stages of development and maturation. For reference, at birth, E2 plasma concentrations are extremely high in both male and female neonates (5–6 μg/l, approximately 18.4–22nM) (Johnson and Everitt, 2004; Rohrmann et al., 2009; Shibata et al., 2002) and adult females can fluctuate from approximately 140pM (38 ng/l) (Finstad et al., 2009; Hatta and Nagaya, 2009; Knobil and Neill, 1993; Lemieux et al., 2009) to 455pM (124 ng/l) (Hatta and Nagaya, 2009; Knobil and Neill, 1993; Lemieux et al., 2009) depending on the stage in their menstrual cycle. Children have “low” circulating estradiol concentrations, from 0.3 to 50pM (0.08–13 ng/l) (Aksglaede et al., 2006; Bay et al., 2004; Ikegami et al., 2001; Klein et al., 1994). Additionally, because the reported E2 concentrations in children fall in the lower picomolar range, this suggest that high circulating levels of BPA (>1μM BPA) would be necessary to induce an effect. However, the above suggestion does not account for several important factors, including (1) a considerable percentage of the E2 in serum is bound to SHBG, (2) a small proportion of BPA exists in serum as “free” BPA whereas most BPA exists in the inactive glucuronidated form, and (3) some of the “free” BPA also is bound to plasma proteins. For these reasons, the stated circulating serum E2 and BPA levels may not necessarily reflect the E2 and BPA concentration levels found at the cellular and subcellular level interacting with ERs. Several studies measuring BPA levels in human blood using High Performance Liquid Chromatography/Mass Spectrometry/Mass Spectrometry showed BPA blood levels in adults under 1 μg/l (CERHR, 2008; Volkel et al., 2005). It is also noted that there is a dearth of high-quality data for human serum and tissue levels of “free” BPA and glucuronidated BPA, NTP/NIH studies are currently investigating these gaps in the data.
In our dose-response analyses for E2, BPA, and BPAF, a full response curve was used to ensure that relevant concentrations of each compound were incorporated into the binary and ternary mixtures. When examining the dose-response curves, both BPA and BPAF have similar responses with BPAF being the slightly more potent environmental estrogen. Relative potency of BPA and BPAF to E2 was evaluated (Fig. 1) showing BPA six orders of magnitude weaker than E2 and BPAF was five orders of magnitude weaker than E2. These results were corroborated in another study where the EC50s of BPAF and BPA were 0.05 × 10⁻⁶M and 0.63 × 10⁻⁶M, respectively, and corresponded well with observations from other published studies (Kitamura et al., 2005; Olsen et al., 2003).
TBBPA induced an estrogenic response in our assay only at the concentration of 3 ×10⁻⁵M (approximately 40% response) followed by a sharp drop in activity because of cytotoxicity at the next highest concentration. Therefore, no clear dose-response was observed. Others studies have shown it to behave like an estrogen albeit only at high concentrations (Kitamura et al., 2005; Li et al., 2010; NTP, 2002; Olsen et al., 2003). The maximal concentration of 1 ×10⁻⁴M used in the T47D-KBluc assay fell within the activity range reported by Kitamura et al. (2005) of 1 × 10⁻⁶ to 1 × 10⁻⁴M but was cytotoxic in our assay. TBBPA has been shown to be a partial agonist with a low affinity to the ER, especially in the presence of binding proteins in serum, which corroborates TBBPA results seen in MCF-7 and T47D-KBluc cell lines which each requires 5% FBS (Kitamura et al., 2005; Olsen et al., 2003; Samuelsen et al., 2001).
The overall trends reflected in the surface response plots for both binary mixtures with BPA or BPAF are consistent for both predicted and observed responses. Both the dose-addition model and the EEQ model accurately predicted the observed responses. The EC50 results for BPA and BPAF gradually increased as E2 concentration increased in the mixture, as expected. At E2 concentrations of 3pM and greater in the binary mixtures with BPA/BPAF, EC50 values could not be calculated because the curves approached maximal induction and flattened (Figs. 3 and 4).
The pattern observed for the NOECs was that as E2 concentration increased so did the concentration of BPA or BPAF needed to significantly enhance the estrogenic response of the mixture. The NOECs are for BPA or BPAF when combined with the stated concentrations of E2 and indicate which concentration of BPA or BPAF is necessary to induce a statistically significant response in the binary mixture. At the lowest E2 concentration tested of 30fM, the addition of 30nM BPA or 3nM BPAF or lower concentrations produced no change in the NOEC. At an E2 concentration of 3pM, the T47D-KBluc model system for the binary mixtures approached saturation and maximal response induction was reached. The NOEC at 3pM E2 for BPA was 1μM and 30nM for BPAF, meaning that a concentration higher than 1μM BPA and 30nM BPAF would be needed to induce statistically significant increases in binding response to the ER. At E2 concentration of 10pM and greater, the model was saturated, maximal induction was achieved, and further addition of BPA or BPAF induced no change in the assay's response (see Fig. 7).
Ternary mixtures were accurately predicted by the dose-addition model. The pattern observed in the binary mixtures was also evident in the ternary mixtures. The individual compounds in the ternary mixture behaved in a dose-additive manner; as individual concentrations increased, so did the ER-mediated activity in the assay. Similar to the binary mixtures, the majority of the variance in the predictions occurred at the higher concentrations of the ternary mixture. The increased variance found at the top portion of response curves may explain why the majority of missed predictions occurred at 300fM as this dose was approaching saturation in the model system. At the ternary mixture, E2 concentration of 10pM, the model system was saturated and maximal response had occurred.
The EEQ model of additivity is a modification of the TEQ model used for risk assessment of dioxin-like compounds (Safe, 1998b; Van den Berg et al., 2006). The TEQ model has been used for the last two decades in risk assessment of closely related chemicals with identical mechanisms of action but different potencies (Bhavsar et al., 2008; Finley et al., 2003; Hong et al., 2009). The TEQ/EEQ model has been shown to work well with in vitro systems and has been suggested to be most applicable for hazard/risk assessment of compounds that act through a common receptor (Safe,1998a, 1998b; Van den Berg et al., 2006). The EEQ model predictions for both the binary and ternary mixtures agreed with the observed mixture results. The differences in the EEQ model predictions compared with observed responses were similar to those observed with the dose-addition model. The EEQ model can be beneficial for risk assessment of environmental estrogens as it requires less data to calculate.
This study investigated interactions between compounds mediated through the ER in the T47D-KBluc in vitro assay system. Binary and ternary mixtures of an endogenous estrogen (E2) with exogenous environmental estrogens (BPA and BPAF) were tested. The results suggest that the binary and ternary mixtures of E2, BPA, and BPAF can be modeled by the dose-addition and EEQ models of additivity. Results indicate that both additive models would be appropriate for predictions of environmental estrogen mixtures. The data suggest that at higher concentrations of E2, higher BPA or BPAF concentrations would be needed to induce an effect. In terms of significant interactions in mixtures with BPA or BPAF and endogenous estrogens, the results of this study would suggest greater concern in scenarios when endogenous E2 concentrations were low as in prepubertal children and of lesser concern during pregnancy or in cycling women or women on hormone replacement therapies when endogenous E2 concentrations are high. These mixture studies are currently being extended to include several of the estrogens listed on Environmental Protection Agency's drinking water contaminant candidate list 3 (CCL3). The CCL3 are contaminants that are currently not subject to any proposed or promulgated national primary drinking water regulations, but which are known or anticipated to occur in public water systems, and which may require future regulation under the Safe Drinking Water Act. These studies will identify how environmentally relevant concentrations of mixtures will interact and will determine if the mixtures display EEQ values that are likely to induce estrogen-like effects in aquatic vertebrates and whether these will potentially be of concern to human health and the environment.
FUNDING
North Carolina State University/Environmental Protection Agency Cooperative Training Program in Environmental Sciences Research (Training Agreement CT833235-01-0 with North Carolina State University and the NTP/National Institute of Environmental Health Sciences/EPA Interagency RW75-92285501-1).
Acknowledgments
Authors would like to thank the department of Molecular Biomedical Sciences at North Carolina State University College of Veterinary Medicine and the Reproductive Toxicology branch at the Toxicology Assessment Division of the U.S. Environmental Protection Agency for facility, equipment, and supply support. Authors would like to also thank Rochelle Tyl, Phillip Hartig, and Cynthia Rider for providing technical review for clearance of the manuscript and Christy Lambright for technical support.
References
- Akahori Y, Nakai M, Yamasaki K, Takatsuki M, Shimohigashi Y, Ohtaki M. Relationship between the results of in vitro receptor binding assay to human estrogen receptor alpha and in vivo uterotrophic assay: comparative study with 65 selected chemicals. Toxicol. In Vitro. 2008;22:225–231. doi: 10.1016/j.tiv.2007.08.004. [DOI] [PubMed] [Google Scholar]
- Aksglaede L, Juul A, Leffers H, Skakkebaek NE, Andersson AM. The sensitivity of the child to sex steroids: possible impact of exogenous estrogens. Hum. Reprod. Update. 2006;12:341–349. doi: 10.1093/humupd/dml018. [DOI] [PubMed] [Google Scholar]
- Bay K, Andersson AM, Skakkebaek NE. Estradiol levels in prepubertal boys and girls—analytical challenges. Int. J. Androl. 2004;27:266–273. doi: 10.1111/j.1365-2605.2004.00487.x. [DOI] [PubMed] [Google Scholar]
- Bhavsar SP, Reiner EJ, Hayton A, Fletcher R, MacPherson K. Converting toxic equivalents (TEQ) of dioxins and dioxin-like compounds in fish from one toxic equivalency factor (TEF) scheme to another. Environ. Int. 2008;34:915–921. doi: 10.1016/j.envint.2008.02.001. [DOI] [PubMed] [Google Scholar]
- Center for the Evaluation of Risks to Human Reproduction (CERHR) NTP-CERHR Monograph on the Potential Human Reproductive and Developmental Effects of Bisphenol A. Research Triangle Park, NC: NIEHS; 2008. [Google Scholar]
- Chen M, Hsu I, Wolfe A, Radovick S, Huang KH, Yu SQ, Chang CS, Messing EM, Yeh SY. Defects of prostate development and reproductive system in the estrogen receptor-alpha null male mice. Endocrinology. 2009;150:251–259. doi: 10.1210/en.2008-0044. [DOI] [PMC free article] [PubMed] [Google Scholar]
- Cooke PS, Naaz A. Role of estrogens in adipocyte development and function. Exp. Biol. Med. 2004;229:1127–1135. doi: 10.1177/153537020422901107. [DOI] [PubMed] [Google Scholar]
- Finley BL, Connor KT, Scott PK. The use of toxic equivalency factor distributions in probabilistic risk assessments for dioxins, furans, and PCBs. J. Toxicol. Environ. Health. 2003;66:533–550. doi: 10.1080/15287390306353. [DOI] [PubMed] [Google Scholar]
- Finstad SE, Emaus A, Potischman N, Barrett E, Furberg AS, Ellison PT, Jasienska G, Thune I. Influence of birth weight and adult body composition on 17 beta-estradiol levels in young women. Cancer Causes Control. 2009;20:233–242. doi: 10.1007/s10552-008-9238-2. [DOI] [PubMed] [Google Scholar]
- Hatta T, Nagaya K. Menstrual cycle phase effects on memory and Stroop task performance. Arch. Sex Behav. 2009;38:821–827. doi: 10.1007/s10508-008-9445-7. [DOI] [PubMed] [Google Scholar]
- Hess RA, Bunick D, Bahr J. Oestrogen, its receptors and function in the male reproductive tract—a review. Mol. Cell. Endocrinol. 2001;178:29–38. doi: 10.1016/s0303-7207(01)00412-9. [DOI] [PubMed] [Google Scholar]
- Hong BL, Garabrant D, Hedgeman E, Demond A, Gillespie B, Chen QX, Chang CW, Towey T, Knutson K, Franzblau A, et al. Impact of WHO 2005 revised toxic equivalency factors for dioxins on the TEQs in serum, household dust and soil. Chemosphere. 2009;76:727–733. doi: 10.1016/j.chemosphere.2009.05.034. [DOI] [PubMed] [Google Scholar]
- Ikegami S, Moriwake T, Tanaka H, Inoue M, Kubo T, Suzuki S, Kanzaki S, Seino Y. An ultrasensitive assay revealed age-related changes in serum oestradiol at low concentrations in both sexes from infancy to puberty. Clin. Endocrinol. 2001;55:789–795. doi: 10.1046/j.1365-2265.2001.01416.x. [DOI] [PubMed] [Google Scholar]
- Johnson MH, Everitt BJ. Essential Reproduciton. 5th ed. Williston, VT: Blackwell Publishing; 2004. [Google Scholar]
- Kitamura S, Suzuki T, Sanoh S, Kohta R, Jinno N, Sugihara K, Yoshihara S, Fujimoto N, Watanabe H, Ohta S. Comparative study of the endocrine-disrupting activity of bisphenol A and 19 related compounds. Toxicol. Sci. 2005;84:249–259. doi: 10.1093/toxsci/kfi074. [DOI] [PubMed] [Google Scholar]
- Klein KO, Baron J, Colli MJ, Mcdonnell DP, Cutler GB. Estrogen-levels in childhood determined by an ultrasensitive recombinant cell bioassay. J. Clin. Invest. 1994;94:2475–2480. doi: 10.1172/JCI117616. [DOI] [PMC free article] [PubMed] [Google Scholar]
- Knobil E, Neill JD. The Physiology of Reproduction. New York: Raven Press; 1993. [Google Scholar]
- Lemieux C, Cloutier I, Tanguay JF. Menstrual cycle influences endothelial progenitor cell regulation: a link to gender differences in vascular protection? Int. J. Cardiol. 2009;136:200–210. doi: 10.1016/j.ijcard.2008.04.054. [DOI] [PubMed] [Google Scholar]
- Li J, Ma M, Wang ZJ. In vitro profiling of endocrine disrupting effects of phenols. Toxicol. In Vitro. 2010;24:201–207. doi: 10.1016/j.tiv.2009.09.008. [DOI] [PubMed] [Google Scholar]
- McCarthy MM. Estradiol and the developing brain. Physiol. Rev. 2008;88:91–124. doi: 10.1152/physrev.00010.2007. [DOI] [PMC free article] [PubMed] [Google Scholar]
- McCarthy MM, Schwarz JM, Wright CL, Dean SL. Mechanisms mediating oestradiol modulation of the developing brain. J. Neuroendocrinol. 2008;20:777–783. doi: 10.1111/j.1365-2826.2008.01723.x. [DOI] [PMC free article] [PubMed] [Google Scholar]
- National Toxicology Program (NTP) Tetrabromobisphenol A [79-94-7]—Review of Toxicological Literature. Research Triangle Park, NC: NIEHS; 2002. [Google Scholar]
- National Toxicology Program (NTP) Chemical Information Profile for Bisphenol AF [1478-61-4] Research Triangle Park, NC: NIEHS; 2008. [Google Scholar]
- Olsen CM, Meussen-Elholm ETM, Samuelsen M, Holme JA, Hongslo JK. Effects of the environmental oestrogens bisphenol A, tetrachlorobisphenol A, tetrabromobisphenol A, 4-hydroxybiphenyl and 4,4 '-dihydroxybiphenyl on oestrogen receptor binding, cell proliferation and regulation of oestrogen sensitive proteins in the human breast cancer cell line MCF-7. Pharmacol. Toxicol. 2003;92:180–188. doi: 10.1034/j.1600-0773.2003.920408.x. [DOI] [PubMed] [Google Scholar]
- Perez P, Pulgar R, Olea-Serrano F, Villalobos M, Rivas A, Metzler M, Pedraza V, Olea N. Environ. Health Perspect. 106. 1998. The estrogenicity of bisphenol A-related diphenylalkanes with various substituents at the central carbon and the hydroxy groups; pp. 167–174. [DOI] [PMC free article] [PubMed] [Google Scholar]
- Rider CV, LeBlanc GA. An integrated addition and interaction model for assessing toxicity of chemical mixtures. Toxicol. Sci. 2005;87:520–528. doi: 10.1093/toxsci/kfi247. [DOI] [PubMed] [Google Scholar]
- Rohrmann S, Sutcliffe CG, Bienstock JL, Monsegue D, Akereyeni F, Bradwin G, Rifai N, Pollak MN, Agurs-Collins T, Platz EA. Racial variation in sex steroid hormones and the insulin-like growth factor axis in umbilical cord blood of male neonates. Cancer Epidemiol. Biomarkers Prev. 2009;18:1484–1491. doi: 10.1158/1055-9965.EPI-08-0817. [DOI] [PMC free article] [PubMed] [Google Scholar]
- Safe SH. Hazard and risk assessment of chemical mixtures using the toxic equivalency factor approach. Environ. Health Perspect. 1998a;106:1051–1058. doi: 10.1289/ehp.98106s41051. [DOI] [PMC free article] [PubMed] [Google Scholar]
- Safe SH. Development validation and problems with the toxic equivalency factor approach for risk assessment of dioxins and related compounds. J. Anim. Sci. 1998b;76:134–141. doi: 10.2527/1998.761134x. [DOI] [PubMed] [Google Scholar]
- Samuelsen M, Olsen C, Holme JA, Meussen-Elholm E, Bergmann A, Hongslo JK. Estrogen-like properties of brominated analogs of bisphenol A in the MCF-7 human breast cancer cell line. Cell Biol. Toxicol. 2001;17:139–151. doi: 10.1023/a:1011974012602. [DOI] [PubMed] [Google Scholar]
- Shibata A, Harris DT, Billings PR. Concentrations of estrogens and IGFs in umbilical cord blood plasma: a comparison among Caucasian, Hispanic, and Asian-American females. J. Clin. Endocrinol. Metab. 2002;87:810–815. doi: 10.1210/jcem.87.2.8227. [DOI] [PubMed] [Google Scholar]
- Smith R, Smith JI, Shen XB, Engel PJ, Bowman ME, McGrath SA, Bisits AM, McElduff P, Giles WB, Smith DW. Patterns of plasma corticotropin-releasing hormone, progesterone, estradiol, and estriol change and the onset of human labor. J. Clin. Endocrinol. Metab. 2009;94:2066–2074. doi: 10.1210/jc.2008-2257. [DOI] [PubMed] [Google Scholar]
- Syed F, Khosla S. Mechanisms of sex steroid effects on bone. Biochem. Biophys. Res. Commun. 2005;328:688–696. doi: 10.1016/j.bbrc.2004.11.097. [DOI] [PubMed] [Google Scholar]
- Troisi R, Potischman N, Roberts J, Siiteri P, Daftary A, Sims C, Hoover RN. Associations of maternal and umbilical cord hormone concentrations with maternal, gestational and neonatal factors (United States) Cancer Causes Control. 2003a;14:347–355. doi: 10.1023/a:1023934518975. [DOI] [PubMed] [Google Scholar]
- Troisi R, Potischman N, Roberts JM, Ness R, Crombleholme W, Lykins D, Siiteri P, Hoover RN. Maternal serum oestrogen and androgen concentrations in preeclamptic and uncomplicated pregnancies. Int. J. Epidemiol. 2003b;32:455–460. doi: 10.1093/ije/dyg094. [DOI] [PubMed] [Google Scholar]
- Van den Berg M, Birnbaum L, Bosveld ATC, Brunstrom B, Cook P, Feeley M, Giesy JP, Hanberg A, Hasegawa R, Kennedy SW, et al. Toxic equivalency factors (TEFs) for PCBs, PCDDs, PCDFs for humans and wildlife. Environ. Health Perspect. 1998;106:775–792. doi: 10.1289/ehp.98106775. [DOI] [PMC free article] [PubMed] [Google Scholar]
- Van den Berg M, Birnbaum LS, Denison M, De Vito M, Farland W, Feeley M, Fiedler H, Hakansson H, Hanberg A, Haws L, et al. The 2005 World Health Organization reevaluation of human and mammalian toxic equivalency factors for dioxins and dioxin-like compounds. Toxicol. Sci. 2006;93:223–241. doi: 10.1093/toxsci/kfl055. [DOI] [PMC free article] [PubMed] [Google Scholar]
- Vandenput L, Ohlsson C. Estrogens as regulators of bone health in men. Nat. Rev. Endocrinol. 2009;5:437–443. doi: 10.1038/nrendo.2009.112. [DOI] [PubMed] [Google Scholar]
- Volkel W, Bittner N, Dekant W. Quantitation of bisphenol A and bisphenol A glucuronide in biological samples by high performance liquid chromatography-tandem mass spectrometry. Drug Metab. Dispos. 2005;33:1748–1757. doi: 10.1124/dmd.105.005454. [DOI] [PubMed] [Google Scholar]
- Wetherill YB, Akingbemi BT, Kanno J, McLachlan JA, Nadal A, Sonnenscheing C, Watson CS, Zoeller RT, Belcher SM. In vitro molecular mechanisms of bisphenol A action. Reprod. Toxicol. 2007;24:178–198. doi: 10.1016/j.reprotox.2007.05.010. [DOI] [PubMed] [Google Scholar]
- Wilson VS, Bobseine K, Gray LE. Development and characterization of a cell line that stably expresses an estrogen-responsive luciferase reporter for the detection of estrogen receptor agonist and antagonists. Toxicol. Sci. 2004;81:69–77. doi: 10.1093/toxsci/kfh180. [DOI] [PubMed] [Google Scholar]
- Yamasaki K, Takeyoshi M, Sawaki M, Imatanaka N, Shinoda K, Takatsuki M. Immature rat uterotrophic assay of 18 chemicals and Hershberger assay of 30 chemicals. Toxicology. 2003;183:93–115. doi: 10.1016/s0300-483x(02)00445-6. [DOI] [PubMed] [Google Scholar]


