Abstract
DPOAE (2f1-f2) phase was measured across a 3-octave frequency range from two groups of newborns using ER10B+ and ER10C probe microphones. A marked phase shift was noted in the mid-to-high frequency range for newborn data recorded with the ER10C only. In contrast, the ER10B+ produced phase that was approximately invariant as a function of frequency for most of the range. Probe-related phase shifts can be effectively eliminated by correcting for variations in the phases of the primary tones. Results highlight the importance of detecting and correcting for system-related phase shifts so they are not misinterpreted as cochlear in origin.
Introduction
The distortion product otoacoustic emission (DPOAE) signal in the ear canal is known to be a vector combination of two components, one arising from the basilar membrane region where the traveling waves evoked by the two stimulus tones overlap; and the other from the 2f1-f2 (CF) region of the DPOAE (Heitmann et al., 1998; Talmadge et al., 1999). The two components are hypothesized to be generated by different mechanisms (Shera and Guinan, 1999): the component from the overlap region due to an outer hair cell-based nonlinear generation process that has also been referred to as “wave fixed” in the literature (Knight and Kemp, 2001) and the component from the CF region linked to a process of coherent linear reflection (Zweig and Shera, 1995) and referred to as “place fixed.” These mechanistic differences in generation are perhaps most evident in the phase characteristics of otoacoustic emissions (Shera and Guinan, 1999), leading to a renewed interest in measurement of OAE phase.
While relatively comfortable with the calibration and interpretation of response magnitude, audiologists and many hearing scientists are less well versed in the measurement, calibration and interpretation of signal phase. Correct interpretation of phase measurements requires knowledge of the phase reference. In most cases OAE phase is referenced to the phase of the stimulus tones. However, in the case of DPOAE recordings, no stimulus tone at the DPOAE frequency is present in the ear canal recording. Thus, the reference phase could be derived as the phase of a hypothetical signal at 2f1-f2 calculated from the measured phase values of the two stimulus tones at frequencies f1 and f2.
The reference phase can be influenced by many instrumentation factors. To study cochlear physiology using OAE phase, system-related elements that affect phase measurement must be identified to consider and correct for their influence. Delays due to digital-to-analog (D∕A) and analog-to-digital (A∕D) conversion can be significant. If there are no additional delays or unanticipated shifts, phase should be effectively calibrated by performing accurate measurements of the electronic delay between signal generation and recording when the D∕A converter is connected directly to the A∕D converter. Other system factors can also affect phase, including analog filters, analysis software and sound-delivery tubes, for example. If these shifts are not quantified so as to consider their impact on OAE measurement, there can be significant error in the interpretation of phase, and system-related delays can be erroneously attributed to cochlear physiology. When OAE amplitude is calibrated, corrections are typically conducted a priori or are conducted in-the-ear of each subject in order to deliver desired sound pressure levels to the cochlea. Likewise, when measuring OAE phase, confounding delays or advances related to various system components need to be quantified and appropriately corrected.
During the course of a recent experiment, marked differences in 2f1-f2 DPOAE phase were observed between human newborn and adult subjects, each group tested with a different probe (Dhar and Abdala, 2007). Newborns had been tested with the ER10C and adults, with the ER10B+. Initially, these differences were hypothesized to reflect a developmental effect; however, upon careful scrutiny and measurement, probe-related phase differences became apparent. This report describes our effort to trace the source of these phase differences. By recording DPOAEs from two groups of human newborns with two OAE probes, we demonstrate significant differences in DPOAE phase recorded using the ER10B+ and the ER10C and provide an easy correction for the noted phase shifts.
Methods
Twenty-seven newborn infants participated in this study. The neonates were term born (delivered between 38–41 weeks of gestation) and were tested within 48 h of birth (mean=43.2). Nine were female and 18 were male. All newborn subjects included in this study passed the click-evoked auditory brainstem response hearing screen at 30 dB HL and had no high-risk factors for hearing loss. Of the 27 newborns, 14 were tested using the ER10B+ probe microphone and 13 were tested using the ER10C microphone. Other than the probe assembly, related software and instrumentation were identical between groups. Additionally, data collection from both newborn groups was conducted by the same testers at the University of Southern California+Los Angeles County Medical Center in the Newborn Auditory Research Laboratory within an Eckles (ABC) sound-attenuated isolette. A soft rubber-tip probe was fit into the meatus of the ear canal and the test commenced once the infant was asleep and still. DPOAEs were also recorded from a group of 8 normal-hearing young adults using the ER10C microphone to determine whether the DPOAE phase effects were age specific.
Signal generation and recording were controlled using custom software developed by Dr. Carrick Talmadge and run on an Apple Macintosh G4 computer via a MOTU 828 Mk II input∕output device (24 bits∕44100 Hz). Stimulus tones were presented to the subject’s ear canal via ER2 (ER10B+) insert phones or the inbuilt sound sources of the ER10C. The output of the microphone was pre-amplified and then passed through an analog high-pass filter with 300-Hz cutoff frequency before being digitized by the MOTU and stored on disk. DPOAE recordings were made over 2f1-f2 frequencies spanning three-octaves between 500 Hz (f2=782 Hz) and 4000 Hz (f2=6256 Hz) using fixed stimulus levels of 65 (L1) and 55 (L2) dB SPL and a constant stimulus frequency ratio of f2∕f1=1.22. The stimulus tones were swept at a rate of 8 s∕octave. Eight sweeps were averaged. The stimulus levels were calibrated and system distortion measured in a Zwislocki coupler. The two transducers in each probe system were individually equalized to produce flat constant drive voltage frequency responses up to 7000 Hz in the coupler. System distortion was below −30 dB SPL for the stimulus levels used in these recordings.
DPOAE level and phase estimates were obtained using a least-squares-fit algorithm (LSF) as described by Long et al. (2008) and yielded estimates at every 2 Hz around 500–1000 Hz and every 6 Hz around 4000 Hz. The noise floor was estimated similarly after phase-inverting every alternate sweep window. In this implementation of the LSF technique, models for the stimulus tones and DPOAE of interest are created. Signal components are then fitted to these models to minimize the sum of squared errors between the model and the data. The method outputs both the in-phase and quadrature components of the signals of interest from which the level and phase are estimated. The phase was “unwrapped” by sequentially subtracting 360° to all points beyond identifiable discontinuities. Phase unwrapping was initiated at the lowest frequency (500 Hz) although, due to signal-to-noise (SNR) issues in newborns, only phase data above 800 Hz are displayed and considered in this report.
Results
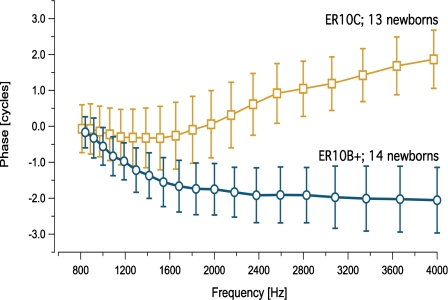
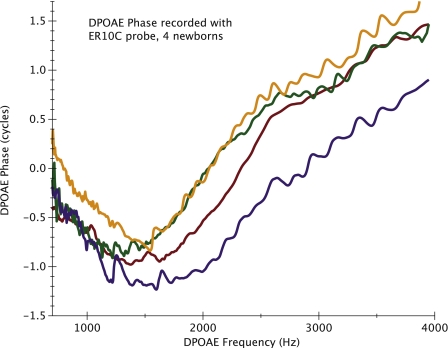
A significant upward phase shift was noted only for DPOAE data collected with the ER10C probe (Fig. 1). Figure 1 shows mean DPOAE phase (±1 SD) averaged into 1∕8 octave intervals, collected from 13 infants with the ER10C and 14 infants with the ER10B+ probe. DPOAE phase manifests a significant (1.5–3 cycle) upward shift for frequencies above 1000–2000 Hz when measured with the ER10C probe. Figure 2 provides an example of phase vs. frequency functions from four individual newborns tested with the ER10C probe.
Figure 1.
Mean DPOAE phase (±1 SD) averaged into 1/8 octave frequency bins for two groups of newborns: 13 infants tested with the ER10C probe (squares) and a second group of 14 newborns tested with the ER10B+ probe (circles). NOTE: DPOAE phase was unwrapped starting at 500 Hz though only data points >800 Hz are displayed due to poor SNR at the lowest frequencies.
Figure 2.
An example of four individual DPOAE phase vs. frequency functions from newborns tested with the ER10C probe.
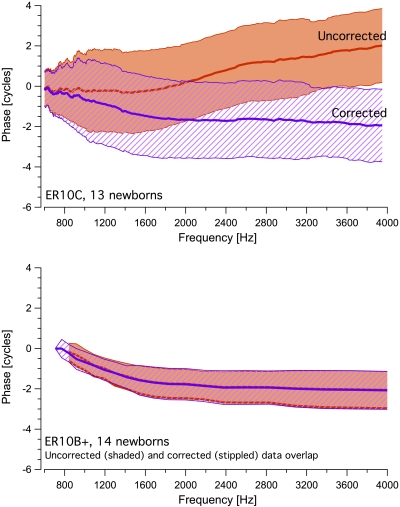
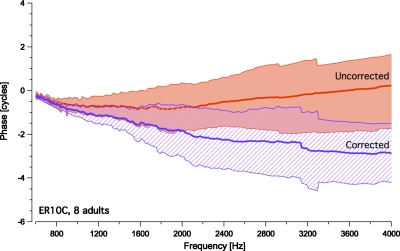
Figure 3 shows mean DPOAE phase for both groups in “corrected’ and “uncorrected” form. It is evident that variability in the ER10C phase data is greater than in the ER10B+ recordings. The ER10C-related upward shift in phase began at slightly different frequencies in each newborn (as noted in Fig. 2), contributing to the data scatter in this group. In the upper panel of Fig. 3, DPOAE phase recorded with the ER10C is “corrected” (stippled region) by subtracting 2ϕ1-ϕ2 from the estimated phase of the DPOAE, where ϕ1 and ϕ2 are the measured phases of the lower and higher frequency stimulus tones. This correction alters DPOAE phase measured with the ER10C above approximately 1200 Hz and in doing so, eliminates the noted shift. In contrast, subtracting the 2ϕ1-ϕ2 from the DPOAE phase recorded using the ER10B+, as shown in the lower panel of Fig. 3, does not alter its profile significantly. Similar phase trends are observed in average uncorrected and corrected phase data recorded using the ER10C from a small group of young adults shown in Fig. 4, although the phase shift is more marked in the newborns and is initiated at lower frequencies. Taken together these data indicate that the observed shift in DPOAE phase is specific to the ER10C (but not age-specific), is related to phase distortion of the stimulus tones and differs somewhat in the adult and newborn ear.
Figure 3.
The newborn phase data displayed in Fig. 1 are shown again in this graphic. The stippled region represents the corrected phase derived by subtracting 2ϕ1-ϕ2 from the estimated phase of the DPOAE, where ϕ1, ϕ2 are the measured phases of the two primary tones. The shaded region represents the uncorrected phase values. Because of the significant overlap, the two regions are staggered slightly for display purposes in the lower panel.
Figure 4.
Mean DPOAE phase vs. frequency functions from 8 normal-hearing adults recorded with the ER10C probe (±1 SD). Data are shown corrected for variations in stimulus tone phases (stippled region) and in uncorrected form (shaded region).
Discussion
Expected phase invariance
The phase of the DPOAE recorded in the ear canal essentially reflects the phase characteristics of the dominant of two (or more) DPOAE components. In the general population, overall, the ear canal DPOAE is dominated by the component from the overlap region which means it exhibits phase characteristics like that of a wave-fixed emission. Thus, the phase of the DPOAE measured in the ear canal is linked to the relationship between the phases of the stimulus tones. When the frequency ratio between the stimulus tones is held constant as they are swept in frequency (as in this experiment), the phases of the two stimulus tones do not vary significantly at their CF regions. Consequently, the array of DPOAE generators (presumed to be outer hair cells) are driven by a trigger that does not change with frequency, explaining why the phase of the ear canal DPOAE is relatively invariant over much of the range. Data from several groups support this generation scenario at least above approximately 2000 Hz (e.g., Shera et al. 2000; Tubis et al., 2000; Dhar et al., 2002; Abdala and Dhar, 2010).
This observed phase invariance above some mid-frequency boundary, a consequence of cochlear scaling symmetry, guides our expectations of what the normal DPOAE phase vs. frequency function should look like. Individual DPOAE phase vs. frequency functions in Fig. 2, collected from newborns with the ER10C, differ strikingly from the DPOAE phase pattern we expect the cochlea to produce. When this marked upward phase shift was initially observed in newborns, it was considered a possible developmental effect. Indeed, it produced some excitement in our combined laboratories because of its atypical pattern, possibly indicative of cochlear immaturity. This highlights the danger of misinterpreting the probe-related phase distortion as being cochlear in nature. Once the effect was confirmed in adult subjects and observed to be absent with the ER10B+, it became clear that the phase shift was related to instrumentation, not immaturity.
Source of the phase shift
Once the ER10C-related phase shifts were observed, we examined the contribution of the probe microphone to these shifts. Phase shifts from the ER10C microphone were measured by comparing to a reference microphone with known phase characteristics (ACO 7017). A linear sweep was generated through an independent sound source into a custom acoustic coupler and recorded by both microphones at equal distance from the sound source. The ER10C microphone produced phase shifts of approximately 0.5 cycles (re: reference microphone) in the range of 2000–4000 Hz. Though we did not conduct direct measurement of phase effects induced by the transducers, based on the microphone measurements it is clear that the overall ER10C phase shifts reported here cannot be attributed solely to transducer delays. It is likely these effects are due to a combination of transducer-, and microphone-induced shifts in phase. Rather than individually compensate for shifts imposed by each component in the system, subtracting the phase variation of the stimulus tones allows for a “quick and dirty” method of phase calibration that eliminates the system-related delays, regardless of their origin. Any deviation in DPOAE phase from this flattened baseline can be considered cochlear in nature.
The phase distortion observed with the ER10C probe is present in both adults and newborns but begins at lower frequencies and is more marked in the newborn ear. It is possible the phase shift is load dependent, producing the noted age differences. An alternative explanation is that the phase shifts are nonlinear. Clearly, it would have been ideal to record DPOAEs with both probes on the same ear, thus providing essentially identical load in each case; however, this study was not initially designed to compare probes. The probe observations were made when implementing a rather long DPOAE protocol, making measurements with both probes on one neonatal subject feasible.
Calibration of OAE phase
The findings suggest that more attention should be paid to the calibration of DPOAE phase if this index will be used as an assay of cochlear function. Any report of OAE group delay is directly linked to phase characteristics. Additionally, inverse FFT-based DPOAE component separation relies on accurate measurements of phase. If these variables are of interest, phase must be calibrated and measured with the same thoroughness accorded to calibration of level. Among the hearing science community, more laboratories are recording OAE phase for various end goals, including but not limited to the measurement of DPOAE fine structure and component separation. Additionally, clinicians are being encouraged to explore and apply DPOAE phase and∕or group delay for diagnostic purposes. These laboratories and clinics will likely select a measurement probe microphone based on practical considerations and familiarity. As we have shown here, two widely used OAE probes vary greatly in the amount and configuration of the phase shifts they produce. We have also shown that the marked phase shift recorded with the ER10C can be effectively eliminated with a simple correction, by subtracting the phase variation in the stimulus tones.
In order to ensure that measurements of response phase are not colored by instrumentation-related inaccuracies, or at minimum, appropriate corrections are made for such inaccuracies, the onus falls on the user to “Know thy probe.” Clearly, unwanted variations in phase must be controlled carefully if we are to link DPOAE phase characteristics to the underlying physiology or use DPOAE (or any other OAE) phase or group delay for diagnostic purposes.
Acknowledgments
Authors would like to thank Christopher Shera, Radha Kalluri and one anonymous reviewer for insightful comments about this manuscript; and Ping Luo for technical assistance. This work was supported by a grant from the National Institutes of Health Grant No. R01 DC003552 (CA), the House Ear Institute and Northwestern University.
References and links
- Abdala, C., and Dhar, S. (2010). “Distortion product otoacoustic emission (DPOAE) phase and component analysis in human newborns,” J. Acoust. Soc. Am. 127, 316–325. 10.1121/1.3268611 [DOI] [PMC free article] [PubMed] [Google Scholar]
- Dhar, S., and Abdala, C. (2007). “A comparative study of DPOAE fine structure in human newborns and adults with normal hearing,” J. Acoust. Soc. Am. 122, 2191–2202. 10.1121/1.2770544 [DOI] [PubMed] [Google Scholar]
- Dhar, S., Talmadge, C. L., Long, G. R., and Tubis, A. (2002). “Multiple internal reflections in the cochlea and their effect on DPOAE fine structure,” J. Acoust. Soc. Am. 112, 2882–2897. 10.1121/1.1516757 [DOI] [PubMed] [Google Scholar]
- Heitmann, J., Waldman, B., Schnitzler, H. U., Plinkert, P. K., and Zenner, H. P. (1998). “Suppression of distortion product otoacoustic emissions (DPOAE) near 2f1-f2 removes DP-gram fine structure—Evidence for a second generator,” J. Acoust. Soc. Am. 103, 1527–1531. 10.1121/1.421290 [DOI] [Google Scholar]
- Knight, R. D., and Kemp, D. T. (2001). “Wave and place fixed DPOAE maps of the human ear,” J. Acoust. Soc. Am. 109, 1513–1525. 10.1121/1.1354197 [DOI] [PubMed] [Google Scholar]
- Long, G. R., Talmadge, C. L., and Lee, J. (2008). “Measuring distortion product otoacoustic emissions using continuously sweeping primaries,” J. Acoust. Soc. Am. 124, 1613–1626. 10.1121/1.2949505 [DOI] [PubMed] [Google Scholar]
- Shera, C. A., and Guinan, J. J. (1999). “Evoked otoacoustic emissions arise by two fundamentally different mechanisms: A taxonomy for mammalian OAEs,” J. Acoust. Soc. Am. 105, 782–798. 10.1121/1.426948 [DOI] [PubMed] [Google Scholar]
- Shera, C. A., Talmadge, C., and Tubis, A. (2000). “Interrelations among distortion-product phase-gradient delays: Their connection to scaling symmetry and its breaking,” J. Acoust. Soc. Am. 108, 2933–2948. 10.1121/1.1323234 [DOI] [PubMed] [Google Scholar]
- Talmadge, C. L., Long, G. R., Tubis, A., and Dhar, S. (1999). “Experimental confirmation of the two-source interference model for the fine structure of distortion product otoacoustic emissions,” J. Acoust. Soc. Am. 105, 275–292. 10.1121/1.424584 [DOI] [PubMed] [Google Scholar]
- Tubis, A., Talmadge, C. L., Tong, C., and Dhar, S. (2000). “On the relationships between the fixed-f1, fixed-f2, and fixed-ratio phase derivatives of the 2f1-f2 distortion product otoacoustic emission,” J. Acoust. Soc. Am. 108, 1772–1785. 10.1121/1.1310666 [DOI] [PubMed] [Google Scholar]
- Zweig, G., and Shera, C. A. (1995). “‘The origin of periodicity in the spectrum of evoked otoacoustic emissions,” J. Acoust. Soc. Am. 98, 2018–2047. 10.1121/1.413320 [DOI] [PubMed] [Google Scholar]


