Abstract
Summary: Recently, several methods for analyzing phenotype data have been published, but only few are able to cope with data sets generated in different studies, with different methods, or for different species. We developed an online system in which more than 300 000 phenotypes from a wide variety of sources and screening methods can be analyzed together. Clusters of similar phenotypes are visualized as networks of highly similar phenotypes, inducing gene groups useful for functional analysis. This system is part of PhenomicDB, providing the world's largest cross-species phenotype data collection with a tool to mine its wealth of information.
Availability: Freely available at http://www.phenomicdb.de
Contact: bertram.weiss@bayerhealthcare.com
Supplementary information: Supplementary data are available at Bioinformatics online.
1 INTRODUCTION
Since Mendel, phenotypes, especially with regard to diseases, have been studied intensively to reveal genotype–phenotype relationships. Recently, the number of available methods to generate such data has grown significantly, leading to the availability of large amounts of data, scattered over a multitude of data sources mostly dedicated to single species or diseases (Groth and Weiss, 2006). From these, integrative cross-species databases, like PhenomicDB (Groth et al., 2007) have emerged, building the ground for performing meta-analyses of phenotypes across species or studies with the goal to gain insights into the genetic origin of diseases. However, there are only very few tools that allow analyzing such complex data.
In a recent meta-analysis of cross-species phenotype data (Groth et al., 2008), we showed that clustering the free-text descriptions of phenotypes (phenoclustering) using advanced natural language processing methods induces a clustering of genes (by similarity of their associated phenotype) that can be exploited for guilt-by-association analysis. In particular, we showed that it is possible to predict gene function within such groups with high precision. This method is now freely available as an interactive tool integrated into the phenotype database PhenomicDB.
2 PHENOMICDB
PhenomicDB hosts phenotypes from studies as diverse as mutant screens, k.o. mice or RNA interference, spanning various species (from yeast to human), and derived from a variety of sources. The database currently contains 327 070 unique phenotypes connected to 70 588 genes. Approximately 36% of the phenotypes are associated to genes from either Drosophila melanogaster or Caenorhabditis elegans. Genes from Saccharomyces cerevisiae, Mus musculus and Homo sapiens are associated to 12.5%, 6% and 1% of the phenotypes, respectively. The remaining 27 800 phenotypes are associated to genes from other species.
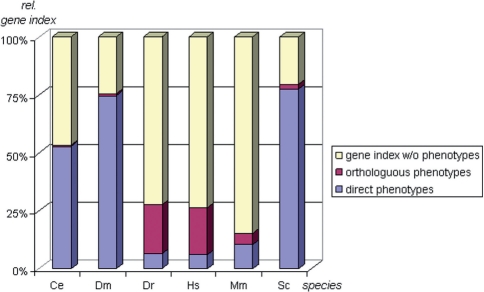
PhenomicDB specifically has been built to enable analysis across techniques and species. Phenotypes from orthologous genes can help gaining insight into the function of a gene from a species with no phenotypic information available. Therefore, PhenomicDB incorporates 43 998 eukaryotic orthology groups from HomoloGene. Through orthology, 98 543 genes having no phenotype directly associated to them are connected to phenotypic annotation of orthologs. For example, only 2405 human genes are directly linked to a human phenotype, but another 8389 human genes can be associated to a phenotype by orthology (Fig. 1).
Fig. 1.
Percentage of NCBI Entrez Gene indices with phenotypic information in PhenomicDB for five model organisms and human. (Ce, Caenorhabditis elegans; Dm, Drosophila melanogaster; Hs, Homo sapiens; Mm, Mus musculus; Sc, Saccharomyces cerevisiae; Dr, Danio rerio). The percentages of genes with one or more phenotype from the given species is shown in blue (‘direct phenotypes’), of those with one or more phenotype associated by orthology are shown in red (‘orthologous phenotypes’), and of genes with no phenotype associated are shown in yellow.
3 PHENOCLUSTERS
Orthology helps to transfer phenotype information based on genotypes. However, it is also possible to transfer functional information based on similar phenotypes, as shown in Groth et al. (2008). In this work, we compared phenotypes based on their textual description because no comprehensive vocabulary for describing phenotypes exists (and those that exist are used only sparsely). We built clustered similar phenotypes using the vector space model for text similarity and showed that the emerging clusters are biologically coherent, enabling gene function prediction with a precision of over 70%. By overweighting terms from phenotype-related ontologies [Medical Subject Headings and Mammalian Phenotype Ontology (Smith et al., 2005)], results improve by ∼5% (unpublished data). A detailed description on how such clusters results can be produced is given in Supplementary File 1.
This method is now available online, directly working on the quarterly updated content of PhenomicDB. Phenotype clusters are computed anew with every database update and can be inspected graphically through a web front-end or downloaded for further analysis. To assess their biological meaningfulness, the system also computes for every cluster an enrichment score in terms of protein–protein interactions (PPI), a GO-similarity score and the sequence similarity of the proteins associated to the phenotypes.
4 THE PHENOCLUSTER VIEW
Phenoclusters can be accessed by first searching for a gene or phenotype of interest in the search interface. The resulting hit list shows genes and associated phenotypes. Most phenotypes also have a ‘Show Cluster’ button leading directly to the phenocluster view to explore similar phenotypes (Supplementary Fig. 1).
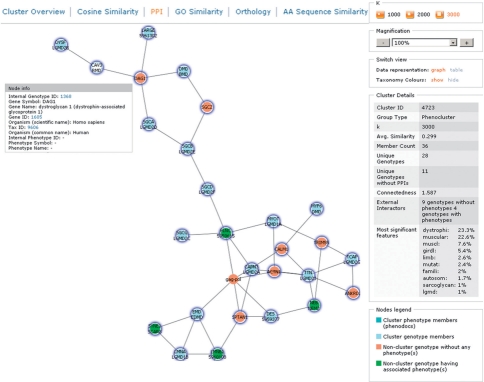
As shown in Figure 2, the phenocluster view is divided into six tabs. Each tab is explained in detail with a mouse-over tooltip and more information can be found within the help pages, where the data sources are also referenced. The screen center always shows the phenotypes (or genes) of the current cluster as a graph (or as tabular list) where edges represent similarity. Nodes are colored according to taxonomy and cluster membership. Details on each phenotype are available in tooltips. Graphs can be downloaded in ‘xdot’ and ‘png’ format from the ‘actions and information’ pane.
Fig. 2.
Phenocluster of the rippling muscle disease (RMD) phenotype associated to caveolin 3 (CAV3) visualized with k = 3000 for an optimal view. The cluster was found searching for ‘rippling muscle disease’ in phenotype descriptions. Genes associated to phenotypes from the cluster connected by protein interactions are shown (blue nodes). Connected genes with phenotypes that are not within the cluster (green nodes) and genes with no phenotypes associated (red nodes) are also shown. The ‘actions and information’ pane on the right provides statistics, a legend and enables altering the view. The top section enables changing the presentation of similarity scores.
The different tabs convey the following information: (i) the overview tab displays the phenotypes of a cluster, i.e. phenotypes with similar descriptions. The three similarity tabs show cluster members (or their associated genes) with edges between them (when surpassing a given threshold), indicating similarity of (ii) phenotype descriptions (Supplementary Fig. 1), (iii) similar annotations with GO-terms or (iv) amino acid sequence similarity. (v) The orthology tab shows only orthologous genes for which their phenotypes have been clustered together. Thus, functional similarity of these genes is confirmed twice, by orthology and phenotype. (vi) The PPI view (Fig. 2) integrates protein interactions and includes an ‘expansion’ feature. Therein, the network of genes of a phenocluster is enriched by genes interacting with the cluster members. As interacting proteins often have a similar function and similar phenotype, this feature allows discovery of missing or novel members of biological pathways or multiple functions of a gene within a PPI network based on phenotype similarity.
5 APPLICATIONS
Phenoclusters allow for a variety of different applications. For instance, users may query PhenomicDB for genes annotated with a certain disease, and explore their phenoclusters to find genes which have not been associated with this disease so far. The same approach can be used to study whether genes producing a similar phenotype have similar functional annotation. Such an approach can be particularly important for proteins with lacking or only very general functional information attached—studying their phenoclusters will lead to new suggestions on their function.
Another helpful feature is analysis of biological pathways which are to be inhibited pharmacologically but contain no known druggable target. Phenoclusters allow searching for yet undiscovered members of that pathway that are amenable to drug intervention. As an example, human DAG1 has no phenotype described in PhenomicDB. However, the PPI-phenocluster view of CAV3 (Fig. 2) is composed of genes of similar phenotypes associated with ‘dystrophi’ (23.3%) and ‘muscular’ (22.6%) as most significant similarity features. Human DAG1 through its PPI with CAV3 becomes connected to the mouse ortholog of DAG1 which is associated indeed with a ‘muscular dystrophy’ phenotype, giving a strong indication also for human DAG1 to be involved in such a phenotype. The usefulness of these approaches is also reported by others (Washington et al., 2009).
Conflict of Interest: none declared.
Supplementary Material
REFERENCES
- Groth P, et al. PhenomicDB: a new cross-species genotype/phenotype resource. Nucleic Acids Res. 2007;35:D696–D699. doi: 10.1093/nar/gkl662. [DOI] [PMC free article] [PubMed] [Google Scholar]
- Groth P, Weiss B. Phenotype Data: a neglected resource in biomedical research? Curr. Bioinformatics. 2006;1:347–358. [Google Scholar]
- Groth P, et al. Mining phenotypes for gene function prediction. BMC Bioinformatics. 2008;9:136. doi: 10.1186/1471-2105-9-136. [DOI] [PMC free article] [PubMed] [Google Scholar]
- Smith CL, et al. The Mammalian Phenotype Ontology as a tool for annotating, analyzing and comparing phenotypic information. Genome Biol. 2005;6:R7. doi: 10.1186/gb-2004-6-1-r7. [DOI] [PMC free article] [PubMed] [Google Scholar]
- Washington NL, et al. Linking human diseases to animal models using ontology-based phenotype annotation. PLoS Biol. 2009;7:e1000247. doi: 10.1371/journal.pbio.1000247. [DOI] [PMC free article] [PubMed] [Google Scholar]
Associated Data
This section collects any data citations, data availability statements, or supplementary materials included in this article.


