

Abstract
Cellular apoptosis, the prototype of programmed cell death, can be induced by activation of so-called death receptors. Interestingly, soluble and membrane-bound members of death receptor ligands can differentially activate their receptors. Using the death receptor ligand tumor necrosis factor (TNF) presented on a surface in a nanoscaled pattern with spacings between 58 and 290 nm, we investigated its requirements for spatial arrangement and motility to efficiently activate TNF receptor (TNFR)1 and TNFR2 as well as its chimeras TNFR1-Fas and TNFR2-Fas. We show that the mere mechanical fixation of TNF is insufficient to efficiently activate TNFR2 that is responsive to only the membrane bound form of TNF but not its soluble form. Rather, an additional stabilization of TNFR2(-Fas) by cluster formation seems to be mandatory for efficient activation. In contrast, TNFR1(-Fas) is strongly activated by TNF spaced within up to 200 nm distances, whereas larger spacings of 290 nm fails completely. Furthermore, unlike for TNFR2(-Fas) no dose-response relationship to increasing distances of nanostructured ligands could be observed for TNFR1-(Fas), suggesting that compartmentalization of the cell membrane in confinement zones of approximately 200 nm regulates TNFR1 activation.
Apoptosis is a particular type of programmed cell death critically involved in physiological processes such as embryonic development and immunological responses.(1–3) Apoptosis is characterized by a series of events including proteolytic cleavage of multiple proteins, DNA fragmentation, and finally the disintegration of dying cells into membrane vesicles. Activated T lymphocytes trigger apoptosis in, for example, virus-infected target cells by activation of so-called death receptors. Death receptors are a subgroup of the tumor necrosis factor (TNF) receptor family, including TNF receptor type 1 (TNFR1), TNF related apoptosis-inducing ligand (TRAIL) receptors 1 and 2 and CD95/Fas.(4) The respective ligands, TNF, TRAIL, and Fas ligand (FasL), are all produced as type 2 transmembrane proteins forming noncovalently linked homotrimers. By proteolytic cleavage and/or alternative splicing soluble homotrimeric forms of these ligands also exist.
The prototype of an apoptosis-inducing death receptor is CD95/Fas, which is relatively well understood.(5) Ligand-mediated receptor trimerization leads to association of the cytoplasmic adapter molecule Fas associated death domain protein (FADD), which in turn recruits the proform of caspase 8. This results in autoactivation of caspase 8 by induced proximity and subsequent activation of a cascade of caspase activation, finally dismanteling the cell. Unexpectedly, the soluble forms of death receptor ligands bind their receptors with high affinities but often have reduced bioactivities as compared to their respective membrane bound precursor forms.(6) Soluble FasL can even act as an antagonist for membrane bound FasL action,(7) whereas a soluble, engineered hexameric FasL is highly bioactive.(8) These results in combination with microscopic observations of large ligand/receptor clusters(9) strongly suggest that ligand-mediated homotrimerization of receptors is mandatory, but not sufficient for efficient signal induction. Rather, larger complexes must be formed, consisting at a minimum of two adjacent receptor molecules bound to two distinct ligand trimers.(7, 10)
In the TNF system, TNFR2 can be fully activated only by membrane bound TNF (memTNF), despite rather binding soluble TNF (sTNF) with high affinity, whereas TNFR1 can be activated by both sTNF and memTNF.(6) This differential responsiveness is independent of the particular TNFR-specific signaling mechanisms, because genetically engineered TNFR-Fas chimeras, consisting of the cytoplasmic signaling part of Fas instead of that of the TNFR, show the same phenotype.(9) These data indicate that the differential response pattern of the two TNF receptors is not coded intracellularly, but rather at the level of ligand interaction and/or receptor interactions with membrane adjacent components.
From the molecular side two aspects are of interest. (i) TNFR2 was shown to bind sTNF only transiently (half-life of TNFR2/sTNF complex (t1/2) = 1 min) as compared to TNFR1 (t1/2 > 60 min).(11) As a major difference between sTNF and memTNF is the mechanical fixation of the latter, it was suggested that prevention of free diffusion might be required for formation of functional signal complexes with TNFR2. (ii) In general, TNFR1 might have a higher tendency to form ligand/receptor clusters as compared to TNFR2. This could be caused by local enrichment of this receptor in, for example, cholesterol-rich microdomains(12) or other stabilizing molecular interactions such as stronger homeophilic TNFR1/TNFR1 interactions via the extracellular preligand binding assembly domain (PLAD).(13) In fact, TNF coupled to synthetic core shell nanoparticles were recently shown to represent strong activators of both TNFR1 and TNFR2, indicating that either the mechanical stabilization of the ligand and/or their high density at the bead surface (estimated 16000 molecules TNF per μm2) resulted in a memTNF-like bioactivity.(14)
Here we further investigate this question using nanostructured devices providing surfaces with defined structures as platforms for various biological investigations such as the manipulation of integrin ligands, cell spreading, and focal adhesion dynamics.(15, 16) We produced surfaces with covalently fixed TNF arranged in regular hexagonal pattern with defined distances. Cells expressing the apoptotic wild type TNFR1 and TNFR-Fas chimeras were investigated. The results show that nanostructured TNF is a potent activator of TNFR1(-derived chimeras), but comparably ineffective on TNFR2(-derived chimeras). These results clearly demonstrate that the mere mechanical fixation of TNF is not sufficient to allow strong TNFR2 activation. Rather, a certain density of the molecules and/or their capability for lateral movement may be necessary to allow cluster formation. Interestingly, and in contrast to TNFR2, TNFR1 showed no dose–response relationship to increasing distances of nanostructured TNF. When distances within the lattice were increased, kinetics of apoptosis induction by TNFR1(-derived chimeras) were comparable within the range between 58 and 200 nm. Intermediate effects were observed using a ~260 nm lattice, whereas no apoptotic response at all was obtained when TNF was interspaced by ~290 nm. This drastic change in cellular responsiveness when altering TNF density only by a factor of 2 suggests that compartmentalization of the cell membrane regulates TNFR1 activation.
The method for the preparation of nanostructured surfaces is based on the self-assembly of diblock copolymer micelles.(17–19) Nanostructured surfaces with gold dot distances of (i) 58 nm ± 6 nm (Figure 2A), (ii) 110 nm ± 14 nm, (iii) 200 nm ± 24 nm (Figure 3C), (iv) 260 nm ± 29 nm (Figure 3D), and (v) 290 nm ± 35 nm (Figure 3E) were used (see also Supporting Information). Homogenously gold-coated surfaces were analyzed as controls. For the preparation of these surfaces, a titanium layer (5 nm) was first sputtered on the glass coverslips, followed by a layer of gold (50 nm). This was performed by the use of a modular high vacuum coating unit (BalTec Med 020). Finally, the prepared surfaces were biofunctionalized with TNF containing a cysteine residue near the N-terminus (CysTNF) allowing directed covalent binding to gold particles.(9, 14) Because of the size of the gold dots (8 nm in diameter), we assume that typically only a few homotrimeric TNF molecules will be coupled to each gold dot.
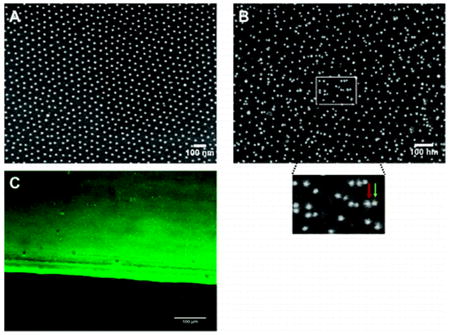
Figure 2.

Characterization of TNF-functionalized nanostructured surfaces by immunolabeling methods. Nanostructured surfaces with a gold dot distance of 58 nm were left untreated (A) or were TNF-biofunctionalized (B and C) using 500 ng/mL CysTNF. (A and B) Surfaces were analyzed by scanning electron microscopy. (B) Nanostructured surfaces were stained using monoclonal TNF-specific antibodies (clone T1; 2 μg/mL) and mouse IgG-specific antibodies coupled with gold particles of 9.8 nm diameter (dilution 1:20 in NaCl pH 6.0). The insert represents a closer view of the marked area (green arrow = additional gold dot conjugated to the secondary antibody, red arrow = gold dot most likely originating from the gold dot structure of the surface). (C) Immunofluorescence microscopy of a TNF-biofunctionalized nanostructured surface stained by monoclonal TNF-specific antibodies (clone T1; 2 μg/mL) and Alexa 488-coupled mouse anti-IgG antibodies.
Figure 3.

Efficient apoptosis induction by TNF receptor 1 requires distinct ligand spacings. Nanostructured surfaces with gold dots spaced as indicated, i.e., (i) homogenously coated, (ii) 58 nm, (iii) 110 nm, (iv) 200 nm, (v) 260 nm, and (vi) 290 nm were TNF-functionalized with CysTNF (500 ng/mL). MF TNFR1-Fas (4 × 10⁴ cells/surface; A–E) or the rhabdomyosarcoma cell line Kym-1 (F) were seeded and live cell imaging analyses were performed. Apoptotic cells were determined by their distinct morphological appearance and are given as percentages immediately after (0 h) and 1, 2, and 3 h after plating the cells (A, B, and F). (C–E) Phase contrast images of biofunctionalized nanostructured surfaces before (left, scanning electron microscopy) and 3 h after seeding the cells (right, phase contrast microscopy). The data represents the mean of three independent experiments; in each experiment three randomly chosen areas with appromximately 100 cells were analyzed. Error bars = standard deviation of the mean.
A first characterization via atomic force microscopy (AFM) revealed a clear distinguishing between the gold dots and the glass surface (Figure 1A and B).
Figure 1.

Analyses of TNF-functionalized nanostructured surfaces by atomic force microscopy. Nanostructured surfaces of 200 nm spacings were left untreated (A) or were biofunctionalized with 500 ng/mL CysTNF (B). AFM images (top) and analyses of the surface topographies (botttom) generated using standard semicontact mode operation in air and a typical scanning speed of 1 line/s are shown. The black bars in the AFM images correspond to the surface analyzed in a height profile at the bottom. Both on the nonfunctionalized (A) and on the TNF-functionalized (B) surface the bare glass surface between the gold dots is visible. For the processing of the images only automatic linear background correction was applied for the individual scan lines.
Cross-section profiles depicted a height of undecorated gold dots of 4 ± 1 nm above the bare glass surface (Figure 1A) and 8 ± 1.7 nm after they had been treated with CysTNF (Figure 1B). Quantification of the heights of the TNF-functionalized gold dots showed that more than 95% of the gold dots were decorated with TNF (data not shown). As the structure of the bare glass appears identical for both nonfunctionalized (Figure 1A) and TNF-functionalized surfaces (Figure 1B), significant unspecific binding of TNF to the glass can be excluded. Efficient TNF coupling to nanostructured surfaces was also visualized by scanning electron microscopy (SEM) using TNF-specific antibodies and secondary gold particle coupled IgG-specific antibodies (Figure 2B).
As expected, after indirect immunolabeling additional gold-dots are visible and a higher magnification revealed antibody-conjugated gold dots (Figure 2B, green arrow) in addion to those gold dots being part of the quasihexagonal nanostructured surface (Figure 2B, red arrow) indicating specific coupling of TNF to nanostructured gold dots. Control experiments, where TNF-functionalized plates were treated only with the secondary gold-conjugated antibody revealed no additional gold dots (data not shown). Finally, TNF-functionalized nanostructured surfaces were analyzed by laser scanning microscopy after staining with TNF-specific and fluorochrome-labeled antibodies (Figure 2C). The sharp edge between the fluorescent and nonfluorescent part of the surface corresponds to the dipping line separating the part of the surface containing gold dots (upper part) from the part without gold dots (lower part). The bright fluorescence indicates efficient TNF-binding to the gold dots only (Figure 2C, upper part) as the lower part of the glass surface without gold dots lacks fluorescence (Figure 2C, lower part). We next investigated the distance requirements of TNF receptors in terms of efficient receptor activation using immortalized mouse embryonic fibroblasts (MF) generated from TNFR1/TNFR2 double knockout mice expressing TNFR-Fas chimeric proteins consisting of the extracellular domain on TNFR1 or TNFR2 and the cytoplasmic part of Fas (MF TNFR1-Fas and MF TNFR2-Fas, respectively). These molecules have been well-characterized regarding their differential responsiveness to soluble TNF, instead being fully responsive to the membrane bound ligand.(9) We quantified the induction of apoptosis after cells had been plated on TNF-coated homogeneous gold surfaces as well as on TNF-functionalized nanostructured surfaces with gold dot distances of 58, 110, 200, and 290 nm. TNF-molecules with an interspace between 58 and 200 nm lead to the induction of apoptosis with similar efficiency. After three hours, approximately 80% of the cells had died, whereas an even faster kinetics was observed on homogenously TNF-coated surfaces (approximately 75% within one hour; Figure 3A). Unexpectedly, no significant apoptosis induction could be detected after cultivation of MF TNFR1-Fas on surfaces with a TNF-spacing of 290 nm (Figure 3A). In contrast, MF TNFR1-Fas adhered and dividing cells could be observed within the three hours of the experiment (data not shown). At that time only a negligible number of dead cells was observed (6%) and cell morphology of the surviving cells appeared normal (data not shown). We generated plates with a gold dot distance of 260 nm (Figure 3D, left) revealing an intermediate responsiveness (62% of apoptotic cells after 3 h, Figure 3B,D, right), whereas at a distance of 290 nm (Figure 3E) the lack of apoptosis (6% apoptotic cells, Figure 3B,E, right) and at a distance of 200 nm (Figure 3C, left) the strong apoptotic response could be confirmed (Figure 3B,C, right).
Experiments performed with the human wild type TNFR1 positive rhabdomyosarcoma cell line Kym-1 revealed the same apoptotic response patterns on different TNF-functionalized nanostructured surfaces as observed for the murine fibroblasts expressing TNFR-Fas chimeras (Figure 3F). In general, however, Kym-1 cells are known to react more slowly to an apoptotic stimulus, showing the morphological phenotype after typically 5 h when treated with high TNF concentrations (data not shown). In the range of TNF spacing between 58 and 200 nm almost 80% of the cells underwent apoptosis after six hours of the experiment, compared to 98% on homogenously coated TNF (Figure 3F). As already observed for MF TNFR1-Fas cells, however, apoptosis induction completely failed on surfaces with a TNF-spacing around 290 nm (Figure 3F).
These dose response curves show an unexpected sharp decrease in the range between 200 and 290 nm of spacing. Within this range the TNF amount on a given area, for example, the total amount of ligand available for a single cell, reduces only 2-fold. We estimated that an average cell, having a contact area of approximately 300 μm2 after settling, can establish ligand interactions with up to about 5200 and 2600 gold dots at an interspacing of 200 and 290 nm, respectively. Using TNF-coated nanoparticles, we had estimated a value of only about 270 TNF molecules for half-maximum cytotoxic effects in MF TNFR1-Fas.(14) As more than 95% percent of the gold dots are coupled with TNF, only a portion of these dots might be capable to signal, for example, only those decorated with more than one homotrimer of TNF. Alternatively, suboptimal signaling is caused by sterical reasons, the mechanical fixation and/or the spacing. In any case the cell is capable of providing enough receptor molecules for binding all available TNF, as we estimated approximately 15 000 receptor molecules to be present in the contact area.(9) Irrespective of these considerations, a threshold in signaling was observed when the interspacing exceeded 200 nm. A 2-fold dilution of soluble TNF at half maximal cytotoxic effects, representing the range of the highest sensitivity, results only in a moderate change of 10–20% in the cytotoxic response in MF TNFR1-Fas.(9) Using nanostructured TNF, however, a 2-fold reduction in the ligand results in a drop from about 80% of maxiumum cytotoxic effects to only 6%. These data strongly argue for some spatial control modulating the signaling, such as confined membrane domains restricting the diffusion of transmembrane proteins and the signaling output.
A comparison with the results obtained using MF TNFR2-Fas cells corroborates the exceptional behavior of TNFR1-Fas. In general, MF TNFR2-Fas cells were much less responsive to TNF coated on gold as compared to their MF TNFR1-Fas positive counterparts. These data demonstrate that the mere mechanical fixation of the ligand is not sufficient to allow full activation of TNFR2-Fas but also of wild type TNFR2 (data not shown).
Using homogeneous gold surfaces only 26% of dead cells were observed in contrast to 88% of apoptotic MF TNFR1-Fas cells (Figure 3A and 4A). Using TNF-coated nanostructured surfaces with increasing interspaces (58 nm – 200 nm, Figure 4A) resulted in a further steady decrease in the apoptotic rate. However, application of the TNFR2-specific monoclonal antibody 80M2, known to exert a bioactivity similar to membrane bound TNF on TNFR2(-Fas) when combined with soluble TNF,(6, 9) enhanced apoptotic signaling remarkably (Figure 4B). Most likely lateral movement of TNFR2-Fas is mandatory for proper signal cluster formation, which is in accordance with mAb 80M2 known to preaggregate TNFR2.(6) Because of the transient ligand interaction of TNFR2(-Fas)(11) we postulate that larger signaling clusters must be formed to allow efficient intracellular signal complex formation. This model is in agreement with the steadily reducing bioactivity of TNF with increasing interspaces.
Figure 4.

TNF receptor 2-Fas requires additional cross-linking for efficient TNF signaling. MF TNFR2-Fas (4 × 10⁴) were plated on TNF-functionalized homogenously gold or surfaces spaced at 58–290 nm in the absence (A) or presence of 1 μg/mL mAb 80M2 (B); the number of apoptotic cells was determined by their distinct morphological appearance at different time points using live cell microscopy. (B) The number of apoptotic cells was determined as in panel A 3 h after seeding of the cells. The percentage of dead cells was markedly increased in the presence of mAb 80M2 on TNF spacings of 58 and 110 nm The data represents the mean of three independent experiments; in each experiment three randomly chosen areas with approximately 100 cells were analyzed. Error bars = standard deviation of the mean.
Similar to wild type Fas, where already ligand hexamers are very efficient activators of their respective receptors,(8) TNFR1(-Fas) might not be dependent on formation of larger clusters for efficient signaling. This is in agreement with a much higher stability of TNFR1 ligand/receptor complexes(11) (data not shown) and recent crystallization studies from Fas/FADD complexes(10) suggesting that two adjacent TNFR1(-Fas) molecules might be sufficient for efficient signal initiation. However, the data obtained with TNFR1 and TNFR1-Fas positive cells indicate some limitations in signaling at a spacing of 260 nm. It is well accepted that membrane expressed proteins and lipids can be temporarily confined to domains, which in turn modulate their biological functions. Microdomains rich in cholesterol and sphingolipids, often called lipid rafts, are intensively debated inhomogeneities confining diffusion in the plasma membrane of eukaryotic cells. The localization of TNFR1 to cholesterol-rich domains is supported by several publications (for review see ref 12). Single particle tracking studies indicated confinement zones of 200 – 300 nm in diameter being sensitive for cholesterol depletion.(20) To test whether such restriction zones could be responsible for the total loss in the capability of TNFR1-Fas to induce apoptosis at 290 nm spaced surfaces, 1.25 mM β-Methylcyclodextrin (MβCD) was added to deplete cholesterol when MF TNFR1-Fas cells were seeded on surfaces with a TNF-spacing of 200 nm. However, no increase in the rate of apoptosis induction could be observed in presence of MβCD within the first 3 h after seeding the cells. In contrast, a modest 10% decrease (68% of the cells underwent apoptosis in presence of MβCD compared to 78% in its absence) after 3 h of seeding on a 200 nm surface was detectable (Supporting Information). Although this change turned out not to be significant, it indicates that cholesterol supports rather than restricts TNFR1-Fas signaling. This could be explained by the formation of cholesterol dependent receptor nanoclusters of small size, like only 6–12 nm, supporting an efficient signaling complex formation and signaling transmission.(21) Together, these results argue against a cholesterol-enriched nature of the confinement zones of approximately 260 nm observed in our experiments. Another lateral segregation and restriction zone within the plasma membrane is driven by a network of membrane associated actin. Here, the size of the diffusional domains is determined by the mesh diameter of the membrane skeleton network which was shown to be about 300–600 nm.(22) These structures form highly dynamic membrane compartments and were also suggested to have an organizational role in signal transduction. Alternatively, the so-called tetraspanin web, a third class of membrane inhomogeneity, has been defined as a network of protein–protein interaction organized by tetraspanins.(23) A minor fraction of these tetraspanin assemblies can form membrane platforms stable in shape and localization with no apparent exchange with the rest of the membrane with a diameter of about 250 nm in average.(24) The maintenance of these platforms depends neither on membrane cholesterol nor on the underlying cytoskeleton. At the moment, we are unable to determine the roles of these different confinement zones for TNFR1-Fas signaling. However, our data suggest some functional role of such membrane areas in signaling initiation processes such as particular molecular events required for efficient TNFR1 (chimera) activation, which involve more than a single TNF positive gold dot within the same restriction area. The possible molecular nature of such interactions over a distance of more than 200 nm, however, is still elusive.
Supplementary Material
Acknowledgments
This work was supported in part by Center Systems Biology Stuttgart (project A2) and Deutsche Forschungsgemeinschaft Grants KR3307/1-1 and SCHE 349/7-2. The Max Planck Society is acknowledged for their financial support. J.P.S. holds a Weston Visiting Professorship at the Weizmann Institute, Department of Molecular Cell Biology. This publication and the project described herein were also partly supported by the National Institutes of Health, through the NIH Roadmap for Medical Research (PN2 EY 016586). The work was also supported by the Excellence Cluster “CellNetwork” of the University of Heidelberg.
References
- 1.Opferman JT, Korsmeyer SJ. Nat Immunol. 2003;4( 5):410–415. doi: 10.1038/ni0503-410. [DOI] [PubMed] [Google Scholar]
- 2.Elmore S. Toxicol Pathol. 2007;35( 4):495–516. doi: 10.1080/01926230701320337. [DOI] [PMC free article] [PubMed] [Google Scholar]
- 3.Degterev A, Yuan J. Nat Rev Mol Cell Biol. 2008;9( 5):378–390. doi: 10.1038/nrm2393. [DOI] [PubMed] [Google Scholar]
- 4.Aggarwal BB. Nat Rev Immunol. 2003;3( 9):745–756. doi: 10.1038/nri1184. [DOI] [PubMed] [Google Scholar]
- 5.Strasser A, Jost PJ, Nagata S. Immunity. 2009;30( 2):180–192. doi: 10.1016/j.immuni.2009.01.001. [DOI] [PMC free article] [PubMed] [Google Scholar]
- 6.Grell M, Douni E, Wajant H, Lohden M, Clauss M, Maxeiner B, Georgopoulos S, Lesslauer W, Kollias G, Pfizenmaier K, Scheurich P. Cell. 1995;83( 5):793–802. doi: 10.1016/0092-8674(95)90192-2. [DOI] [PubMed] [Google Scholar]
- 7.Schneider P, Holler N, Bodmer JL, Hahne M, Frei K, Fontana A, Tschopp JJ. Exp Med. 1998;187( 8):1205–1213. doi: 10.1084/jem.187.8.1205. [DOI] [PMC free article] [PubMed] [Google Scholar]
- 8.Holler N, Tardivel A, Kovacsovics-Bankowski M, Hertig S, Gaide O, Martinon F, Tinel A, Deperthes D, Calderara S, Schulthess T, Engel J, Schneider P, Tschopp J. Mol Cell Biol. 2003;23( 4):1428–1440. doi: 10.1128/MCB.23.4.1428-1440.2003. [DOI] [PMC free article] [PubMed] [Google Scholar]
- 9.Krippner-Heidenreich A, Tubing F, Bryde S, Willi S, Zimmermann G, Scheurich PJ. Biol Chem. 2002;277( 46):44155–44163. doi: 10.1074/jbc.M207399200. [DOI] [PubMed] [Google Scholar]
- 10.Scott FL, Stec B, Pop C, Dobaczewska MK, Lee JJ, Monosov E, Robinson H, Salvesen GS, Schwarzenbacher R, Riedl SJ. Nature. 2009;457( 7232):1019–1022. doi: 10.1038/nature07606. [DOI] [PMC free article] [PubMed] [Google Scholar]
- 11.Grell M, Wajant H, Zimmermann G, Scheurich P. Proc Natl Acad Sci USA. 1998;95( 2):570–575. doi: 10.1073/pnas.95.2.570. [DOI] [PMC free article] [PubMed] [Google Scholar]
- 12.Muppidi JR, Tschopp J, Siegel RM. Immunity. 2004;21( 4):461–465. doi: 10.1016/j.immuni.2004.10.001. [DOI] [PubMed] [Google Scholar]
- 13.Chan FK. Cytokine. 2007;37( 2):101–107. doi: 10.1016/j.cyto.2007.03.005. [DOI] [PMC free article] [PubMed] [Google Scholar]
- 14.Bryde S, Grunwald I, Hammer A, Krippner-Heidenreich A, Schiestel T, Brunner H, Tovar GE, Pfizenmaier K, Scheurich P Bioconjug. Chem. 2005;16( 6):1459–1467. doi: 10.1021/bc0501810. [DOI] [PubMed] [Google Scholar]
- 15.Cavalcanti-Adam EA, Micoulet A, Blummel J, Auernheimer J, Kessler H, Spatz JP. Eur J Cell Biol. 2006;85(3–4):219–224. doi: 10.1016/j.ejcb.2005.09.011. [DOI] [PubMed] [Google Scholar]
- 16.Geiger B, Spatz JP, Bershadsky AD. Nat Rev Mol Cell Biol. 2009;10( 1):21–33. doi: 10.1038/nrm2593. [DOI] [PubMed] [Google Scholar]
- 17.Spatz JP, Mossmer S, Hartmann C, Moller C. Langmuir. 2000;16( 2):407–415. [Google Scholar]
- 18.Glass R, Moller M, Spatz JP. Nanotechnology. 2003;14:1153–1160. [Google Scholar]
- 19.Glass R, Arnold M, Blummel J, Kuller A, Moller M, Spatz JP. Adv Funct Mater. 2003;13( 7):569–575. [Google Scholar]
- 20.Lommerse PH, Spaink HP, Schmidt T. Biochim Biophys Acta. 2004;1664( 2):119–131. doi: 10.1016/j.bbamem.2004.05.005. [DOI] [PubMed] [Google Scholar]
- 21.Harding AS, Hancock JF. Trends Cell Biol. 2008;18( 8):364–371. doi: 10.1016/j.tcb.2008.05.006. [DOI] [PMC free article] [PubMed] [Google Scholar]
- 22.Kusumi A, Suzuki K. Biochim Biophys Acta. 2005;1746( 3):234–251. doi: 10.1016/j.bbamcr.2005.10.001. [DOI] [PubMed] [Google Scholar]
- 23.Levy S, Shoham T. Nat Rev Immunol. 2005;5( 2):136–148. doi: 10.1038/nri1548. [DOI] [PubMed] [Google Scholar]
- 24.Espenel C, Margeat E, Dosset P, Arduise C, Le Grimellec C, Royer CA, Boucheix C, Rubinstein E, Milhiet PEJ. Cell Biol. 2008;182( 4):765–776. doi: 10.1083/jcb.200803010. [DOI] [PMC free article] [PubMed] [Google Scholar]
Associated Data
This section collects any data citations, data availability statements, or supplementary materials included in this article.