Abstract
The present study examined fixation frequency and duration during an EFT in an effort to better understand the attentional and perceptual processes by which individuals with ASD achieve accelerated EFT performance. In particular, we aimed to elucidate differences in the patterns of eye-movement in ASD and TD children, thus providing evidence relevant to the competing weak central coherence and enhanced perceptual functioning theories. Consistent with prior EFT studies, we found accelerated RT in children with ASD. No group differences were seen for fixation frequency, but the ASD group made significantly shorter fixations compared to TD group. Eye-movement results indicate that RT advantage in ASD is related to both weak central coherence and enhanced perceptual functioning.
Keywords: autism, reaction time, visual attention, visual perception, eye movement, eye fixation
Atypical visual-spatial perception in individuals with autism spectrum disorder (ASD) has been exemplified by enhanced performance on a variety of experimental tasks (see Dakin & Frith, 2005, for review). In particular, individuals with ASD have been shown to excel at the Embedded Figures Test (EFT; see Happé & Frith, 2006, for review). Although enhanced EFT performance in ASD is well replicated, the underlying mechanisms remain uncertain. The weak central coherence (WCC) theory posits that individuals with ASD have a processing bias towards local information, and thus fail to integrate parts to form a global whole (Happé & Frith, 2006). According to the WCC, accelerated performance during the EFT is a consequence of differences in implicit processing style; individuals with ASD perceive local parts, whereas typically developing (TD) individuals form a global percept before attending to the local elements of the global whole. Alternatively, Mottron and colleagues (2006) have proposed that accelerated EFT performance in ASD is the result of enhanced perceptual functioning (EPF). The EPF theory hypothesizes that local bias develops, not from a deficit in processing global information, but rather from superior low-level perceptual processes.
The present study examined fixation frequency and duration during an EFT in an effort to better understand the attentional and perceptual processes by which children with ASD achieve accelerated performance. In particular, we aimed to elucidate differences in the patterns of eye-movement in ASD and TD children, thus providing evidence relevant to the competing WCC and EPF theories. We used a modified version of an EFT designed by Manjaly and colleagues (2007) which included both embedded figure and baseline perceptual control conditions. We hypothesized that response time (RT) increases in the test compared to the baseline condition would be less pronounced in ASD compared to TD children. A further hypothesis was prompted by a recent study by Kemner et al. (2007), who suggested that fewer and/or shorter fixations underlie enhanced visual search in ASD. Analogously, we hypothesized that superior EFT performance in ASD would be the result of a reduced number and/or duration of fixations.
Methods
Participants
Fifteen school-age children with ASD and 11 TD children were recruited for the current study. Data from three children with ASD were incomplete due to noncompliance. The final sample thus included 12 children with ASD, all of whom met DSM-IV-TR (APA, 2000) criteria for autism spectrum disorder, and an age- and nonverbal IQ-matched comparison group of 11 TD children. Clinical diagnoses were confirmed using the Autism Diagnostic Interview-Revised (Rutter, Le Couteur, & Lord, 2003) and the Autism Diagnostic Observation Schedule (Lord, Rutter, DiLavore, & Risi, 1999).
TD participants had no reported personal or family history of autism and were confirmed to be free of autism-related symptoms or any other neurological or psychiatric conditions via parent report. Independent-samples t-tests confirmed that groups were matched on age, t(20)=0.1, p=.93, and nonverbal IQ, t(17) = −0.2, p=.83, as determined by the Wechsler Abbreviated Scale of Intelligence (Wechsler, 1999; see Table 1).
Table 1.
Participant Characteristics
| Autism (n = 12) | Comparison (n = 11) | |
|---|---|---|
| M (SD) | M (SD) | |
| Range | Range | |
| Age | 12;11 (2;5) | 13;11 (3;10) |
| 9;3 – 16;9 | 8;2 – 22;0 | |
| Verbal IQ | 107 (14) | 112 (16) |
| 80 – 128 | 88 – 133 | |
| Nonverbal IQ | 109 (19) | 109 (13) |
| 76 – 140 | 94 – 129 |
Apparatus
The experiment was presented using NeuroBS Presentation software on a 2.8 GHz/512MB PC on a 19-inch CRT display. Participants were seated approximately 60 cm from the monitor. Test responses were registered with a Cedrus button box.
Participants’ point of gaze was monitored using a binocular EyeLink II Eye-Tracking System (250Hz). Infrared illumination of the eyes was supplied by unobtrusive LEDs mounted on a lightweight, padded headpiece. Eye images were captured by two infrared cameras while a third camera monitored head position to compensate for any participant movement. Fixations were defined as eye-movements with dwell time greater than 100 ms within an area of 1° of visual angle at a resolution of less than 0.01°.
Stimuli
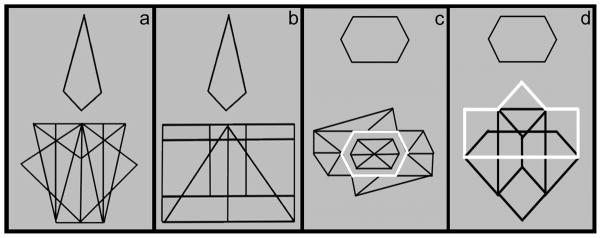
Test trials consisted of eight simple target shapes taken from the original EFT (Witkin, Oltman, Raskin, & Karp, 1971). Target shapes were displayed above a larger complex figure. All shapes were black on a light blue background. Baseline trials were presented in the same format, but the target shape was outlined in white within the complex figure (Figure 1). At a viewing distance of approximately 60 cm, targets subtended 3.3–12° by 3.2–11.3° visual angle and complex figures subtended 7.1–17° by 7.4–17.4° visual angle. Target shapes were repeated 3 to 5 times over the course of the experiment. However, to avoid practice effects, each trial (test and baseline) presented a unique pairing of target shape and complex figure.
Figure 1.
Illustration of test target present (a) test target absent (b) baseline target present (c) and baseline target absent (d). Light blue background is represented in gray.
Design
The experiment consisted of 40 test and 30 baseline trials. A target was present on half of the trials (20 test, 15 baseline). Test and baseline trials were presented in random order.
Procedure
Participants were asked to respond as to whether the target shape was present or absent. Stimuli were displayed for 6000 ms in test and 2000 ms in baseline trials. After each trial, a blank screen appeared for 1000 ms. Participants were instructed to respond as quickly as possible without making errors. Practice trials were administered with corrective feedback.
Results
Unless noted otherwise, statistical tests for all dependent measures were mixed-model repeated measures analyses of variance (ANOVA) with the following parameters: between-subject factor group (ASD, TD), within-subject factors condition (test, baseline) and target presence (absent, present). Partial eta-squared (ηp2) was used as a measure of effect size. RT and eye-movement data were analyzed for correct trials only.
Behavioral Results
Response time
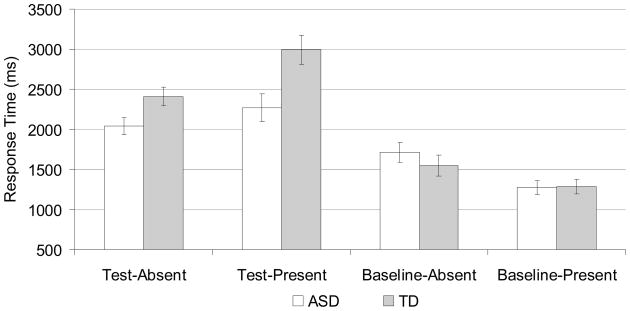
RT was significantly longer in test than baseline trials, F(1,21)=113.0, p<.001, ηp2=.84. As illustrated in Figure 2, there was a main effect of group, F(1,21)=4.5, p<.05, ηp2=.18, and a group by condition interaction, F(1,21)=11.5, p<.005, ηp2=.35. Analysis of this interaction showed that the ASD group performed significantly faster than the TD group in the test target absent, F(1,21)=5.3, p<.05, ηp2=.20, and test target present, F(1,21)=8.4, p<.01, ηp2=.29, but not the baseline target absent, F(1,21)=0.8, p>.3, ηp2=.04 or baseline target present conditions, F(1,21)=0.0, p>.9, ηp2=.00. These RT results did not change when age was included as covariate.
Figure 2.
Median RT for correct trials only as a function of condition and target presence. Error bars represent standard errors of means.
Error
Error rates were significantly higher for test compared to baseline, F(1,21)=30.5, p<.001, ηp2=.59, and present compared to absent trials, F(1,21)=22.0, p<.001, ηp2=.51. There was no difference between groups in error rate, F(1,21)=0.3, p>.5, ηp2=.02, nor were there any interactions between group and other factors. Separate ANOVAs for d′ showed that groups did not differ in d′ for the test, F(1,21)=1.0, p>.3, ηp2=.05, or baseline conditions, F(1,21)=.1, p>.7, ηp2=.00. These results did not change when age was included as a covariate.
Eye-Movement Results
Fixation frequency (number fixations per trial) and duration were collected from the onset of each trial until participant response. Fixations to target shape and the complex figure were analyzed separately to assess differences in encoding and discrimination processes while individuals were attending to different regions within the stimulus. Regions of interest (ROI) were defined as target and figure by bisecting the stimulus into two sections at the midpoint between the target shape and the complex figure. In addition, fixation durations were categorized based on order of occurrence. First fixations were defined as initial fixations occurring after stimulus onset that included a post-fixation saccade. First fixations reflect initial encoding of stimulus features and the latency to make first saccade toward a perceived target. Final fixations were defined as the last fixation occurring prior to a participant’s response, and correspond to target identification and response-making processes.
All Fixations – Fixation Frequency and Duration
Fixation frequency was greater in the test (M = 5.4) than baseline trials (M = 3.2), F(1,21)=29.1, p<.001, ηp2=.58. There was no main effect of group (ASD: 4.3, TD: 4.3), F(1,21)=0.1, nor were there any group interaction effects for fixation frequency. Furthermore, there was no difference between groups for fixation frequency to target (ASD: 1.5, TD: 1.2), F(1,21)=0.1, p>.1, ηp2=.11, or figure ROI (ASD: 2.8, TD: 3.1), F(1,21)=0.1, p>.7, ηp2=.00.
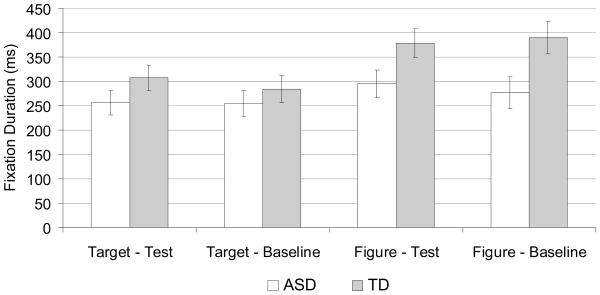
However, children with ASD made significantly shorter fixations compared to TD children, F(1, 21)=7.6, p<.05, ηp2=.27. As illustrated in Figure 3, ROI analysis of fixation durations revealed that ASD children made significantly shorter fixations to figure ROI, F(1,21)=5.7, p<.05, ηp2=.21, but not target ROI, F(1,21)=1.4, p>.2, ηp2=.06, compared to TD children.
Figure 3.
Mean fixation duration for correct trials only to target and figure ROIs for test and baseline conditions.
First and Final Fixation Durations
Fixation duration data for first and final fixations are displayed in Figure 4. First fixations were marginally shorter in the baseline compared to test condition, F(1,21)=3.5, p<.08, ηp2=.14, reflecting the increased saliency of the target in the baseline condition. ASD participants made significantly shorter first fixations than TD participants, F(1,21)=7.0, p<.05, ηp2=.25. In addition, there was a significant group by condition interaction, F(1,21)=5.2, p<.05, ηp2=.20. Because age has been related to more efficient control of saccades (Kramer, de Sather, & Cassavaugh, 2005), age was included as covariate in analyses of first fixation duration (i.e. latency to make initial saccade). Results remained unchanged. Separate ANOVAs for ASD and TD children revealed a marginally significant effect of condition for TD children, F(1,10)=4.3, p<.07, ηp2=.30, but not for ASD children, F(1,11)=0.6, p>.4, ηp2=.05, reflecting no difference in duration of first fixation between conditions in ASD, but longer fixations for test compared to baseline condition for TD children. Final fixations were significantly shorter for ASD as compared to TD children, F(1,21)=8.8, p<.01, ηp2=.30.
Figure 4.
Mean fixation duration for correct trials only for first and final fixations for test and baseline conditions.
Discussion
Our study investigated fixation frequency and duration during an EFT in ASD and TD children. Consistent with prior EFT research, we found accelerated RT in individuals with ASD. Similar to Manjaly et al. (2007), we observed interaction between group and condition. However, whereas Manjaly et al. found equivalent RT in the EFT and slower RT in the baseline condition for ASD as compared to TD individuals, our ASD group was significantly faster at the EFT and equivalent in the baseline condition, compared to TD children. This pattern of superior performance in ASD on tasks in which processing of global features impedes performance (test trials), and equivalent performance in tasks for which a local processing strategy is no longer advantageous (baseline trials), is consistent with a model of enhanced perceptual processing, as proposed by Mottron et al. (2006).
Analysis of eye-movements revealed that while ASD and TD groups did not differ in fixation frequency during either test or baseline trials, or in the frequency with which they fixated on the target or figure, fixation durations were significantly shorter in children with ASD across all trial types. To further elucidate differences, fixation durations were analyzed based on location. Only fixations on the complex figure, not those located on the target shape, were significantly shorter in ASD compared to the TD group, suggesting that any perceptual advantage that may be reflected in shorter fixation durations occurred while ASD children attended to the complex figure.
Fixations were further grouped into first and final fixations. First fixations were significantly shorter for ASD compared to TD children, suggesting that the ASD group was faster at initially encoding stimulus features and planning initial saccades. In addition, first fixation durations were significantly longer in test compared to baseline conditions for TD children, but not for children with ASD, suggesting that children with ASD perceived the target in both test and baseline condition as equally salient. This result is congruent with the WCC theory. If children with ASD perceive the local features of the complex figure, as opposed to the global whole, latency to initiate first saccade should be similar in both test and baseline trials. Similarly, Jarrold et al. (2005) showed that while RT for an EFT was correlated with conjunctive search slopes in TD individuals, EFT RT was correlated with feature search slopes in individuals with ASD, indicating that targets may ‘pop out’ for individuals with ASD.
While similar initial fixation durations for test and baseline conditions in the ASD group may be indicative of a local processing bias associated with the WCC theory, shorter durations for all fixations, including first and final fixations, suggests that individuals with ASD are quicker at discriminating the stimulus at each fixation. These results indicate that enhanced lower-level perceptual processes may also play a role in ASD EFT advantage.
In summary, our findings suggest that the EFT advantage in children with ASD arises from both local perception of global figures and enhanced discrimination. Previous fMRI studies have demonstrated decreased involvement of frontal cortices during EFT in ASD (Lee, Foss-Feig, Henderson, Kenworthy, Gilotty, Gaillard, et al., 2007; Ring, Baron-Cohen, Wheelwright, Williams, Brammer, Andrew, et al., 1999), indicative of reduced need to suppress global perception, and increased right occipital involvement in ASD (Manjaly et al., 2007; Ring et al., 1999), which may represent enhanced processing of local features. Our findings are consistent, providing partial support for both WCC and EPF models.
Acknowledgments
The research was supported by the National Institutes of Health, R01-DC006155, with additional funding from 1T32 DC007361-03 (BK) and NIGMS SDSU MBRS Program 5R25GN58906 (AIR). Special thanks to Natacha Akshoomoff for help in the recruitment of ASD participants, Sylvia Knust for help with data collection, and especially the children and families who generously participated.
References
- American Psychiatric Association. Diagnostic and statistical manual of mental disorders. 4. Washington D.C: 1994. [Google Scholar]
- Dakin S, Frith U. Vagaries of visual perception in autism. Neuron. 2005;48(3):497–507. doi: 10.1016/j.neuron.2005.10.018. [DOI] [PubMed] [Google Scholar]
- Happé F, Frith U. The weak coherence account: Detail-focused cognitive style in autism spectrum disorders. Journal of Autism and Developmental Disorders. 2006;36(1):5–25. doi: 10.1007/s10803-005-0039-0. [DOI] [PubMed] [Google Scholar]
- Jarrold C, Gilchrist ID, Bender A. Embedded figures detection in autism and typical development: Preliminary evidence of a double dissociation in relationships with visual search. Developmental Science. 2005;8(4):344–351. doi: 10.1111/j.1467-7687.2005.00422.x. [DOI] [PubMed] [Google Scholar]
- Kemner C, van Ewijk L, van Engeland H, Hooge I. Brief report: Eye movements during visual search tasks indicate enhanced stimulus discriminability in subjects with PDD. Journal of Autism and Developmental Disorders. 2007 doi: 10.1007/s10803-007-0406-0. [DOI] [PMC free article] [PubMed] [Google Scholar]
- Kramer AF, de Sather JC, Cassavaugh ND. Development of attentional and oculomotor control. Developmental Psychology. 2005;41(5):760–772. doi: 10.1037/0012-1649.41.5.760. [DOI] [PubMed] [Google Scholar]
- Lee PS, Foss-Feig J, Henderson JG, Kenworthy LE, Gilotty L, Gaillard WD, et al. Atypical neural substrates of embedded figures task performance in children with autism spectrum disorder. Neuroimage. 2007;38(1):184–193. doi: 10.1016/j.neuroimage.2007.07.013. [DOI] [PMC free article] [PubMed] [Google Scholar]
- Lord C, Rutter M, DiLavore PC, Risi S. Autism Diagnostic Observation Schedule - WPS (ADOS-WPS) Los Angeles, CA: Western Psychological Services; 1999. [Google Scholar]
- Manjaly ZM, Bruning N, Neufang S, Stephan KE, Brieber S, Marshall JC, et al. Neurophysiological correlates of relatively enhanced local visual search in autistic adolescents. Neuroimage. 2007;35(1):283–291. doi: 10.1016/j.neuroimage.2006.11.036. [DOI] [PMC free article] [PubMed] [Google Scholar]
- Mottron L, Dawson M, Soulieres I, Hubert B, Burack J. Enhanced perceptual functioning in autism: An update, and eight principles of autistic perception. Journal of Autism and Developmental Disorders. 2006;36(1):27–43. doi: 10.1007/s10803-005-0040-7. [DOI] [PubMed] [Google Scholar]
- Ring HA, Baron-Cohen S, Wheelwright S, Williams SC, Brammer M, Andrew C, et al. Cerebral correlates of preserved cognitive skills in autism: A functional MRI study of embedded figures task performance. Brain. 1999;122(Pt 7):1305–1315. doi: 10.1093/brain/122.7.1305. [DOI] [PubMed] [Google Scholar]
- Rutter M, Le Couteur A, Lord C. Autism Diagnostic Interview – Revised. Los Angeles, CA: Western Psychological Services; 2003. [Google Scholar]
- Wechsler D. Wechsler’s abbreviated scale of intelligence. San Antonio, Texas: The Psychological Corporation; 2000. [Google Scholar]
- Witkin HA, Oltman PK, Raskin E, Karp SA. Manual embedded figures test, children’s embedded figures test, group embedded figures test. Consulting Psychologists Press; 1971. [Google Scholar]


