

Abstract
Background
Autism is a developmental neurobiologic disorder associated with structural and functional abnormalities in several brain regions including the cerebral cortex. This longitudinal study examines developmental changes in brain volume and cortical thickness (CT) using magnetic resonance imaging (MRI) in children with autism.
Methods
MRI scans and behavioral measures were obtained at baseline and after a 30-month interval in a sample of males with autism (n=18) and healthy age-, and gender- matched controls (n=16) between the ages of 8 and 12 years at baseline.
Results
No differences in brain volumes were observed between the autism group and controls at baseline and at follow-up. However, differences in total grey matter volumes were observed over time with significantly greater decreases in the autism group compared to controls. Differences in CT were observed over time with greater decreases in the autism group compared to controls in several brain regions including the frontal lobe. Furthermore, several associations were observed between several clinical features and changes in CT with greater thinning of the cortex being correlated with more severe symptomatology.
Conclusion
Findings from this study provide preliminary evidence for age-related changes in grey matter volume and CT in children with autism that are associated with symptoms severity. Future longitudinal studies of larger sample sizes are needed to evaluate developmental changes and examine the relationships between structural changes and clinical expressions of the disorder.
Keywords: cerebral cortex, development, clinical features, severity, social deficits, repetitive behaviors
INTRODUCTION
Autism is a complex neurodevelopmental disorder associated with structural and functional abnormalities in several brain regions including the cerebral cortex. Neuroimaging studies have reported a wide range of anatomical alterations but increased brain volume in young children with autism is one of the most consistent neurobiologic findings (1–6). However, it remains unclear how long this enlargement persists and whether increased volume is primarily comprised of grey matter or white matter. In one of the first studies to observe age-related changes, an increase in brain size was observed in children and adolescents with autism but not in adults (2). A larger study of children with autism (1) reported that by ages 2 to 4 years, 90% of autistic boys had a brain volume larger than normal matched controls, whereas older autistic children and adolescents did not exhibit this enlargement. Young children had more cerebral (18%) and cerebellar (39%) white matter, and more cerebral cortical grey matter (12%) when compared to controls. While examining the same sample, Carper et al.,(3) observed increased size of all cortical lobes with the frontal showing the greatest enlargement. Interestingly, developmental changes were also observed in frontal, temporal, and parietal white matter with frontal and temporal grey matter volume showing a slower increase in size in the autistic group when compared to controls. These observations suggest the existence of age-related changes in brain size in autism and longitudinal studies are warranted to shed light on this process.
Though less robust than the finding of enlarged cerebral volume, several investigations have examined the size of the corpus callosum in autism and revealed a reduction in one or more components of this primary white matter tract including the anterior (genu and rostrum), middle (body), or posterior (isthmus and splenium) subregions (7). This observation appears to be consistent with the theory of aberrant connectivity in autism. In fact, several investigations have reported lower functional connectivity in individuals with autism when compared to controls while performing a sentence comprehension task (8) a visuo-motor task (9) and an inhibition task (10). While mounting evidence is emerging supporting this hypothesis, the exact structural underpinnings of these disturbances remains to be determined. White matter disturbances and brain surface parameters such as cortical grey matter thickness and gyrification patterns have been implicated in the pathophysiology of the aberrant connectivity syndrome.
Over the last decade, investigations of cortical white matter have reported structural alterations in autism. Volumetric and diffusion tensor imaging (DTI) studies have examined several brain regions and observed diffuse abnormalities. Volumetric differences in white matter regions have been found in young children with autism (11) and these alterations appear to affect mostly outer radiate compartments (12). In addition, DTI studies have found reduced fractional anisotropy (a measure of coherent fiber tract directionality) in white matter regions including the anterior cingulate, the temporoparietal junctions, the corpus callosum, ventromedial prefrontal cortices, and the temporal lobes (13,14). Although these findings implicate white matter tract abnormalities in autism, it is unlikely that these findings exist in the absence of cortical grey matter abnormalities. Abnormally narrow cortical minicolumn architecture has been a well documented finding in autism and it is hypothesized that such abnormal architecture could result in fewer long distance connecting fibers in comparison to abundant short distance connections (15).
Surface parameters including cortical thickness (CT) have been examined in autism (16, 17). Postmortem studies have reported alterations of cortical grey matter including increased CT and neuronal density (16). Abnormalities in CT have also been reported in neuroimaging studies. Increased total cerebral sulcal and gyral thickness were observed in a sample of 17 male children with autism when compared with 14 healthy gender- and IQ-matched controls (17). This increase was mostly observed in the temporal and parietal lobes but not in the frontal and occipital. These preliminary findings indicate that increased CT may contribute to the increased grey matter volume and total brain size that have been observed in children with autism and may also be related to anomalies in cortical connectivity. However, findings of increased cortical thickness have not consistently been reported with recent reports describing a decrease (18) or even the absence of any abnormalities in CT in autism (19). These reports have examined mostly adults with autism while Hardan et al. (17) included only children. Therefore, and in light of the developmental abnormalities observed in autism, it is possible that increased CT is present in children but not in adolescents and longitudinal studies are warranted to examine these age-related changes.
The goal of the present investigation was to conduct a longitudinal study to examine total brain volume and CT in a sample of male children with autism who were evaluated at a 30 month interval. Based on the available evidence, we hypothesized that increased total brain volume and CT would be observed at baseline but not at follow up. We also predicted that structural changes observed overtime would be associated with clinical features.
METHOD
Participants
Thirty four children and adolescents (Autism: 18; Controls: 16) were selected from an original sample of 40 who met inclusion an exclusion criteria. One individual with autism was not willing to be part of the procedures at follow-up due to the discomfort he experienced during the MRI scanning. Three individuals with autism were excluded since they did not have good quality scans at either baseline or follow-up. Two control subjects were not able to participate in the follow-up MRI scanning since family had moved to a different state. The study was confined to boys because the sample size was too small to accommodate structural variability associated with gender.
Subjects were 18 boys with autism and 16 healthy male controls between 8 and 12 years of age at baseline. Participants with autism represented all consecutive referrals to a research clinic eligible to participate in the study. The diagnosis of autism was established through expert clinical evaluation and two structured research diagnostic instruments, the Autism Diagnostic Interview-Revised (ADI-R) (20) and the Autism Diagnostic Observation Schedule (ADOS) (21). Children with secondary autism such as tuberous sclerosis and Fragile X were excluded.
Controls were children recruited from the community through advertisements in areas socioeconomically comparable to those of the families of origin of the autistic subjects. Socioeconomic status for all subjects was assessed using the Hollingshead method (22). Control subjects were screened by face-to-face interviews, questionnaires, telephone interviews, and observation during psychometric tests, and individuals with a family history of any neuropsychiatric disorder, such as autism, learning disability, affective disorders, and schizophrenia, were not included. Potential subjects with a history of birth asphyxia, head injury, or a seizure disorder were also excluded. All control subjects had a full scale IQ (FSIQ) > 70 and no learning disability as assessed by the Wide Range Achievement Test (3rd edition). Potential subjects were excluded if found to have evidence of birth asphyxia, head injury, or a seizure disorder. Exclusions were based on neurologic history and physical examination as well as laboratory testing when indicated. The WISC-III was administered to measure IQ. Participant demographics are provided in Table 1.
Table 1.
Characteristics of individuals with autism and controls at baseline and follow-up
| Autism | Control | t-test | ||||
|---|---|---|---|---|---|---|
| N=18 | N=16 | Df 32 | ||||
| Mean | SD | Mean | SD | T | P | |
| Time 1 | ||||||
| Age (years) | 10.9 | 1.2 | 10.7 | 1.2 | 0.613 | 0.544 |
| Full-scale IQ | 93.9 | 17.0 | 113.1 | 12.9 | −3.668 | 0.001 |
| SES | 4.5 | 0.6 | 4.3 | 0.6 | 1.214 | 0.234 |
| ADI-R | 51.2 | 7.4 | -- | -- | -- | -- |
| ADOS | 15.5 | 3.1 | -- | -- | -- | -- |
| Time 2 | ||||||
| Age (years) | 13.3 | 1.4 | 12.6 | 1.2 | 1.428 | 0.163 |
SES: Socioeconomic status; ADI-R: autism diagnostic interview-revised; ADOS: autism diagnostic observation schedule.
MRI Scans. Brain scans were obtained using the same acquisition protocol at baseline as well as at follow-up. The mean age of subjects (autism and controls) was 10.9 years (range: 8.1 to 12.9 years) at baseline and 12.8 years (range 11.0 to 15.4 years) at follow-up. The mean time difference between the two scans was 2.1 years with a range of 0.7 to 3.7 years. No difference in this interval period was observed between individuals with autism (2.3 years) and controls (2.0 years) (t=1.414; df 32; p=0.167)
All scans were obtained on the same GE 1.5 Tesla Signa whole-body MRI system (GE Medical Systems, Milwaukee, WI). A T1-weighted SPGR sequence was first acquired with the following parameters: slice thickness=1.5mm, slice numbers=124; TE 5ms; TR 25ms; flip angle 40 degrees, NEX 1; FOV 24cm; matrix 256×192. Proton density (PD) and T2-weighted images were then obtained using a single double-echo protocol with the following parameters: slice thickness=5mm; TE 17ms for PD or 102ms for T2; TR 2500ms; NEX 1; FOV 24cm; matrix 256×192; total slices = 24. All images were obtained in the coronal plane. MRI data were identified by scan number to retain blindness and analyzed using Brain Research: Analysis of Images, Networks and Systems software (BRAINS) while applying previously published methodologies of total brain volume (TBV) measurements (23). The image processing was performed on a SGI workstation (Silicon Graphics Inc., Mountain View, CA) using the BRAINS2 (University of Iowa, Iowa City, IA, USA) software package.
The image data was normalized to standard Talairach stereotactic three-dimensional space (24) by identifying six brain-limiting points (anterior, posterior, superior, inferior, left, and right); the anterior-posterior commissure line specified the x-axis, a vertical line rising from the x-axis through the interhemispheric fissure specified the y-axis, and a transverse orthogonal line with respect to x and y coordinates specified the z-axis. Registration was performed by aligning the T2 and PD images with a resampled T1 image and then resampling the T2 and PD images themselves (23). After normalization to a standard three-dimensional space, the pixels representing grey matter, white matter, and cerebrospinal fluid were identified using a segmentation algorithm applied to the T1, T2, and PD image sequences (25).
Volumetric measurements were performed using the BRAINS2 masks as generated by a neural network and corrected by manual tracing (ICC >0.9). Total brain volume (TBV) was defined as the cerebrum, cerebellum, and brainstem while excluding cerebrospinal fluid (23). The initial step of surface analysis in BRAINS is the creation of a triangle–based isosurface using the parametric center of the cortex as the outer boundary of the brain (26). CT is calculated from vectors that are normal to each triangular surface, and the shortest distance to the 50% grey matter and 50% white matter is defined as the thickness. Taking in consideration that the triangle isosurface lies at the parametric center of grey matter (approximately half of the actual CT), the values are multiplied by two (26).
Data Analysis
Between-group differences on demographic data and changes over time were analyzed with two-tailed Student t-tests and were reported as means and standard deviations (M ± SD). Within-group differences were analyzed using Paired-test. Multivariate analysis of variance (MANOVA) and covariance (MANCOVA) were applied to compare subject groups on neurobiologic measurements while controlling for confounding factors such as IQ when indicated. Pearson’s correlation coefficients were used to examine the association between neuroimaging measurements and confounding factors. Spearman’s rho correlation coefficients were used to examine the relationship between changes in CT measurements over time and ADI-R. Probability figures were considered significant if they achieved significance at conventional levels (i.e., p < 0.05). The false discovery rate approach was used to correct for multiple comparisons (27, 28).
RESULTS
No differences were observed between participants with autism and the control group on any of the demographic characteristics except for FSIQ (Table 1). Changes over time were examined and differences in grey matter volumes were observed (Δ= Time 02 – Time 01) with significantly more decrease in grey matter volume in the autism group when compared to controls. Similar changes were found in CT in the whole brain and in several brain regions including the temporal lobe (Table 2). When accounting for multiple comparisons, differences between the two groups were lost except for changes in occipital CT. Within-group differences revealed several differences in structural measurements in both groups (Table 3). However, differences CT in the frontal, parietal, occipital and total brain in the autism group remained significant after controlling for multiple comparisons. Multivariate analysis of variance revealed no significant patient, time, or patient by time interaction for volumetric measurements (p=0.124) and CT (p=0.099). No correlations were found between changes in CT over time and FSIQ in either group except in the occipital lobe in the control group (r= 0.535, p=0.033). Despite the absence of correlation, analyses were conducted while controlling for FSIQ, and differences between the two groups disappeared. No associations were found between changes in TBV and FSIQ in either group.
Table 2.
Changes in cortical thickness between time 01 and time 02 (Δ= Time 02–Time 01) in the autism group and controls:
| Brain structure measurements | Autism | Controls | Independent t-test | |||
|---|---|---|---|---|---|---|
| N=18 | N=16 | Df=32 | ||||
| Mean Δ | SD | Mean Δ | SD | t | p | |
| Brain volume (cc) | ||||||
| TGM | −11.0 | 23.8 | 4.2 | 18.3 | −2.072 | 0.046 |
| TWM | 12.5 | 33.1 | 10.3 | 18.1 | 0.241 | 0.811 |
| TBV | 1.5 | 33.8 | 14.5 | 19.9 | −1.340 | 0.190 |
| Cortical Thickness (mm) | ||||||
| Frontal Lobe | −0.5 | 0.5 | −0.2 | 0.4 | −1.886 | 0.068 |
| Occipital Lobe | −0.5 | 0.4 | −0.1 | 0.3 | −2.946 | 0.006 |
| Parietal Lobe | −0.6 | 0.7 | −0.3 | 0.5 | −1.572 | 0.126 |
| Temporal Lobe | −0.3 | 0.6 | 0.1 | 0.4 | −2.255 | 0.032 |
| Total Brain | −0.5 | 0.5 | −0.1 | 0.4 | −2.259 | 0.031 |
TBV: Total Brain Volume; TWM: Total White Matter; TGM: Total Grey Matter
Table 3.
Volumes and cortical thickness at time 01 and time 02 in the autism group and controls:
| Structures | Autism1 | Autism 2 | Paired t-test | Controls 1 | Controls 2 | Paired t-test | ||||||
|---|---|---|---|---|---|---|---|---|---|---|---|---|
| Df (17) | Df (15) | |||||||||||
| M | SD | M | SD | t | p | M | SD | M | SD | t | p | |
| Volume (cc) | ||||||||||||
| TBV | 1345.96 | 129.42 | 1347.49 | 126.21 | −0.2 | 0.85 | 1318.27 | 93.41 | 1332.79 | 88.10 | −2.91 | 0.011 |
| TWM | 478.48 | 43.33 | 491.03 | 51.09 | −1.6 | 0.13 | 483.24 | 36.63 | 493.54 | 29.33 | −2.28 | 0.038 |
| TGM | 867.48 | 92.91 | 856.47 | 81.08 | 1.96 | 0.066 | 835.04 | 65.15 | 839.24 | 64.17 | −0.92 | 0.371 |
| Cortical Thickness (mm) | ||||||||||||
| Frontal | 5.34 | 0.27 | 4.82 | 0.21 | 4.04 | 0.001 | 5.14 | 0.19 | 4.94 | 0.15 | 2.011 | 0.063 |
| Temporal | 5.06 | 0.32 | 4.72 | 0.26 | 2.23 | 0.039 | 4.56 | 0.15 | 4.62 | 0.15 | −0.68 | 0.509 |
| Parietal | 5.02 | 0.33 | 4.42 | 0.19 | 3.92 | 0.001 | 4.66 | 0.15 | 4.38 | 0.19 | 2.53 | 0.023 |
| Occipital | 4.24 | 0.28 | 3.78 | 0.18 | 5.27 | 0.000 | 3.98 | 0.17 | 3.84 | 0.08 | 1.90 | 0.077 |
| Total brain | 4.98 | 0.26 | 4.52 | 0.19 | 3.99 | 0.001 | 4.70 | 0.13 | 4.54 | 0.14 | 1.76 | 0.099 |
TBV: Total Brain Volume; TWM: Total White Matter; TGM: Total Grey Matter
The examination of the relationships between changes in CT overtime (Δ= Time 02 – Time 01) and clinical features revealed several associations. Correlations were observed between change in frontal lobe CT and qualitative impairment in reciprocal social interaction (R=−0.478; p=0.045) and lack of socio-emotional reciprocity (R=−0.506; p=0.032) (Figure 1) as measured by the ADI-R. An association was also found between change in temporal lobe CT and repetitive behaviors/stereotyped patterns (R=−0.484; p=0.042).
Figure 1.
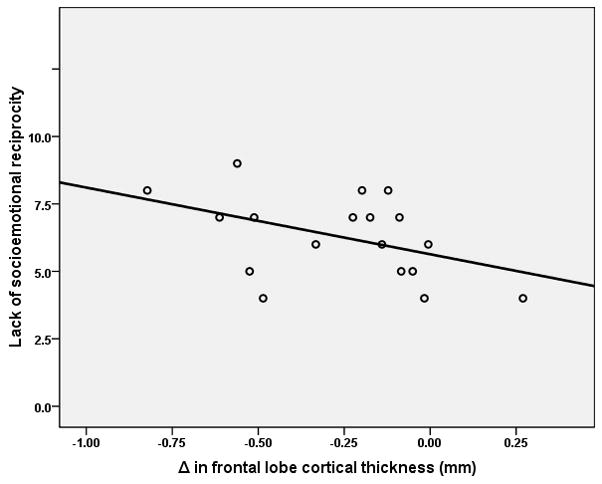
Relationship between lack of socioemotional reciprocity as measured by the autism diagnostic interview–revised and changes in cortical thickness over time (Δ= time 02 – Time01) in the frontal lobe in the autism group (R=−0.506; N= 18; p=0.035).
DISCUSSION
In this longitudinal investigation, we measured developmental changes in brain volume and in CT in a group of children aged 8–12 years with autism and healthy controls. Decrease in grey matter volume was observed over time and appeared to be related, at least partially, to a decrease in CT. However, these findings disappeared when analyses were controlled for FSIQ which could be related to the small sample size. Associations between developmental changes in CT and several clinical features were also observed. Despite the small sample size and the narrow age range, these preliminary findings emphasize that the time course of brain development rather then the final product is most disturbed in autism (29).
Over the last two decades several neuroimaging structural investigations have reported an increase in brain size in autism (2, 30–31). More recently, additional evidence has emerged pointing to the presence of brain enlargement in individuals with autism and more importantly to the existence of age-related volumetric changes involving total brain as well as specific cerebral lobes (1–5). Our findings in the present investigation are consistent with some but not all of these observations. No differences in brain volume were observed here which is inconsistent with most previous studies of brain volume. This discrepancy could be related to the small sample size and/or to the age of participants. However, our result of age-related changes in grey matter volume is concordant with several cross-sectional studies providing indirect evidence of abnormal developmental trajectories in autism (1–5).
In the present investigation, decrease in CT over time was observed in the autism and control groups. This decrease involved several brain regions including the frontal, parietal, and occipital lobes. These observations are consistent with previous investigations in typically developing children, between the ages of 5 and 11 years, reporting cortical thinning over large brain areas such as the right dorsolateral frontal and bilateral occipitoparietal cortices (32). Interestingly, increase in CT over time was observed here in the temporal lobe in healthy controls but not in the autism group which is concordant with findings of grey matter thickening in left and right posterior perisylvian regions of Wernicke’s area in neurotypical children (32). These structural alterations in the temporal lobe suggest the existence of an aberrant cortical development in autism and might explain the previously reported functional abnormalities in this structure (33).
Several clinical features including social deficits and repetitive behaviors were associated with changes in CT overtime in different brain regions in the autism group. Neuroanatomical measurements in the frontal lobe were associated with social functioning. This observation is consistent with recent evidence implicating the mirror neuron system in autism (18, 34) and with investigations reporting on abnormalities in the frontal lobe circuitry in this disorder (18, 35). In the present study, relationships were also observed between repetitive/stereotyped patterns of behaviors and changes in CT the temporal lobe in the autism group. This association is concordant with a structural MRI study which found partial correlations between repetitive behavior measures and volumes of multiple regions including those in the temporal lobe (36). This relationship is also supported by recent evidence from neuroimaging studies examining individuals with obsessive-compulsive disorder, which is characterized by repetitive/ritualistic behaviors, and reporting on structural abnormalities in the temporal lobe (37, 38). Finally, all the correlations described above appear to indicate that excessive thinning of the cortex was associated with more severe symptomatology independent of the clinical feature and the brain region involved. Elevated scores on the ADI-R subdomains correlated with more decreases in CT. These observations suggest that changes in CT over time might serve as an indicator of illness severity, but further studies are definitely warranted.
Our preliminary observations point to an excessive decrease in grey matter volume and CT in individuals with autism during a period of development when competitive elimination of synapses and dendritic/axonal arborization represent the main neuronal structural activity. These findings should be examined in light of the recent evidence suggesting that changes in grey matter volumes, may, at least in part, reflect intracortical myelination and the resulting partial volume effect (39). Changes in CT overtime observed in the present investigation could reflect alterations in grey/white matter boundary related to myelination and changes in the cortical mantle itself. Hence, increase in white matter volume could lead to cortical thinning as a consequence of increased myelination between grey and white matter in the periphery of the cerebrum. However, in the present investigation no differences in white matter volumes in the two groups were observed at baseline, at follow-up and over time. This observation suggest that the excessive decrease in CT observed in the autism group is related to decrease in grey matter possibly related to alterations of the cortical grey matter during the peri-adolescence period. An excessive decrease in any of the different elements of the cortical mantle (cell bodies, neuropil, and synapses of neurons) in isolation or in combination could lead to the findings observed here. Consequently, neuropathologic studies of individuals with a wide age range are therefore warranted to assess the basic histologic features of the cortex in autism in different age groups to determine the exact ultrastructural underpinnings of these alterations. In the absence of white matter volume changes, these alterations suggest the existence of alterations intrinsic to grey matter in autism during the peri-pubertal period and could be related to synaptic development and maturation. This observation is supported by evidence from genetic studies reporting a link between several genes implicated in synapse formation and dendritic spine maturation, such as SHANK3, and autism (40).
The neurobiologic underpinnings of cortical changes observed in the present investigations remains to be elucidated. Previous research has implicated several neurotrophins, including brain-derived neurotrophic factor (BDNF), in neuronal development (41). Several studies have reported on abnormal serum levels of BDNF in individuals with autism throughout the lifespan (42–45). Interestingly, age-related differences have been reported with a recent study describing lower levels of BDNF in the serum of children with autism under 9 years of age when compared to adolescents, adults and control subjects (45). These developmental changes might be related to the altered peri-pubertal cortical organization observed in the present study. Additionally, the serotoninergic system has have also been implicated in autism (46). This system might be playing a role in the abnormal brain development in autism either directly or indirectly by regulating neuronal development signaling factors for neurotrophins (47). However, while mounting evidence is emerging linking abnormalities in neurotrophins and serotonin to autism, it is not clear whether these alterations are the primary cause or secondary to the altered cortical changes or just an associated process. Finally, structural and neurobiologic abnormalities should also be examined in light of the fundamental role that genetic and environmental factors play in influencing brain structure and function (48). This is particularly true for autism where recent evidence have been reported linking gene polymorphisms to cortical enlargement (49) and grey matter overgrowth (50).
Findings from this preliminary study should be examined in light of several methodological limitations. First, lower functioning individuals and females were not included in this study which might limit the generalizability of its findings. Future investigations of this nature will have to address possible gender related differences in the development of cortical structures and associated severity of clinical features. Second, only two MRI scans were obtained from each participant and additional scans obtained over time would have provided additional data point to allow more accurate conclusions. Third, the exclusion of participants younger than 8 years of age is limiting since most brain development occurs prior to this age. Therefore, final interpretations from the present study should not be made before findings from studies of very young children are completed. Fourth, the morphometric program utilized generated global and lobar measures of volume and CT. The lack of topographic specificity limits the interpretations of the findings and warrant future studies applying more advanced programs to allow the examination of structural alterations at the gyral or sulcal level or on a voxel-by-voxel basis. Finally, adjustment of the p-value might be needed in light of the number of comparisons conducted.
In summary, this longitudinal MRI study is to our knowledge the first investigation to examine longitudinal changes in brain volume and CT in children with autism. Developmental structural changes were observed and relationships were found with clinical measurements. This investigation provides preliminary evidence of the age-related changes in grey matter volume and CT during the crucial peri-pubertal period of development in males with autism. However the neurobiologic underpinnings of these changes and the genetic control of these mechanisms remain to be elucidated. Future longitudinal studies applying multimodal imaging techniques while examining genetic influences by assessing gene polymorphisms are needed to evaluate developmental trajectories across the lifespan in this disorder.
Acknowledgments
The study was supported by NIMH research grant MH-64027 to Dr. Hardan. We would like to gratefully acknowledge the effort and commitment of the participants and their families in this study.
Footnotes
Financial Disclosures
Dr. Hardan has received grants from Bristol-Myers Squibb. He also reports that he has received honoraria for speaking fees from Forest, Pfizer, and AstraZeneca. The other authors reported no biomedical financial interests or potential conflicts of interest.
References
- 1.Courchesne E, Karns C, Davis HR, Ziccardi R, Carper R, Tigue Z, et al. Unusual brain growth patterns in early life in patients with autistic disorder: An MRI study. Neurology. 2001;57:245–254. doi: 10.1212/wnl.57.2.245. [DOI] [PubMed] [Google Scholar]
- 2.Hardan AY, Minshew NJ, Mallikarjuhn M, Keshavan MS. Brain volume in autism. J Child Neurol. 2001;16:421–424. doi: 10.1177/088307380101600607. [DOI] [PubMed] [Google Scholar]
- 3.Carper RA, Moses P, Tigue ZD, Courchesne E. Cerebral lobes in autism: early hyperplasia and abnormal age effects. Neuroimage. 2002;16:1038–1051. doi: 10.1006/nimg.2002.1099. [DOI] [PubMed] [Google Scholar]
- 4.Aylward EH, Minshew NJ, Field K, Sparks BF, Singh N. Effects of age on brain volume and head circumference in autism. Neurology. 2002;59:175–183. doi: 10.1212/wnl.59.2.175. [DOI] [PubMed] [Google Scholar]
- 5.Sparks BF, Friedman SD, Shaw DW, Aylward E, Echelard D, Artru AA, et al. Brain structural abnormalities in young children with autism spectrum disorder. Neurology. 2002;59:184–192. doi: 10.1212/wnl.59.2.184. [DOI] [PubMed] [Google Scholar]
- 6.Brambilla P, Hardan A, di Nemi SU, Perez J, Soares JC, Barale F. Brain anatomy and development in autism: review of structural MRI studies. Brain Res Bull. 2003;61:557–69. doi: 10.1016/j.brainresbull.2003.06.001. [DOI] [PubMed] [Google Scholar]
- 7.Hardan AY, Minshew NJ, Keshavan MS. Corpus callosum size in autism. Neurology. 2000;55:1033–1036. doi: 10.1212/wnl.55.7.1033. [DOI] [PubMed] [Google Scholar]
- 8.Just MA, Cherkassky VL, Keller TA, Minshew NJ. Cortical activation and synchronization during sentence comprehension in high-functioning autism: evidence of underconnectivity. Brain. 2004;127:1811–1821. doi: 10.1093/brain/awh199. [DOI] [PubMed] [Google Scholar]
- 9.Villalobos ME, Mizuno A, Dahl BC, Kemmotsu N, Müller RA. Reduced functional connectivity between V1 and inferior frontal cortex associated with visuomotor performance in autism. Neuroimage. 2005;25:916–925. doi: 10.1016/j.neuroimage.2004.12.022. [DOI] [PMC free article] [PubMed] [Google Scholar]
- 10.Kana RK, Keller TA, Minshew NJ, Just MA. Inhibitory control in high-functioning autism: decreased activation and underconnectivity in inhibition networks. Biol Psychiatry. 2007;62:198–206. doi: 10.1016/j.biopsych.2006.08.004. [DOI] [PMC free article] [PubMed] [Google Scholar]
- 11.Carper RA, Courchesne E. Localized enlargement of the frontal cortex in early autism. Biol Psychiatry. 2005;57:126–33. doi: 10.1016/j.biopsych.2004.11.005. [DOI] [PubMed] [Google Scholar]
- 12.Herbert MR, Ziegler DA, Makris N, Filipek PA, Kemper TL, Normandin JJ, et al. Localization of white matter volume increase in autism and developmental language disorder. Ann Neurol. 2004;55:530–40. doi: 10.1002/ana.20032. [DOI] [PubMed] [Google Scholar]
- 13.Barnea-Goraly N, Kwon H, Menon V, Eliez S, Lotspeich L, Reiss AL. White matter structure in autism: preliminary evidence from diffusion tensor imaging. Biol Psychiatry. 2004;55:323–326. doi: 10.1016/j.biopsych.2003.10.022. [DOI] [PubMed] [Google Scholar]
- 14.Alexander AL, Lee JE, Lazar M, Boudos R, DuBray MB, Oakes TR, et al. Diffusion tensor imaging of the corpus callosum in Autism. Neuroimage. 2007;34:61–73. doi: 10.1016/j.neuroimage.2006.08.032. [DOI] [PubMed] [Google Scholar]
- 15.Casanova MF, Buxhoeveden DP, Switala AE, Roy E. Minicolumnar pathology in autism. Neurology. 2002;58:428–32. doi: 10.1212/wnl.58.3.428. [DOI] [PubMed] [Google Scholar]
- 16.Bailey A, Luthert P, Dean A, Harding B, Janota I, Montgomery M, et al. Clinicopathological study of autism. Brain. 1998;121:889–905. doi: 10.1093/brain/121.5.889. [DOI] [PubMed] [Google Scholar]
- 17.Hardan AY, Muddasani S, Vemulapalli M, Keshavan MS, Minshew NJ. An MRI study of increased cortical thickness in autism. Am J Psychiatry. 2006;163:1290–1292. doi: 10.1176/appi.ajp.163.7.1290. [DOI] [PMC free article] [PubMed] [Google Scholar]
- 18.Hadjikhani N, Joseph RM, Snyder J, Tager-Flusberg H. Anatomical differences in the mirror neuron system and social cognition network in autism. Cereb Cortex. 2006;16:1276–1282. doi: 10.1093/cercor/bhj069. [DOI] [PubMed] [Google Scholar]
- 19.Hutsler JJ, Love T, Zhang H. Histological and magnetic resonance imaging assessment of cortical layering and thickness in autism spectrum disorders. Biol Psychiatry. 2007;61:449–457. doi: 10.1016/j.biopsych.2006.01.015. [DOI] [PubMed] [Google Scholar]
- 20.Lord C, Rutter M, Le Couteur A. Autism Diagnostic Interview-Revised: a revised version of a diagnostic interview for caregivers of individuals with possible pervasive developmental disorders. J Autism Dev Disord. 1994;24:659–685. doi: 10.1007/BF02172145. [DOI] [PubMed] [Google Scholar]
- 21.Lord C, Risi S, Lambrecht L, Cook EH, Jr, Leventhal BL, DiLavore PC, et al. The autism diagnostic observation schedule-generic: a standard measure of social and communication deficits associated with the spectrum of autism. J Autism Dev Disord. 2000;30:205–223. [PubMed] [Google Scholar]
- 22.Hollingshead AB. Unpublished manuscript. Yale University; New Haven, CT: 1975. Four-factor Index of Social Status. [Google Scholar]
- 23.Magnotta VA, Harris G, Andreasen NC, O’Leary DS, Yuh WT, Heckel D. Structural MR image processing using the BRAINS2 toolbox. Comput Med Imaging Graph. 2002;26:251–264. doi: 10.1016/s0895-6111(02)00011-3. [DOI] [PubMed] [Google Scholar]
- 24.Talairach J, Tournoux P. Co-planar Stereotaxic Atlas of the Human Brain. Thieme; New York: 1998. [Google Scholar]
- 25.White T, Andreasen NC, Nopoulos P, Magnotta V. Gyrification abnormalities in childhood- and adolescent-onset schizophrenia. Biol Psychiatry. 2003;54:418–426. doi: 10.1016/s0006-3223(03)00065-9. [DOI] [PubMed] [Google Scholar]
- 26.Magnotta VA, Heckel D, Andreasen NC, Cizadlo T, Corson PW, Ehrhardt JC, et al. Measurement of brain structures with artificial neural networks: two-and three-dimensional applications. Radiology. 1999;211:781–790. doi: 10.1148/radiology.211.3.r99ma07781. [DOI] [PubMed] [Google Scholar]
- 27.Benjamini Y, Hochberg T. Controlling the false discovery rate: a practical and powerful approach to multiple testing. J R Statist Soc. 1995;85:289–300. [Google Scholar]
- 28.Benjamini Y, Hochberg T. On the adaptive control of the false discovery rate in multiple testing with independent statistics. J Educ and Behav Statist. 2000;26:60–83. [Google Scholar]
- 29.Amaral DG, Schumann CM, Nordahl CW. Neuroanatomy of autism. Trends Neurosci. 2008;31:137–145. doi: 10.1016/j.tins.2007.12.005. [DOI] [PubMed] [Google Scholar]
- 30.Piven J, Nehme E, Simon J, Barta P, Pearlson G, Folstein SE. Magnetic resonance imaging in autism: measurement of the cerebellum, pons, and fourth ventricle. Biol Psychiatry. 1992;31:491–504. doi: 10.1016/0006-3223(92)90260-7. [DOI] [PubMed] [Google Scholar]
- 31.Piven J, Arndt S, Bailey J, Havercamp S, Andreasen NC, Palmer P. An MRI study of brain size in autism. Am J Psychiatry. 1995;152:1145–11492. doi: 10.1176/ajp.152.8.1145. [DOI] [PubMed] [Google Scholar]
- 32.Sowell ER, Thompson PM, Leonard CM, Welcome SE, Kan E, Toga AW. Longitudinal mapping of cortical thickness and brain growth in normal children. J Neurosci. 2004;24:8223–8231. doi: 10.1523/JNEUROSCI.1798-04.2004. [DOI] [PMC free article] [PubMed] [Google Scholar]
- 33.Kleinhans NM, Richards T, Sterling L, Stegbauer KC, Mahurin R, Johnson LC, et al. Abnormal functional connectivity in autism spectrum disorders during face processing. Brain. 2008;131:1000–1012. doi: 10.1093/brain/awm334. [DOI] [PubMed] [Google Scholar]
- 34.Dapretto M, Davies MS, Pfeifer JH, Scott AA, Sigman M, Bookheimer SY, et al. Understanding emotions in others: mirror neuron dysfunction in children with autism spectrum disorders. Nat Neurosci. 2006;9:28–30. doi: 10.1038/nn1611. [DOI] [PMC free article] [PubMed] [Google Scholar]
- 35.Zilbovicius M, Garreau B, Samson Y, Remy P, Barthélémy C, Syrota A, et al. Delayed maturation of the frontal cortex in childhood autism. Am J Psychiatry. 1995;152:248–252. doi: 10.1176/ajp.152.2.248. [DOI] [PubMed] [Google Scholar]
- 36.Rojas DC, Peterson E, Winterrowd E, Reite ML, Rogers SJ, Tregellas JR. Regional gray matter volumetric changes in autism associated with social and repetitive behavior symptoms. BMC Psychiatry. 2006;6:56. doi: 10.1186/1471-244X-6-56. [DOI] [PMC free article] [PubMed] [Google Scholar]
- 37.Shin YW, Yoo SY, Lee JK, Ha TH, Lee KJ, Lee JM, et al. Cortical thinning in obsessive compulsive disorder. Hum Brain Mapp. 2007;28:1128–1135. doi: 10.1002/hbm.20338. [DOI] [PMC free article] [PubMed] [Google Scholar]
- 38.Yoo SY, Roh MS, Choi JS, Kang DH, Ha TH, Lee JM, et al. Voxel-based morphometry study of gray matter abnormalities in obsessive-compulsive disorder. J Korean Med Sci. 2008;23:24–30. doi: 10.3346/jkms.2008.23.1.24. [DOI] [PMC free article] [PubMed] [Google Scholar]
- 39.Paus T, Collins DL, Evans AC, Leonard G, Pike B, Zijdenbos A. Maturation of white matter in the human brain: a review of magnetic resonance studies. Brain Res Bull. 2001;54:255–266. doi: 10.1016/s0361-9230(00)00434-2. [DOI] [PubMed] [Google Scholar]
- 40.Moessner R, Marshall CR, Sutcliffe JS, Skaug J, Pinto D, Vincent J, et al. Contribution of SHANK3 mutations to autism spectrum disorder. Am J Hum Genet. 2007;81:1289–1297. doi: 10.1086/522590. [DOI] [PMC free article] [PubMed] [Google Scholar]
- 41.Tsai SJ. Is autism caused by early hyperactivity of brain-derived neurotrophic factor? Med Hypotheses. 2005;65:79–82. doi: 10.1016/j.mehy.2005.01.034. [DOI] [PubMed] [Google Scholar]
- 42.Nelson KB, Grether JK, Croen LA, Dambrosia JM, Dickens BF, Jelliffe LL, et al. Neuropeptides and neurotrophins in neonatal blood of children with autism or mental retardation. Ann Neurol. 2001;49:597–606. [PubMed] [Google Scholar]
- 43.Miyazaki K, Narita N, Sakuta R, Miyahara T, Naruse H, Okado N, Narita M. Serum neurotrophin concentrations in autism and mental retardation: a pilot study. Brain Dev. 2004;26:292–295. doi: 10.1016/S0387-7604(03)00168-2. [DOI] [PubMed] [Google Scholar]
- 44.Hashimoto K, Iwata Y, Nakamura K, Tsujii M, Tsuchiya KJ, Sekine Y, et al. Reduced serum levels of brain-derived neurotrophic factor in adult male patients with autism. Prog Neuropsychopharmacol Biol Psychiatry. 2006;30:1529–1531. doi: 10.1016/j.pnpbp.2006.06.018. [DOI] [PubMed] [Google Scholar]
- 45.Katoh-Semba R, Wakako R, Komori T, Shigemi H, Miyazaki N, Ito H, et al. Age-related changes in BDNF protein levels in human serum: differences between autism cases and normal controls. Int J Dev Neurosci. 2007;25:367–372. doi: 10.1016/j.ijdevneu.2007.07.002. [DOI] [PubMed] [Google Scholar]
- 46.Chugani DC, Muzik O, Behen M, Rothermel R, Janisse JJ, Lee J, Chugani HT. Developmental changes in brain serotonin synthesis capacity in autistic and nonautistic children. Ann Neurol. 1999;45:287–295. doi: 10.1002/1531-8249(199903)45:3<287::aid-ana3>3.0.co;2-9. [DOI] [PubMed] [Google Scholar]
- 47.Altamura C, Dell’Acqua ML, Moessner R, Murphy DL, Lesch KP, Persico AM. Altered neocortical cell density and layer thickness in serotonin transporter knockout mice: a quantitation study. Cereb Cortex. 2007;17:1394–1401. doi: 10.1093/cercor/bhl051. [DOI] [PubMed] [Google Scholar]
- 48.Thompson PM, Cannon TD, Narr KL, van Erp T, Poutanen VP, Huttunen M, et al. Genetic influences on brain structure. Nat Neurosci. 2001;4:1253–1258. doi: 10.1038/nn758. [DOI] [PubMed] [Google Scholar]
- 49.Davis LK, Hazlett HC, Librant AL, Nopoulos P, Sheffield VC, Piven J, et al. Cortical enlargement in autism is associated with a functional VNTR in the monoamine oxidase A gene. Am J Med Genet B Neuropsychiatr Genet. 2008;147B:1145–1151. doi: 10.1002/ajmg.b.30738. [DOI] [PMC free article] [PubMed] [Google Scholar]
- 50.Wassink TH, Hazlett HC, Epping EA, Arndt S, Dager SR, Schellenberg GD, et al. Cerebral cortical gray matter overgrowth and functional variation of the serotonin transporter gene in autism. Arch Gen Psychiatry. 2007;64:709–717. doi: 10.1001/archpsyc.64.6.709. [DOI] [PubMed] [Google Scholar]