

Abstract
Physicians and insurers need to weigh the effectiveness of new drugs against existing therapeutics in routine care to make decisions about treatment and formularies. Because Food and Drug Administration (FDA) approval of most new drugs requires demonstrating efficacy and safety against placebo, there is limited interest by manufacturers in conducting such head-to-head trials. Comparative effectiveness research seeks to provide head-to-head comparisons of treatment outcomes in routine care. Health-care utilization databases record drug use and selected health outcomes for large populations in a timely way and reflect routine care, and therefore may be the preferred data source for comparative effectiveness research. Confounding caused by selective prescribing based on indication, severity, and prognosis threatens the validity of non-randomized database studies that often have limited details on clinical information. Several recent developments may bring the field closer to acceptable validity, including approaches that exploit the concepts of proxy variables using high-dimensional propensity scores, within-patient variation of drug exposure using crossover designs, and between-provider variation in prescribing preference using instrumental variable (IV) analyses.
POST-MARKETING COMPARATIVE EFFECTIVENESS RESEARCH
Lack of evidence on the effectiveness of drugs in routine care
Clinicians balance benefits and risks of medicines every day. They are taught that randomized controlled trials (RCTs) provide the most robust evidence, and so they go to work happily extrapolating evidence from RCTs to their own patient population, believing that their patients will benefit from an equally large effect. Cochrane1 pointed out some 35 years ago that RCTs on the efficacy of drugs for their regulatory approval study the extent to which an intervention does more good than harm under ideal circumstances (“Can it work?”). Effectiveness, however, assesses whether an intervention does more good than harm when provided under usual circumstances of health-care practice (“Does it work in practice?”).
Although there is no doubt about the scientific value of RCTs, their findings have often limited utility in daily practice: they may have sample sizes too small or drug doses too low to fully assess the safety of drugs; follow-up may be too short to show long-term benefits; they may under represent or exclude vulnerable patient groups, including elderly patients with multiple comorbidities, children, and young women, and operate in a highly controlled environment that is far from routine clinical practice. These issues are particularly relevant for preapproval trials. As drugs are on the market for a long time, more RCT evidence becomes available that increasingly includes vulnerable populations and different doses as manufacturers attempt to broaden the indication of their product.
Another limitation is that for drug approvals placebo-controlled trials are conducted that compare an active substance against no treatment.2 Notable exceptions are anti-microbials and later stage oncology drugs that are compared against active substances, or studies that add an investigational drug to usual care and compare against usual care alone, e.g., asthma care and HIV/AIDS treatments.3 For most conditions, physicians have a choice of two or more medications that can prevent, cure, avoid progression of, and reduce suffering from diseases. For physicians, it is therefore not a question of whether to prescribe a drug but which drug of several alternatives. In such situations, physicians need to understand their comparative effectiveness. It is possible to indirectly compare the efficacy of two active substances given two placebo-controlled trials, one on each of the two drugs. However, the composition of the respective placebo groups may differ between two trials, and the validity of such indirect comparison hence depends on accurate adjustment for patient characteristics. Therefore, indirect comparisons of drugs across multiple RCTs lose their advantage of rando mized treatment allocation and need to rely on epidemiologic methods. Other issues persist, including the restrictive inclusion criteria and short follow-up time. Such indirect comparisons may often produce unbiased results but not always.4,5 New methodologic developments in indirect comparisons of RCTs are promising.6,7
Few randomized effectiveness studies compare alternative treatment strategies in large heterogeneous populations, but they often have challenged clinical practice (Table 1a). Such head-to-head trials are mostly government-sponsored because individual manufacturers have no incentive to spend millions of dollars and risk that a direct comparison may reveal that the new drug is only about as effective as or possibly even less effective than an existing drug.
Table 1.
Examples of post-marketing comparative effectiveness studies
| Study | Primary study question | Clinical wisdom before study | Main conclusion of active comparator study |
|---|---|---|---|
| (a) Randomized controlled trials | |||
| ALLHAT84 | Effectiveness of ACE inhibitors, CCBs, and thiazides to control hypertension and reduce cardiovascular events |
Thiazides are inferior in first-line antihypertensive treatment |
Thiazides are as effective as ACE inhibitors and CCBs in lowering blood pressure and slightly more effective in preventing cardiovascular events |
| CATIE85 | Is there a difference in effectiveness of and adherence to atypical antipsychotic medications in elderly patients with dementia? |
Some atypical antipsychotics may have slight advantages over others |
Atypical APMs are equally ineffective and little tolerated in elderly patients with dementia |
| (b) Non-randomized epidemiologic studies | |||
| Pilote et al.86 | Are all ACE inhibitors equally effective in reducing mortality after MI in elderly patients (65+ years)? |
There is little difference among long-acting ACE inhibitors in reducing mortality after MI |
Ramipril was associated with lower mortality after MI than most other ACE inhibitors |
| Wang et al.87 | Have elderly patients (65+ years) using conventional antipsychotic medications a similar or even higher risk of death? |
FDA’s public health advisory warned only that atypical APMs, not conventionals, are associated with increased mortality |
Conventional APMs have at least the same risk of death if not higher |
| Schneeweisset al.34 | In elderly patients (65+ years), what are the comparative gastroprotective benefits and CV risks of selective COX-2 inhibitors versus ns-NSAIDs? |
In elderly patients, there is insufficient RCT data to allow differentiation of CV risk between non-naproxen NSAIDs88 and coxibs have fewer gastric side effects |
Considering typical use of NSAIDs in elderly patients, there is no meaningful reduction in upper GI bleeds by coxibs, but diclofenac may have as high a risk of MI as rofecoxib |
ACE, angiotensin-converting enzyme; APM, antipsychotic medications; CCB, calcium channel blocker; COX-2, cyclooxygenase-2; CV, cardiovascular; FDA, Food and Drug Administration; GI, gastrointestinal; MI, myocardial infarction; ns-NSAID, non selective non-steroidal antinflammatory drug; NSAID, non-steroidal anti-inflammatory drug; RCT, randomized controlled trial.
In the absence of enough head-to-head effectiveness trials, comparative effectiveness research tries to solve the issue of limited generalizability to routine care and the lack of an active comparison group by studying post-marketing drug use data, often from large health-care utilization databases, and associate such use with relevant health outcomes. Two examples of recent non-randomized comparative effectiveness studies are provided in Table 1b. Although such pharmacoepidemiologic studies based on large databases have the advantage of being representative of routine care and can be conducted in a timely manner, they suffer from several methodological issues discussed below.8
Recurrent interest in comparative effectiveness research
Physicians were always most interested in head-to-head comparisons of drugs, so that they can prescribe the best possible treatment for their patients.9 Commercial health plans that are interested in the health of their beneficiaries as well as their own financial bottom line would want such information to structure formularies and provide financial incentives to guide patients to equally effective but less costly medications.10
With the initiation of Medicare Part D drug coverage for all older adults, the US Government has now a much larger stake in finding the best evidence on the comparative effectiveness of therapeutics. The value of comparative effectiveness was recognized in Section 1013 of the Medicare Prescription Drug, Improvement, and Modernization Act (MMA) of 2003, which authorized the Agency for Healthcare Research and Quality (AHRQ) to conduct and support syntheses and research on topics of highest priority to governmentfunded health plans, including Medicare. Consequently, AHRQ has recently initiated the Effective Health Care program funded mainly by the Centers for Medicare and Medicaid Services (CMS) but also by the Food and Drug Administration (FDA) and National Institutes of Health (NIH).11
Comparative effectiveness information can be seen as globally applicable knowledge. It is therefore only sensible that there is growing international collaboration in generating such information, appraising studies on comparative effectiveness in systematic reviews, and freely sharing this information on the Internet.
The need for post-marketing research on the comparative (head-to-head) effectiveness of drugs
Effectiveness research assesses whether an intervention does more good than harm when provided under conditions of routine care
Many randomized efficacy trials exclude patient populations that will use most of the drugs, including older adults and patients with multiple morbidities
Efficacy data comparing a drug with placebo are rarely relevant in routine practice where one or more alternative therapies are available for most conditions
NON-RANDOMIZED POST-MARKETING COMPARATIVE EFFECTIVENESS RESEARCH
Timely and representative information through health-care utilization databases
Ideally, comparative effectiveness information would be made available at the point of marketing of a newly approved drug or soon afterwards in order to be most helpful to health-care providers and insurers. Once a drug is marketed, health insurance companies are the largest producers of information on the utilization of such drugs as a byproduct of paying for electronically submitted pharmacy claims. Such claims can be electronically linked via patient identifiers to claims from physician services and hospitalizations, as well as information from vital statistics agencies and disease registries. Typical examples of such administrative databases are claims data of large health insurance companies like United Health, of Health Maintenance Organizations like Kaiser Permanente, or of government-funded health-care programs like Medicaid.12 These databases contain records of medical service encounters and pharmacy dispensings for many millions of beneficiaries over long periods of time. Each encounter is recorded with one or multiple coded diagnoses and dates when each service was provided. The latter permits researchers to establish a clear chronology of pharmacy dispensings and medical services. In 2006, the US Medicare system has become the largest payer for prescription drugs, and linking medication dispensing information with medical records will open another research data source. By combining several large data sources,13 study populations of 100 million may soon become available.14
Such longitudinal health-care utilization databases have three key advantages for performing post-marketing comparative effectiveness research:8 (1) they are available at relatively low cost and can often be conducted with little delay, although even the fastest studies will usually take a year or longer, particularly if medical records will be accessed and reviewed to validate end points; (2) their representativeness of routine clinical care makes it possible to study real-world effectiveness; and (3) the large size of covered population will shorten the time necessary to identify a sufficient number of users of a newly marketed drug.15
One advantage of health-care utilization databases–their representativeness of routine clinical practice in large populations–comes at a price: the reliance on previously collected data generated primarily for administrative purposes. In studies that use primary data collection, the timing of data collection and the detail and accuracy of data are to a large extent under the control of the investigator. By contrast, in administrative databases a record is generated only if there is an encounter with the health-care system that is accompanied by a diagnosis (old or new) and one or several procedures, including the prescribing of drugs. A third hurdle to generating an electronic record is that the encounter must actually be filed and coded accurately in a computer system. To generate a complete insurance file, a third-party payer must adjudicate the claim before it will be stored in the final database. Understanding how individual databases were generated is crucial to making best use of the data and avoids overreliance on individual data items.16
Patient’s non-response bias and recall bias are non-existent in the conventional form in claims data, as all data were recorded prospectively and independent of patients’ recall or agreement to participate in a research study. However, the administrative system may fail to record complete information randomly or systematically, including diagnostic in formation. The resulting misclassification may lead to underascertainment of outcomes and limited assessment of patient risk factors of the study outcome, which may lead to residual confounding–one of the main challenges in post marketing comparative effectiveness research.
Why randomized studies may provide different results from non-randomized comparative effectiveness studies
Confounding by the indication of therapy
Physicians prescribe drugs in light of diagnostic and prognostic information available at the time of prescribing. The factors influencing their decisions vary by physician and over time17 and involve a mix of clinical, functional, and behavioral patient characteristics. If these factors are also independent predictors of the study outcome, then failing to control for such factors can lead to confounding bias. The confounding thus results from an informed selection or channeling of patients into drug exposure groups based on indications and contraindications18 and is therefore widely referred to as confounding by indication.19 Such channeling also occurs if institutional guidelines or reimbursement restriction require specific step-up therapies, depending on disease severity or prefer one drug over another to standardize care or reduce spending.
A typical example is the prescribing of non-steroidal anti inflammatory drugs (NSAIDs) for pain and their effect on gastrointestinal (GI) hemorrhage. Non-selective NSAIDs are known for their potential to cause gastric and duodenal ulcers, erosive gastritis, and GI hemorrhage. Physicians will more likely prescribe cyclooxygenase-2 (COX-2)-selective NSAIDs to patients with a history of GI irritation or hemorrhage,20 a subgroub of NSAIDs that has demonstrated reduced gastric side effects in short-term RCTs.21–23 Because these patients are at higher risk to develop a GI hemorrhage independent of drug use, this practice may lead to an apparent association between selective COX-2 inhibitor use and GI bleed in epidemiologic studies.24 A related example of confounding bias when studying the intended effect of drugs using observational data is a study on the efficacy of gastroprotective drugs among NSAID users, which found an apparent 10-fold increase in risk of gastric bleeding or perforation in users of gastroprotective drugs among NSAID users that is most likely due to confounding.25
Causal graphs (Figure 1a) are helpful to illustrate confounding.26 A factor can be a confounder (C) only if that factor is associated with drug treatment and is also an independent risk factor for the study outcome. Factors that are not independent predictors of the study outcome cannot be confounders even if they are imbalanced among drug exposure groups. Likewise, if a risk factor is not associated with the drug exposure, for example, through random assignment of drug exposure, then this factor will not be a confounder.27
Figure 1.

Causal diagrams demonstrating the mechanics of confounding and three approaches to reduce confounding by unmeasured factors.
Ideally, we would be able to fully assess the history of GI irritation and stratify patients of similar baseline risk of GI hemorrhage. Comparing users of selective versus non selective NSAIDs within these strata would then find a reduced risk of GI hemorrhage in users of selective COX-2 inhibitors similar to randomized trials.20,28
However, physicians often prescribe selective COX-2 inhibitors considering subtle risk factors for GI hemorrhage that are not recorded and are therefore unmeasured confounders (“U” in Figure 1b). Most non-randomized studies using claims data with limited patient information comparing selective with non-selective NSAIDs will not be able to fully measure and adjust such confounders as smoking, alcohol use, body mass index, use of over-the-counter aspirin or gastroprotective agents, and will therefore be unable to show a gastroprotective effect of COX-2 inhibitors because of residual confounding. This difficulty of fully adjusting all possible confounders can be generalized to most studies of intended treatment effects (Figure 2). Conversely, because prescribing of COX-2 inhibitors was initially not influenced by considerations of the patients’ risk for myocardial infarction (MI), such unintended effects are much less likely to be confounded.27
Figure 2.
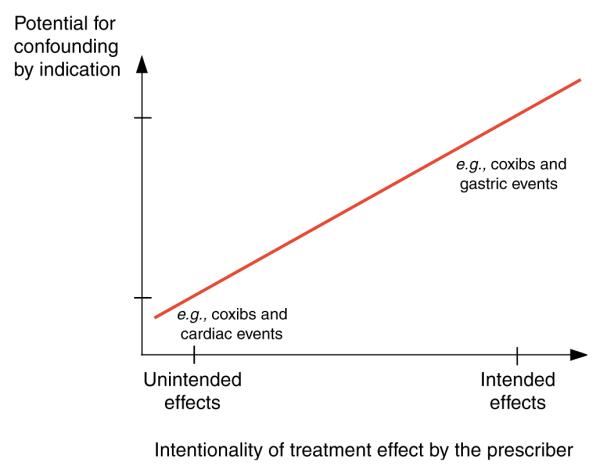
Intended and unintended treatment effects and the potential for confounding by indication.
The issue of confounding by indication is further complicated when studying newly approved drugs that will be heavily marketed to quickly gain market shares competing with already existing therapeutics. Often they are marketed for being more effective in treating the labeled condition or reducing the risk of frequent safety concerns. Independent of the legitimacy of those claims, many physicians will consider prescribing these newer drugs to sicker patients and patients at higher risk for adverse effects. Studies not fully adjusting for these considerations may underestimate the benefits of newly marketed drugs and overestimate their risks.
Other factors that may lead to differences in results from RCTs
In addition to differences caused by the fundamentally different approaches to handling confounding, non randomized comparative effectiveness research may produce different results because the study populations and treatment regimens are less selective and more generalizable. Assuming a difference between observational studies and RCTs would not be due to bias, any such difference will highlight the modifications of treatment effects in routine care circum stances. Outcome assessment may be more complete in RCTs, particularly for fatal events that do not reach the hospital.29 For those cases, it is difficult to attribute specific causes of death in most database studies, e.g., fatal out-of-hospital MI that does not generate a hospital claim.
UNDERSTANDING UTILIZATION PATTERNS IN ROUTINE CARE WILL GUIDE THE CHOICE AMONG NON-RANDOMIZED STUDY DESIGNS
The causal effect of a drug would ideally be assessed by administering the drug to a person and comparing this person’s experience with the counterfactual experience of what would have happened to the same person at the same time had the drug not been taken.30 As such an experiment is not practical, research seeks to mimic a causal experiment as closely as possible. There are three fundamental ways to vary exposure status, and all the three types can be imagined in an experimental setting, e.g., RCTs, or in a non-randomized setting, e.g., epidemiologic studies (Figure 3):
Instead of varying exposure status within the same person at the same time, it is possible to examine the outcomes of varying drug exposure status in the same person but over time. This way a patient becomes his/ her own control, and all non-time-varying patient characteristics are kept constant by design. This is the basis for randomized crossover trials or non-randomized case-crossover studies.
Instead of varying exposure within patients, exposure may vary between patients. One group of patients will be exposed to a new drug and another group to a comparison drug. Under the assumption that patients in both groups are on average comparable with regard to their patient characteristics, this method will mimic a causal experiment. This is the basic consideration for the frequently used two-group randomized trial design or epidemiologic cohort studies.
Instead of varying exposure between patients, exposure may vary between providers or larger patient groups. Some physicians prescribe one drug over another independent of patient characteristics, because of either randomization or treatment preference. This is the basis for cluster randomized trials or IV analyses of cohort studies.
Figure 3.
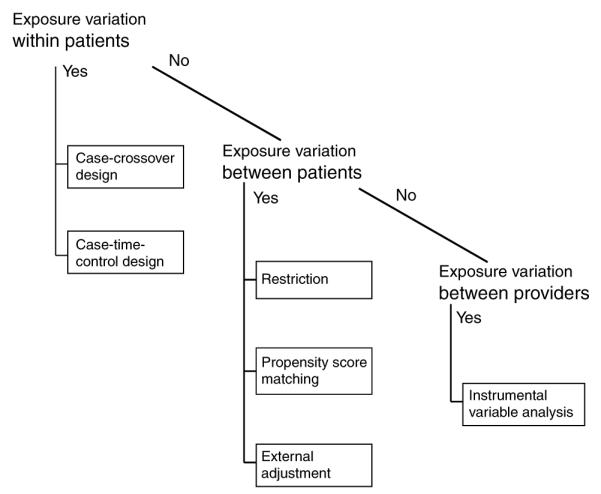
Drug utilization patterns guide the choice of non-randomized study designs.
Although this framework provides a logical ordering that is derived from extending a causal experiment, it is not necessarily the order that epidemiologists would consider for a specific study question.
The structure of health-care utilization databases allows extraction of information on all three levels of drug exposure variation with little effort. They provide longitudinal strings of information on the use of health service, including drug dispensings. Because each service is tied to reimbursement, the recorded time of service and dispensing are among the few highly reliable items in such databases. With the dispensing date and supply information, a drug exposure calendar can be established, and variation of drug exposure within a patient over time can be studied.
In cohort studies, it is critical to first understand the prescribing of drugs by tabulating measured patient characteristics by drug exposure group, which will allow the investigator to identify imbalances of some patient characteristics. In large randomized trials, such tables will show almost perfect balance of patient characteristics between randomly assigned treatment groups. In a cohort study, there are often substantial differences in the prevalence of measured patient factors between drug exposure groups that may lead to confounding, if these factors are also independent risk factors for the study outcome. Such factors need to be adjusted in further analyses. Instead of considering each factor individually, it is possible to combine all patient characteristics into a single propensity score (PS), which is the estimated probability of treatment, given all covariates. The distribution of the PSs for treated and untreated patients (Figure 4) can be plotted, and the degree of non-overlap of the two distributions is a measure of the multivariate imbalance of the two treatment groups (see more discussion of PSs below). In rare circumstances, the two PS distributions may be fully overlapping, which indicates that in the observed setting there is a perception of clinical equipoise of the two drugs, and physicians will quasi-randomly choose one. Consequently, all measured patient risk factors may be balanced. Examples of such situations include celecoxib vs rofecoxib in their early marketing phase.31,32
Figure 4.
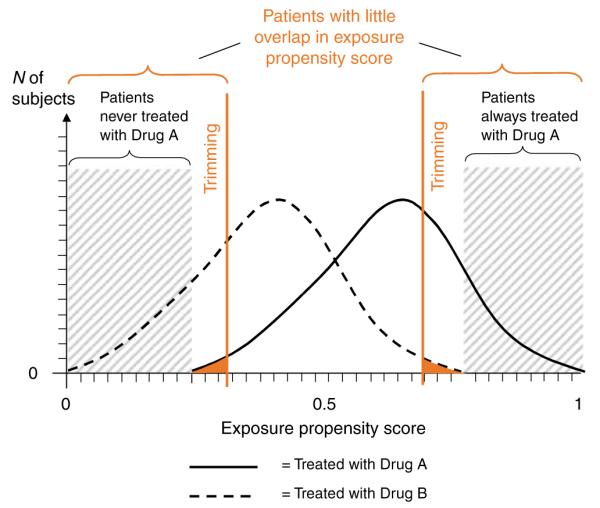
Regions of non-overlap of the exposure PS distributions of two treatment groups. In this example, study patients were restricted to those with largely overlapping exposure PSs by trimming patients with extreme PS values.
Utilization databases are also well suited to understand the properties and predictors of physicians’ prescribing decisions. Doctors’ ID numbers and limited physician characteristics can be linked to their patients, making it possible to identify provider subgroups that are more likely to prescribe one drug over another; if such a prescribing preference is largely independent of patient characteristics, it can be used as a substitute for exposure in an IV analysis.33,34
BASIC STRATEGIES TO REDUCE CONFOUNDING BIAS
The basic research design in epidemiology is the cohort study. Patients are identified and included in the study cohort by their drug use, their characteristics are measured when they become eligible for the cohort (baseline), and any subsequent study outcomes are recorded until patients are censored because of death, end of the study period, or disenrollment. Most other study designs, including case–- control studies and case–cohort studies, are efficient sampling strategies of cohort studies and will not be discussed here.
Because patients in different drug-user groups often have different distributions of health status that may predict treatment outcome, simply comparing the rate of outcomes in user group 1 with user group 2 is likely to be confounded. With regard to observed patient characteristics, two fundamental strategies, restriction and stratification, can make patient groups more comparable and therefore comparisons less biased.
Restriction
The basic idea of restricting a study cohort is to make its population more homogeneous regarding measured patient factors. A study may want to restrict its population to the oldest old and thus minimize the influence of age. Restriction will by definition reduce the cohort size, but population based health-care utilization databases are of such massive size that some restriction to improve the validity of findings will usually not impair precision meaningfully. A set of three restrictions are generally worth considering in comparative effectiveness research (Figure 5).35
Figure 5.

Restrictions to study populations typically applied in comparative effectiveness research. Modified after Schneeweiss et al.35
Restrict to new users
The basic cohort design identifies all patients in a defined population who were treated with the study medication at least once during a defined study period. Start of exposed person’s time begins at the first recorded dispensing of the study drug in the study period. Such a cohort will consist of prevalent (ongoing) and incident (new) drug users; depending on the average duration (chronicity) of use, such cohorts may be composed predominantly of prevalent users and few new users. The estimated average treatment effect will therefore underemphasize effects related to drug initiation and will overemphasize the effects of long term use.36 Further, prevalent users of a drug have by definition persisted in their drug use, which may correlate with higher educational status and health-seeking behavior, particularly if the study drug is treating a non-symptomatic condition, e.g., statin treatment of hyperlipidemia or hormone replacement therapy.37,38
A restriction to new initiators of the study drugs (inception cohort) will mitigate those issues and will also ensure that patient characteristics are assessed before the start of the study drug and can therefore not be the consequence of the drug, similar to the principle of RCTs. Such inception cohorts can be efficiently identified in existing administrative databases by requiring a defined time period without any use of the study drug before its first observed use. The advantage of the so-called “New User Design” has been summarized.36
Restrict to patients without contraindications
One advantage of non-randomized epidemiologic studies is that they involve populations not often included in RCTs. In a study of the effectiveness of a drug, however, it is questionable whether we want to include patients who have a clear contraindication to that drug. Including such patients in studies on medication effectiveness will not provide information for the statistical analysis because none of these patients will be treated with the index drug. Even if some patients receive the study medication despite a contraindication, they will be few and their experience will be unusual. Prudence dictates, therefore, excluding patients with contraindications or absolute indications, resulting in a situation similar to the therapeutic equipoise required for RCTs.39 In practice, however, determining contraindications using diagnostic codes recorded in health-care utilization databases may be difficult, if not impossible, and identifying them empirically using PSs may be more promising. PSs estimate each patient’s probability of treatment given all measured covariates and follow a distribution between 0 and 1 that may differ between drug-user groups (Figure 4). The low end of a PS distribution indicates a low propensity for receiving treatment. There will be a range that is only populated by actual non-users because all users have a higher propensity for treatment. Such non-users are likely to have a contra indication for the study medication because no subject with such a low propensity has actually received treatment. These patients should be deleted from the study population. Analogously, such trimming can be considered at the upper end of the PS, excluding patients who will always be treated.
Restrict to adherent patients
Patients dropping out of RCTs for reasons related to the study drug may cause bias. Non-informative discontinuation causes bias toward the null in intention-to-treat analyses. The medical profession and regulatory agencies accept such bias because its direction is known and trial results are considered conservative regarding the drug’s efficacy. Discontinuation of treatment may also be associated with study outcomes through lack of perceived treatment effect and drug intolerance.
RCTs try to minimize bias from non-adherence by frequently reminding patients and by run-in phases before randomization to identify and exclude non-adherent patients. In routine care, adherence to drugs is substantially lower than in RCTs. Studies have shown that for statin medications only 50–60% of elderly patients refill their prescriptions after 6 months.40
Starting follow-up after the second or third refill of the study drug in new user cohorts will exclude patients who are least adherent. Unlike RCTs in which run-in phases often employ placebo,41 patients in routine care experience their first exposure to a new drug and may discontinue use shortly thereafter because of intolerance during what may be the most vulnerable period for some medication–outcome relations. Such a restriction may therefore be more valuable when studying effectiveness that manifests with some delay rather than rapid-onset safety outcomes.
Loss of generalizability after restriction?
As mentioned above, it is a distinct advantage of non-randomized database studies that they will not have stringent restriction criteria and are representative of routine clinical care. Will the price of the proposed restrictions be limited generalizability?
To guide our thinking about generalizability, it is useful to specify the patient to whom we wish to generalize our results. From a patient and physician perspective, the most relevant and frequently asked question is “What is the effectiveness and safety of a particular drug that I am about to start compared with starting an alternative drug, assuming it would be used as directed?” To answer this question, restricting studies to initiators of drug therapy does not limit generalizability. Instead, such a restriction avoids underrepresentation of treatment effects that occur shortly after initiation. Patients with known contraindications usually do not have to confront the question raised above because prescribing the drug contravenes current medical knowledge. Therefore, excluding patients with contraindications will not place relevant limits on generalizability. To make a prescribing decision, physicians must assume that patients will take a drug as directed. If clinicians knew beforehand that a patient would not take a prescribed medication, they would not ponder the appropriateness of the drug in the first place. Consequently, restricting the study population to patients who are most likely to adhere to their treatment choice—independent of intolerance or treatment failure—will not limit generalizability defined by the question above.
Stratification and regression modeling
Stratification, similar to restriction, identifies patient sub groups based on measured patient factors.42> In contrast to restriction, stratification does not discard the “unwanted” population but provides treatment effect estimates for all strata and combines them into one weighted summary effect measure. In the absence of effect measure modification, e.g., the treatment effects are the same in old and young patients, and under the assumption that all confounding factors were measured, stratified analyses will provide unbiased treatment effects. The large size of health-care utilization databases may permit many such subgroup analyses with substantial numbers of subjects and is an attractive alternative to wholesale restriction.
Regression analyses use mathematical modeling to make stratified analyses more efficient by assuming that parametric statistical distributions fit the data. Ideally, one would apply a combination of restriction and stratification as illustrated in Figure 5. However, one will still worry about the effects of unmeasured patient characteristics.
NON-RANDOMIZED COMPARATIVE EFFECTIVENESS RESEARCH WHEN CONFOUNDERS REMAIN UNMEASURED
Even if detailed diagnostic information were available in clinical registries or electronic medical records, there might still be other unrecorded physician considerations about a patient’s prognosis that would direct physicians to prescribe one drug over another. Drug utilization analyses may prompt investigators to use one of the following basic design options to minimize residual confounding by unmeasured risk factors (Table 2).
Table 2.
Approaches to reducing residual confounding by unmeasured factors
| Crossover studies (e.g., case-crossover design) |
External adjustment (e.g., survey information with clinical details in a subsample) |
Proxy measures (e.g., high-dimensional propensity scores) |
IV methods (e.g., two-stage regression) |
|
|---|---|---|---|---|
| Approach | Different time periods within the same patient serve as control time periods |
Additional information on clinical risk factors will be collected on a subsample of patients and used to adjust finding in main study |
Many measured covariates and their interactions adjusted by propensity score methods may be proxies for unmeasured confounders |
A correlate of the study exposure not related to measured and unmeasured confounders serves as an un-confounded substitute for the drug exposure |
| Advantage of approach | Adjusts all measured and unmeasured time-invariant confounders, including genetic predispositions |
The study investigator will define the detail an quantity of additional clinical information that will be gathered in a subsample |
Well-established propensity score methods can be applied to improve efficiency when adjusting hundreds of covariates |
Provides consistent effect estimates even in the presence of unmeasured confounders |
| Assumptions that need to be made |
No within-person confounding over time. Case–time control studies can help reduce within- person confounding if time trends in controls are representative of time trends in cases |
All relevant confounders must be defined; subsample must be representative |
A high-dimensional matrix of measured covariates also represents unmeasured confounders |
No association between instrument and confounders; no direct effect of the instrument on the study outcome other than through the actual drug exposure |
| Testability of assumptions | Time trends of measured confounders can be examined and extrapolated to unmeasured confounders |
Completeness of the list of confounders observed in the subsample must be argued; representativeness can be tested |
The degree of representation of unmeasured confounders is not knowable from the data. Effect measure modification by propensity score may suggest residual confounding |
Validity of assumptions must be argued. Improvement in the balance of measured covariates between treatment groups can be demonstrated and extrapolated to unmeasured confounders |
IV, instrumental variable.
Utilizing variation in drug exposure within patients: crossover designs
The underlying idea of crossover study designs is that case patients can serve as their own controls. Relevant examples are the case-crossover design43 and prescription symmetry analysis.44 The case-crossover design uses a case as his or her own control by considering person-time before the case-defining event as control person-time. The design controls unmeasured between-person confounding by comparing the effects of exposed person-time vs unexposed person-time in the same patients so that all time-invariant factors are adjusted, including such difficult-to-measure factors as genetic polymorphisms, lifestyle, and socioeconomic factors. Several applications of case-crossover studies in administrative data demonstrate its utility in controlling unmeasured confounding. In a study of selective serotonin reuptake inhibitors and the risk of hip fracture, the relative risk estimate decreased from 6.3 in a case–control design to 2.0 in a case-crossover design;45 such a reduction in effect size is expected, because the crossover design better controls for confounding by patient frailty.46 The design works best when drug exposure varies with time and the outcome has an acute onset.
The weak point of crossover design is the potential for within-person confounding over time if there is an increase or decrease in exposure utilization that depends on the patient’s health status.47 For example, early symptoms of an event may lead to an increase in use of the study drug during the time preceding the actual event. This is less likely for sudden-onset events, but it can pose a real problem in studying insidious outcomes.48 A limited assessment and correction of this bias are possible by including time-trend controls;49,50 alternatively comparator drugs known to be unrelated to the outcome can be used to calibrate case-crossover designs.48
Utilizing proxies: the pivotal role of propensity scores (PSs) Proxies
Health-care utilization databases contain not only a large number of subjects but also a large battery of measures of potential confounders. In studies using primary data collection, each confounding factor is usually assessed by one predefined measure. In administrative data, however, there are often dozens of measures for each construct of a confounding factor such as comorbidity. The stream of longitudinal data depicts the sociology of health-care provision and its recording, and often several levels of proxies are involved. For example, the health state of a patient can be assessed through the dispensing of a drug that was prescribed by a physician who made a diagnosis in a patient who entered his or her practice and complained about symptoms. This chain of proxies is influenced by issues of access to care, severity of the condition, diagnostic ability of the physician, his or her preference for one drug over another,17 the patient’s ability to pay the medication copayment,51 and the accurate recording of the dispensed medication. In this scenario, the chain of proxies leads to a reasonable interpretation that the patient indeed had a condition that was severe enough to be treated by a physician and troubled the patient enough to see the physician in the first place and eventually pay a co-payment for the medication. Buying the drug is a proxy for taking the drug, which is a proxy for the active substance’s reaching the blood stream, which again is a proxy for its binding on the target receptor and biological action.
Obviously, such interpretations are not always possible. In fact, in most cases we do not need a specific interpretation, but it is sufficient to know that on average an increasing number of medications used by a patient is just as predictive for worsening health as more complex scores and algorithms.52 A number of proxies can then collectively, partially, or fully represent the effect of confounding factors that remain unmeasured. The degree to which proxies achieve this goal depends on the strength of the multivariate association between measured and unmeasured confounders (Figure 1b) and remains untestable.53
In administrative databases, the number of proxies describing the cross-sectional and longitudinal health status can quickly rise to several hundreds, making it difficult to fit multivariate regression models for a limited number of observed outcomes even in large studies.54 PSs have become increasingly popular to efficiently adjust large numbers of proxies in database studies.55
PSs as balancing tools
An exposure PS is the probability (propensity) of exposure given measured covariates;56,57 it can be estimated using a multivariable logistic regression model of exposure. Each patient is assigned an estimated probability of exposure ranging from 0 to 1 that reflects the likelihood (rather than the known fact) of being prescribed a given drug, given all measured characteristics. Individuals with the same estimated PS will have on average the same chance of receiving that treatment, although they may have very different covariate constellations. Within each PS stratum, some patients will have received the treatment of interest, whereas others will not, which allows estimating a treatment effect adjusted for all factors used to estimate the PS. PS can be utilized by matching on the PS, performing stratified analyses, and any combinations of these methods with “traditional” multivariable outcome modeling.55,58
It is a major advantage of PS over conventional multivariable modeling that many more covariates, i.e., potential proxies, can be modeled simultaneously without the risk of overfitting, if there were fewer than 10 outcomes per variable in a traditional outcome model.54,59
PSs as diagnostic tools
Plotting and comparing the distribution of PS for exposed and unexposed subjects can be instructive and should be a standard procedure in database analyses (Figure 4). Regions of non-overlap of these two distributions on the extreme ends identify (a) patients who have a very low probability of treatment and are not treated, possibly because of an important contraindication; and (b) patients expected to always receive treatment on the basis of their covariate vector. In these patients, there is no equipoise of medical practice, and it is therefore questionable whether they should be included in an analysis at all. If they are, one should keep in mind the implicit distributional assumptions that regression models make to extrapolate data into a parameter space that is not supported by adequate data.60 It is argued that trimming larger regions of little or no overlap (Figure 4) will make comparison groups even more similar.61
An important diagnostic analysis is to check whether there is meaningful effect measure modification by the PS, particularly by the extreme values of the PS. Kurth et al.62 showed that patients with stroke and a very low estimated propensity for receiving tissue plasminogen activation (tPA) treatment but who nevertheless receive the treatment were much more likely to die. The reason for that can be twofold: (1) there is unusual physician prescribing of tPA to stroke patients who are likely to die, possibly as a desperate treatment attempt; or (2) some patient severity markers were not recorded accurately, causing residual confounding. As it is impossible to determine which is the case, it seems reasonable to exclude (trim) such patients from the main analysis and examine the few outlier patients separately. Matching by PS will also reduce such complications.
Utilizing additional clinical information in patient subsamples
External adjustment
If additional information is available, for example, in the form of a detailed survey of a representative sample of patients from the main database study, such additional data can be used to correct for confounding factors that are unmeasured in the main study.63 If internal validation studies are not feasible or too costly, external data sources may be used under certain assumptions. The external survey data will be used to assess the imbalance of confounders between drug exposure groups that are unmeasured in the main database study (Figure 1c). As survey data are not useful for estimating the independent effect of confounders on the study outcome, researchers may extract the independent effects of the individual confounders from the literature. This method is easy to apply using spreadsheet programs but does not work with categorical confounder variables (smoking categories) or continuous confounder (body mass index) and does not consider the joint effect of multiple confounders that may add up or cancel each other out.31 Data from the Medicare Current Beneficiary Survey showed that users of zolpidem were more likely to have limitations in physical and cognitive functioning as well as in performing activities of daily living compared with older sedative-hypnotics.64 Combining this knowledge with the literature-reported associations of these covariates with the risk of hip fracture lead to the conclusion that database analyses not adjusting for these factors would overestimate the risk for hip fracture in zolpidem users by up to 40%. This approach was recently extended by Stürmer et al.65 to a multivariate adjustment for unmeasured confounders using a new technique of propensity score calibration, which can be applied when external information is available that does not contain outcome information. Propensity score calibration implicitly takes into account the joint effect of several unmeasured confounders as well as the relation between measured and unmeasured confounders. However, propensity score calibration may not perform well in some uncommon situations.66
Two-stage sampling
The binary external adjustment technique as well as the propensity score calibration work with suitable external data sources. Two-stage sampling designs rely on an internal validation study to collect information on covariates that were not measured in the main study. In stage 1, information is collected on drug exposure and disease outcomes for the entire cohort (the main database study).67 In stage 2, a subgroup of the main study is sampled and contacted, and detailed information is derived. Regression coefficients and standard errors are then weighted according to the specific sampling fraction.68–70 The balanced design, wherein an equal number of individuals is selected from each drug exposure/disease category, is usually the most efficient strategy by which to select the stage 2 sample.67 A simulation study based on claims data and an internal validation study showed that a validation study of about 15–20% could reach standard error estimates that were only about 25% larger than those of the main study alone, but the two stage sampling algorithm can control for more potential confounders.67
Utilizing variation in drug preference between providers: IV methods
IV estimation
To overcome this inability to control for residual confounding by unobserved factors, an analytic approach, known in economics as IV estimation,71 can provide unbiased estimates of causal effects in non randomized studies72 by mimicking random assignment of patients into groups of different likelihood for treatment.73 An IV is a factor that is related to treatment, but unrelated to observed and unobserved patient risk factors and also unrelated to the outcome (Figure 1d), other than through its relationship to treatment—both key assumptions for valid IV estimation. In the analysis, the unconfounded instrument substitutes the actual treatment status that may be confounded. The instrument effect on the study outcome will be estimated and then rescaled by its correlation with the actual exposure. The more strongly an IV is related to the actual treatment, the less any residual confounding will be weighted and precision of the IV estimation will improve.74
IV estimation had not been used for the evaluation of medicine until Brookhart et al.75 introduced physician prescribing preference as a promising instrument for comparative effectiveness research. The basic idea is that there is a distribution of physician’s preference for one drug over another (Figure 6) that is largely independent of patient characteristics. One way to define a physician-prescribing preference instrument is to categorize physicians into strong preferers of drug A if they prescribed it in 90% or more of their patients, whereas non-preferring doctors prescribe it in only 10% or less of cases (see red lines in Figure 6). A variety of implementations of physician-prescribing preference is possible, including the choice of drug that a physician used for the most recent patient.34,75 In our study on the comparative effectiveness of selective COX-2 inhibitors relative to non-selective NSAIDs, we used the last new NSAID prescription written by a physician to determine the IV status of the next patient. If the last patient received celecoxib, then for the next patient the physician is classified as a “celecoxib prescriber.”34 This approach takes into account that NSAID-prescribing preference may change within the study period. The analysis is conducted with two-stage regression models and adjustment of standard errors for the fact that patients cluster in physicians’ clinics.76
Figure 6.
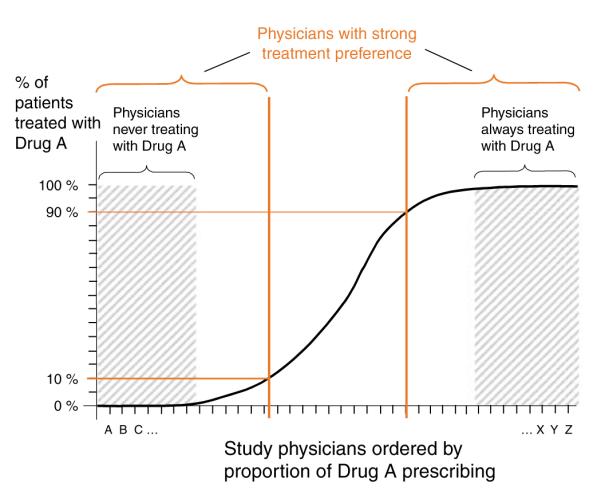
Physician-prescribing preference. In this example, physicians treating study patients were separated into those who have either a strong preference to prescribe drug A (on the right side) or a strong preference not to prescribe drug A.
As with other statistical approaches, the validity of IV estimation relies on assumptions. First, the instrument must be related to the actual exposure, which can be demonstrated empirically. Second, an instrument must not be correlated with patient risk factors, which can be empirically demon strated only for measured patient characteristics. However, if substantially more balance can be achieved via the instrument, it is hoped that unmeasured risk factors were equally well balanced. Yet, some of what appears to be physician’s preference for a specific NSAID may actually be a clustering of patients with high risk of study outcomes within specific practices. For example, physicians who were seeing patients of high cardiovascular risk may have more frequently prescribed rofecoxib. Such a group of physicians could be rheumatologists, as rheumatoid arthritis is related to an increased risk of MI, and rheumatologists may also have been more likely to prescribe rofecoxib. Such clustering can be minimized by limiting the analysis to primary care physicians.
Third, the instrument must not be associated with the study outcome other than through the actual exposure. Although it can be generally assumed that a physician’s preference for a specific NSAID cannot directly influence the next patient’s outcome other than through the actual treatment, physicians can influence an outcome in ways other than through the choice of study drug. For example, physicians who are high prescribers of celecoxib may also be more likely to screen for and treat coronary heart disease aggressively. This limitation applies equally to conventional analyses and needs to be addressed.
Although IV methods are just beginning to appear in the medical literature, first applications are promising.
SENSITIVITY ANALYSES
With the existence of ever larger databases and study cohorts, the importance of random error diminishes. Comparing simple proportions to assess balance between two treatment groups often entails inspection of 95% confidence limits or P-values to evaluate differences between groups. In large databases studies, however, these proportions are likely to have very narrow and non-overlapping confidence intervals (or ”significant” P-values) simply because of the enormous number of observations. This makes it clear that random error is only the first step in assessing the data; a second step is to judge whether the magnitude of the observed differences is clinically relevant.
Assessing the potential for systematic error, including confounding, becomes therefore even more important. However, all too often pharmacoepidemiologic studies discuss the potential for residual confounding only qualitatively without a quantitative assessment of the magnitude of such bias. Such sensitivity analyses were described as “the last line of defense against biases after every effort has been made to eliminate, reduce, or control them in study design, data collection, and data analysis”.77
The basic concept of sensitivity analyses is to make informed assumptions about potential residual confounding and quantify its effect on the relative risk estimate of the drug–outcome association. If suitable data sources can be identified, these assumptions can be substituted by empirical estimates. A basic sensitivity analysis includes the production of a grid of estimates as a function of several assumptions with limited knowledge of the true parameter constellation.63,78 Recent studies have explored how strong unmeasured confounding must be used to explain the elevated relative risks observed in studies of drug effects using health care utilization databases.79–81 Figure 7 provides an example of such a sensitivity analysis for residual confounding employed by Psaty et al.82 in a study on the association between calcium channel blocker use and acute MI.
Figure 7.
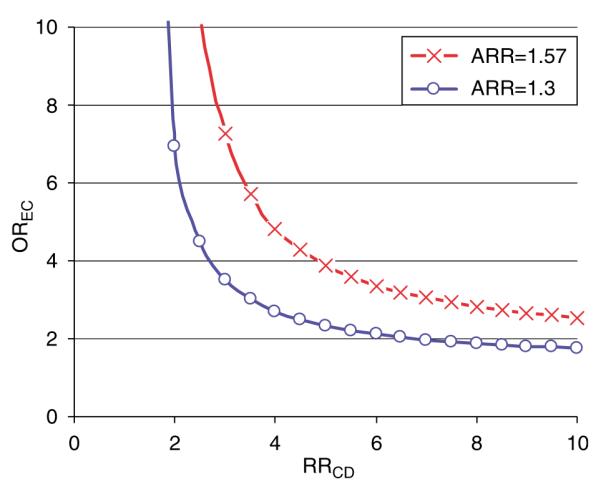
Sensitivity analysis of residual confounding. This example by Psaty et al.82 evaluates the effect of unmeasured confounders on the association between calcium channel blocker (CCB) use and acute MI (apparent relative risk or ARR = 1.57). The study assumed a prevalence of the unobserved confounder (PC) of 0.2 and a prevalence of CCB treatment (PE) of 0.01. Each line splits the area into two: the upper right area represents all parameter combinations of the association between confounders and drug use (OREC) and the strength of the association between the confounder and outcome (RRCD) that would create confounding by an unmeasured factor strong enough to move the point estimate of the ARR (ARR 1.57) to the null (ARR 1) or even lower, i.e., make the association go away. Conversely, the area to the lower left represents all parameter combinations that would not be able to move the ARR to the null.
CONCLUSION
Several fundamentally different approaches are currently available to improving the validity of non-randomized studies on the comparative effectiveness of therapeutics. A good understanding of prescribing practice is key selecting the most valid analytic strategy. Despite positive developments in the field, researchers should always entertain the thought that some comparisons are inherently confounded that non-randomized research will rarely produce entirely unbiased results.83 If ever there was guiding principle for comparative effectiveness research non-experimental studies, it could be paraphrased: Grant me adequate methods to study the questions that I can study, accept that there are questions that I cannot study, and give me the wisdom to know the difference.
ACKNOWLEDGMENTS
Dr Schneeweiss received support from the National Institute on Aging (RO1-AG021950) and the Agency for Healthcare Research and Quality (2-RO1-HS10881), Department of Health and Human Services, Rockville, MD. He is Principal Investigator of the Brigham & Women’s Hospital DEcIDE Research Center on Comparative Effectiveness Research funded by AHRQ. He thanks colleagues at Harvard for many helpful discussions: Alan Brookhart, PhD, Robert J Glynn, PhD, ScD, Til Stürmer, MD, MPH, and Alexander M Walker, MD, DrPH.
Footnotes
CONFLICT OF INTEREST The author declared no conflict of interest.
References
- 1.Cochrane A. Effectiveness and Efficiency: Random Reflection on Health Services. Nuffiled Provincial Trust; London: 1972. [Google Scholar]
- 2.van Luijn JCF, Gribnau FWJ, Leufkens HGM. Availability of comparative trials for the assessment of new medicines in the European Union at the moment of market authorization. Br. J. Clin. Pharm. 2007;63:159–162. doi: 10.1111/j.1365-2125.2006.02812.x. [DOI] [PMC free article] [PubMed] [Google Scholar]
- 3.Pisano DJ, Mantus D. FDA Regulatory Affairs: A Guide for Prescription Drugs, Medical Devices, and Biologics. CRC Press; Boca Rotan, FL: 2004. [Google Scholar]
- 4.Song F, Altman DG, Glenny AM, Deeks JJ. Validity of indirect comparison for estimating efficacy of competing interventions: empirical evidence from published meta–analyses. Br. Med. J. 2003;326:472–477. doi: 10.1136/bmj.326.7387.472. [DOI] [PMC free article] [PubMed] [Google Scholar]
- 5.Bucher HC, Guyatt GH, Griffith LE, Walter SD. The results of direct and indirect treatment comparisons in meta-analysis of randomized controlled trials. J. Clin. Epidemiol. 1997;50:683–691. doi: 10.1016/s0895-4356(97)00049-8. [DOI] [PubMed] [Google Scholar]
- 6.Lumley T. Network meta-analysis for indirect treatment comparisons. Stat. Med. 2002;21:2313–2324. doi: 10.1002/sim.1201. [DOI] [PubMed] [Google Scholar]
- 7.Lu G, Ades AE. Combination of direct and indirect evidence in mixed treatment comparisons. Stat. Med. 2004;23:3105–3124. doi: 10.1002/sim.1875. [DOI] [PubMed] [Google Scholar]
- 8.Schneeweiss S, Avorn J. A review of uses of health care utilization databases for epidemiologic research on therapeutics. J. Clin. Epidemiol. 2005;58:323–337. doi: 10.1016/j.jclinepi.2004.10.012. [DOI] [PubMed] [Google Scholar]
- 9.Halpern SD, Ubel PA, Berlin JA, Townsend RR, Asch DA. Physicians’ preferences for active-controlled versus placebo-controlled trials of new antihypertensive drugs. J. Gen. Int. Med. 2002;17:689–695. doi: 10.1046/j.1525-1497.2002.11024.x. [DOI] [PMC free article] [PubMed] [Google Scholar]
- 10.Schneeweiss S. Reference drug programs: effectiveness and policy implications. Health Policy. 2007;81:17–28. doi: 10.1016/j.healthpol.2006.05.001. [DOI] [PMC free article] [PubMed] [Google Scholar]
- 11.Clancy C. Getting to “smart” health care comparative effectiveness research is a key component of, but tightly linked with, health care delivery in the information age. Health Aff. 2006:w589–w592. doi: 10.1377/hlthaff.25.w589. [DOI] [PubMed] [Google Scholar]
- 12.Strom BL, Carson JL. Use of automated databases for pharmacoepidemiology research. Epidemiol. Rev. 1990;12:87–106. doi: 10.1093/oxfordjournals.epirev.a036064. [DOI] [PubMed] [Google Scholar]
- 13.Selby JV. Linking automated databases for research in managed care settings. Ann. Intern. Med. 1997;127:719–724. doi: 10.7326/0003-4819-127-8_part_2-199710151-00056. [DOI] [PubMed] [Google Scholar]
- 14.Platt R. The future of drug safety—challenges for FDA. Presented at the Institute of Medicine Forum; Washington, DC. 2007. [Google Scholar]
- 15.Rodriguez EM, Staffa JA, Graham DJ. The role of databases in drug postmarketing surveillance. Pharmacoepidemiol. Drug Saf. 2001;10:407–410. doi: 10.1002/pds.615. [DOI] [PubMed] [Google Scholar]
- 16.Schneeweiss S. Understanding secondary databases (Commentary) J. Clin. Epidemiol. 2007 doi: 10.1016/j.jclinepi.2006.10.019. in press. [DOI] [PMC free article] [PubMed] [Google Scholar]
- 17.Schneeweiss S, Glynn RJ, Avorn J, Solomon DH. A Medicare database review found that physician preferences increasingly outweighed patient characteristics as determinants of first-time prescriptions for cox-2 inhibitors. J. Clin. Epidemiol. 2005;58:98–102. doi: 10.1016/j.jclinepi.2004.06.002. [DOI] [PubMed] [Google Scholar]
- 18.Petri H, Urquhart J. Channeling bias in the interpretation of drug effects. Stat. Med. 1991;10:577–581. doi: 10.1002/sim.4780100409. [DOI] [PubMed] [Google Scholar]
- 19.Walker AM. Confounding by indication. Epidemiology. 1996;7:335–336. [PubMed] [Google Scholar]
- 20.MacDonald TM, Morant SV, Goldstein JL, Burke TA, Pettitt D. Channelling bias and the incidence of gastrointestinal haemorrhage in users of meloxicam, coxibs, and older, non-specific non-steroidal anti-inflammatory drugs. Gut. 2003;52:1265–1270. doi: 10.1136/gut.52.9.1265. [DOI] [PMC free article] [PubMed] [Google Scholar]
- 21.Moore RA, Derry S, Makinson GT, MacQuay HJ. Tolerability and adverse events in clinical trials of celecoxib in osteoarthritis and rheumatoid arthritis: systematic review and meta-analysis of information from company clinical trial reports. Arthritis. Res. Ther. 2005;7:R644–R665. doi: 10.1186/ar1704. [DOI] [PMC free article] [PubMed] [Google Scholar]
- 22.Watson DJ, Harper SE, Zhao PL, Quan H, Bolognese JA, Simon TJ. Gastrointestinal tolerability of the selective cyclooxygenase-2 (COX-2) inhibitor rofecoxib compared with nonselective COX-1 and COX-2 inhibitors in osteoarthritis. Arch. Intern. Med. 2000;160:2998–3003. doi: 10.1001/archinte.160.19.2998. [DOI] [PubMed] [Google Scholar]
- 23.Eisen GM, Goldstein JL, Hanna DB, Rublee DA. Meta-analysis: upper gastrointestinal tolerability of valdecoxib, a cyclooxygenase-2-specific inhibitor, compared with nonspecific nonsteroidal anti-inflammatory drugs among patients with osteoarthritis and rheumatoid arthritis. Aliment. Pharmacol. Ther. 2005;21:591–598. doi: 10.1111/j.1365-2036.2005.02383.x. [DOI] [PubMed] [Google Scholar]
- 24.McMahon AD. Observation and experiment with the efficacy of drugs: a warning example from a cohort of nonsteroidal anti-inflammatory and ulcer-healing drug users. Am. J. Epidemiol. 2001;154:557–562. doi: 10.1093/aje/154.6.557. [DOI] [PubMed] [Google Scholar]
- 25.Laporte JR, Ibanez L, Vidal X, Vendrell L, Leone R. Upper gastrointestinal bleeding associated with the use of NSAIDs: newer versus older agents. Drug Saf. 2004;27:411–420. doi: 10.2165/00002018-200427060-00005. [DOI] [PubMed] [Google Scholar]
- 26.Greenland S, Pearl J, Robins JM. Causal diagrams for epidemiologic research. Epidemiology. 1999;10:37–48. [PubMed] [Google Scholar]
- 27.Vandenbroucke JP. When are observational studies as credible as randomized trials? Lancet. 2004;363:1728–1731. doi: 10.1016/S0140-6736(04)16261-2. [DOI] [PubMed] [Google Scholar]
- 28.Wolfe F, Flowers N, Burke TA, Arguelles LM, Pettitt D. Increase in lifetime adverse drug reactions, service utilization, and disease severity among patients who will start COX-2 specific inhibitors: quantitative assessment of channeling bias and confounding by indication in 6689 patients with rheumatoid arthritis and osteoarthritis. J. Rheumatol. 2002;29:1015–1022. [PubMed] [Google Scholar]
- 29.Sorensen HT, Lash TL, Rothman KJ. Beyond randomized controlled trials: a critical comparison of trials with non-randomized studies. Hepatology. 2006;44:1075–1082. doi: 10.1002/hep.21404. [DOI] [PubMed] [Google Scholar]
- 30.Rubin DB. Estimating causal effects of treatments in randomized and nonrandomized studies. J. Edu. Psychol. 1974;66:688–701. [Google Scholar]
- 31.Sebaldt RJ, Petrie A, Goldsmith CH, Marentette MA. Appropriateness of NSAID and Coxib prescribing for patients with osteoarthritis by primary care physicians in Ontario: results from the CANOAR study. Am. J. Manag. Care. 2004;10:742–750. [PubMed] [Google Scholar]
- 32.Schneeweiss S, Glynn RJ, Tsai EH, Avorn J, Solomon DH. Adjusting for unmeasured confounders in pharmacoepidemiologic claims data using external information: the example of COX2 inhibitions and myocardial infarction. Epidemiology. 2005;16:17–24. doi: 10.1097/01.ede.0000147164.11879.b5. [DOI] [PubMed] [Google Scholar]
- 33.Brookhart MA, Solomon DH, Wang P, Glynn RJ, Avorn J, Schneeweiss S. Explained variation in a model of therapeutic decision making is partitioned across patient, physician, and clinic factors. J. Clin. Epidemiol. 2006;59:18–25. doi: 10.1016/j.jclinepi.2005.07.005. [DOI] [PubMed] [Google Scholar]
- 34.Schneeweiss S, Solomon DH, Wang PS, Brookhart MA. Simultaneous assessment of short-term gastrointestinal benefits and cardiovascular risks of selective COX-2 inhibitors and non-selective NSAIDs: an instrumental variable analysis. Arthritis Rheum. 2006;54:3390–3398. doi: 10.1002/art.22219. [DOI] [PubMed] [Google Scholar]
- 35.Schneeweiss S, et al. Restriction in pharmacoepidemiologic database studies of elderly to approximate randomized trial results. Med. Care. 2007 doi: 10.1097/MLR.0b013e318070c08e. (in press) [DOI] [PMC free article] [PubMed] [Google Scholar]
- 36.Ray WA. Evaluating medication effects outside of clinical trials: new-user designs. Am. J. Epidemiol. 2003;158:915–920. doi: 10.1093/aje/kwg231. [DOI] [PubMed] [Google Scholar]
- 37.Glynn RJ, Knight EL, Levin R, Avorn J. Paradoxical relations of drug treatment with mortality in older persons. Epidemiology. 2001;12:682–689. doi: 10.1097/00001648-200111000-00017. [DOI] [PubMed] [Google Scholar]
- 38.Glynn RJ, Schneeweiss S, Wang P, Levin R, Avorn J. Selective prescribing can lead to over-estimation of the benefits of lipid lowering drugs. J. Clin. Epidemiol. 2006;59:819–828. doi: 10.1016/j.jclinepi.2005.12.012. [DOI] [PubMed] [Google Scholar]
- 39.Stürmer T, Rothman KJ, Glynn RJ. Insights into different results from different causal contrasts in the presence of effect-measure modification. Pharmacoepidemiol. Drug Saf. 2006;15:698–709. doi: 10.1002/pds.1231. [DOI] [PMC free article] [PubMed] [Google Scholar]
- 40.Benner JS, Glynn RJ, Mogun H, Neumann PJ, Weinstein MC, Avorn J. Long-term persistence in use of statin therapy in elderly patients. JAMA. 2002;288:455–461. doi: 10.1001/jama.288.4.455. [DOI] [PubMed] [Google Scholar]
- 41.Pablos-Mendez A, Barr RG, Shea S. Run-in periods in randomized trials: implications for the application of results in clinical practice. JAMA. 1998;279:222–225. doi: 10.1001/jama.279.3.222. [DOI] [PubMed] [Google Scholar]
- 42.Rothwell PM. Subgroup analysis in randomized controlled trials: importance, indications, and interpretation. Lancet. 2005;365:176–186. doi: 10.1016/S0140-6736(05)17709-5. [DOI] [PubMed] [Google Scholar]
- 43.Maclure M. The case-crossover design: a method for studying transient effects on the risk of acute events. Am. J. Epidemiol. 1991;133:144–153. doi: 10.1093/oxfordjournals.aje.a115853. [DOI] [PubMed] [Google Scholar]
- 44.Hallas J. Evidence of depression provoked by cardiovascular medication: a prescription sequence symmetry analysis. Epidemiology. 1996;7:478–484. [PubMed] [Google Scholar]
- 45.Hubbard R, Farrington P, Smith C, Smeeth L, Tattersfield A. Exposure to tricyclic and selective serotonin reuptake inhibitor antidepressants and the risk of hip fracture. Am. J. Epidemiol. 2003;158:77–84. doi: 10.1093/aje/kwg114. [DOI] [PubMed] [Google Scholar]
- 46.Schneeweiss S, Wang P. Association between SSRI use and hip fractures and the effect of residual confounding bias in claims database studies. J. Clin. Psychopharmacol. 2004;24:632–638. doi: 10.1097/01.jcp.0000145344.76288.39. [DOI] [PubMed] [Google Scholar]
- 47.Vines SK, Farrington CP. Within-subject exposure dependency in case-crossover studies. Stat. Med. 2001;20:3039–3049. doi: 10.1002/sim.960. [DOI] [PubMed] [Google Scholar]
- 48.Wang PS, Schneeweiss S, Glynn RJ, Mogun H, Avorn J. Use of the case-crossover design to study prolonged drug exposures and insidious outcomes. Ann. Epidemiol. 2004;14:296–303. doi: 10.1016/j.annepidem.2003.09.012. [DOI] [PubMed] [Google Scholar]
- 49.Suissa S. The case–time–control design. Epidemiology. 1995;6:248–253. doi: 10.1097/00001648-199505000-00010. [DOI] [PubMed] [Google Scholar]
- 50.Suissa S. The case–time–control design: further assumptions and conditions. Epidemiology. 1998;9:441–445. [PubMed] [Google Scholar]
- 51.Roblin DW, et al. Effect of increased cost-sharing on oral hypoglycemic use in five managed care organizations: how much is too much? Med. Care. 2005;43:951–959. doi: 10.1097/01.mlr.0000178216.23514.b7. [DOI] [PubMed] [Google Scholar]
- 52.Schneeweiss S, Seeger J, Maclure M, Wang P, Avorn J, Glynn RJ. Performance of comorbidity scores to control for confounding in epidemiologic studies using claims data. Am. J. Epidemiol. 2001;154:854–864. doi: 10.1093/aje/154.9.854. [DOI] [PubMed] [Google Scholar]
- 53.Wooldridge JM. Econometric Analysis of Cross Section and Panel Data. MIT Press; Cambridge, MA: 2002. [Google Scholar]
- 54.Peduzzi P, Concato J, Kemper E, Holford TR, Feinstein AR. A simulation study of the number of events per variable in logistic regression analysis. J. Clin. Epidemiol. 1996;49:1373–1379. doi: 10.1016/s0895-4356(96)00236-3. [DOI] [PubMed] [Google Scholar]
- 55.Stürmer T, Joshi M, Glynn RJ, Avorn J, Rothman KJ, Schneeweiss S. A review of the application of propensity score methods yielded increasing use, advantages in specific settings, but not substantially different estimates compared with conventional multivariable methods. J. Clin. Epidemiol. 2006;59:437–447. doi: 10.1016/j.jclinepi.2005.07.004. [DOI] [PMC free article] [PubMed] [Google Scholar]
- 56.Rosenbaum PR, Rubin DB. The central role of the propensity score in observational studies for causal effects. Biometrika. 1983;70:41–55. [Google Scholar]
- 57.Miettinen OS. Stratification by a multivariate confounder score. Am. J. Epidemiol. 1976;104:609–620. doi: 10.1093/oxfordjournals.aje.a112339. [DOI] [PubMed] [Google Scholar]
- 58.Stürmer T, Schneeweiss S, Brookhart MA, Rothman KJ, Avorn J, Glynn RJ. Analytic strategies to adjust confounding bias using exposure propensity scores and disease risk scores: nonsteroidal anti-inflammatory drugs and short-term mortality in the elderly. Am. J. Epidemiol. 2005;161:891–898. doi: 10.1093/aje/kwi106. [DOI] [PMC free article] [PubMed] [Google Scholar]
- 59.Cepeda MS, Boston R, Farrar JT, Strom BL. Comparison of logistic regression versus propensity score when the number of events is low and there are multiple confounders. Am. J. Epidemiol. 2003;158:280–287. doi: 10.1093/aje/kwg115. [DOI] [PubMed] [Google Scholar]
- 60.Rothman KJ, Greenland S. Modern Epidemiology. 2nd edn Lippincott Williams & Wilkins; Philadelphia, PA: 1998. [Google Scholar]
- 61.Stürmer T, et al. Range restriction may reduce bias in stratified propensity score analyses: simulation results based on uniform effects. Pharmacoepidemiol. Drug Saf. 2006;15:S269–S270. [Google Scholar]
- 62.Kurth T, et al. Results of multivariable logistic regression, propensity matching, propensity adjustment, and propensity-based weighting under conditions of nonuniform effect. Am. J. Epidemiol. 2006;163:262–270. doi: 10.1093/aje/kwj047. [DOI] [PubMed] [Google Scholar]
- 63.Schneeweiss S. Sensitivity analysis and external adjustment for unmeasured confounders in epidemiologic database studies of therapeutics. Pharmacoepidemiol. Drug Saf. 2006;15:291–303. doi: 10.1002/pds.1200. [DOI] [PubMed] [Google Scholar]
- 64.Schneeweiss S, Wang P. Claims data studies of sedative-hypnotics and hip fractures in the elderly: exploring residual confounding using survey information. J. Am. Geriatr. Soc. 2005;53:948–954. doi: 10.1111/j.1532-5415.2005.53303.x. [DOI] [PubMed] [Google Scholar]
- 65.Stürmer T, Schneeweiss S, Avorn J, Glynn RJ. Correcting effect estimates for unmeasured confounding in cohort studies with validation studies using propensity score calibration. Am. J. Epidemiol. 2005;162:279–289. doi: 10.1093/aje/kwi192. [DOI] [PMC free article] [PubMed] [Google Scholar]
- 66.Sturmer T, Schneeweiss S, Rothman KJ, Avorn J, Glynn RJ. Performance of propensity score calibration—a simulation study. Am. J. Epidemiol. 2007;165:1110–1118. doi: 10.1093/aje/kwm074. [DOI] [PMC free article] [PubMed] [Google Scholar]
- 67.Collet JP, Schaubel D, Hanley J, Sharpe C, Boivin JF. Controlling confounding when studying large pharmacoepidemiologic databases: a case study of the two-stage sampling design. Epidemiology. 1998;9:309–315. doi: 10.1097/00001648-199805000-00011. [DOI] [PubMed] [Google Scholar]
- 68.Walker AM. Anamorphic analysis: sampling and estimation for covariate effects when both exposure and disease are known. Biometrics. 1982;38:1025–1032. [PubMed] [Google Scholar]
- 69.Cain KC, Breslow NE. Logistic regression analysis and efficient design for two-stage studies. Am. J. Epidemiol. 1988;128:1198–1206. doi: 10.1093/oxfordjournals.aje.a115074. [DOI] [PubMed] [Google Scholar]
- 70.Flanders WD, Greenland S. Analytic methods for two-stage case–control studies and other stratified designs. Stat. Med. 1991;10:739–747. doi: 10.1002/sim.4780100509. [DOI] [PubMed] [Google Scholar]
- 71.Bowden RJ, Turkington DA. Instrumental Variables. Cambridge University Press; Cambridge, UK: 1984. [Google Scholar]
- 72.Angrist JD, Imbens GW, Rubin DB. Identification of causal effects using instrumental variables. J. Am. Stat. Soc. 1996;91:444–455. [Google Scholar]
- 73.Angrist JD, Krueger AB. Instrumental variables and the search for identification: from supply and demand to natural experiments. J. Econ. Perspect. 2001 Fall15:69–85. [Google Scholar]
- 74.Murray MP. Avoiding invalid instruments and coping with weak instruments. J. Econ. Perspect. 2006;20:111–132. [Google Scholar]
- 75.Brookhart MA, Wang PS, Solomon DH, Schneeweiss S. Evaluating short-term drug effects in claims databases using physician-specific prescribing preferences as an instrumental variable. Epidemiology. 2006;17:268–275. doi: 10.1097/01.ede.0000193606.58671.c5. [DOI] [PMC free article] [PubMed] [Google Scholar]
- 76.Greene WH. Econometric Analysis. 3rd edn Prentice Hall; Upper Saddle River, NJ: 1997. pp. 740–742. [Google Scholar]
- 77.West SL, Strom BL, Poole C. Validity of pharmacoepidemiology drug and diagnosis data. In: Strom BL, editor. Pharmacoepidemiology. 3rd edn Wiley; Chichester: 2000. p. 668. [Google Scholar]
- 78.Schlesselman JJ. Assessing effects of confounding variables. Am. J. Epidemiol. 1978;108:3–8. [PubMed] [Google Scholar]
- 79.Walker AM. Newer oral contraceptives and the risk of venous thromboembolism. Contraception. 1998;57:169–181. doi: 10.1016/s0010-7824(98)00014-6. [DOI] [PubMed] [Google Scholar]
- 80.Wang PS, Bohn RL, Glynn RJ, Mogun H, Avorn J. Zolpidem use and hip fractures in older people. J. Am. Geriatr. Soc. 2001;49:1685–1690. doi: 10.1111/j.1532-5415.2001.49280.x. [DOI] [PubMed] [Google Scholar]
- 81.Gail MH, Wacholder S, Lubin JH. Indirect corrections for confounding under multiplicative and additive risk models. Am. J. Ind. Med. 1988;13:119–130. doi: 10.1002/ajim.4700130108. [DOI] [PubMed] [Google Scholar]
- 82.Psaty BM, et al. Assessment and control for confounding by indication in observational studies. J. Am. Geriatr. Soc. 1999;47:749–754. doi: 10.1111/j.1532-5415.1999.tb01603.x. [DOI] [PubMed] [Google Scholar]
- 83.Strom BL, Miettinen OS, Melmon KL. Postmarketing studies of drug efficacy: When must they be randomized. Clin. Pharmacol. Ther. 1983;34:1–7. doi: 10.1038/clpt.1983.119. [DOI] [PubMed] [Google Scholar]
- 84.ALLHAT Working Group Major outcomes in high-risk hypertensive patients randomized to angiotensin-converting enzyme inhibitor or calcium channel blocker vs diuretic. The Antihypertensive and Lipid-Lowering Treatment to Prevent Heart Attack Trial (ALLHAT) JAMA. 2002;288:2981–2997. doi: 10.1001/jama.288.23.2981. [DOI] [PubMed] [Google Scholar]
- 85.Schneider LS, et al. CATIE-AD Study Group Effectiveness of atypical antipsychotic drugs in patients with Alzheimer’s disease. N. Engl. J. Med. 2006;355:1525–1538. doi: 10.1056/NEJMoa061240. [DOI] [PubMed] [Google Scholar]
- 86.Pilote L, Abrahamowicz M, Rodrigues E, Eisenberg MJ, Rahme E. Mortality rates in elderly patients who take different angiotensin-converting enzyme inhibitors after acute myocardial infarction: a class effect? Ann. Intern. Med. 2004;141:102–112. doi: 10.7326/0003-4819-141-2-200407200-00008. [DOI] [PubMed] [Google Scholar]
- 87.Wang PS, et al. Risk of death in elderly users of conventional vs atypical antipsychotic medications. N. Engl. J. Med. 2005;353:2335–2341. doi: 10.1056/NEJMoa052827. [DOI] [PubMed] [Google Scholar]
- 88.Solomon DH. Selective cyclooxygenase 2 inhibitors and cardiovascular events. Arthritis Rheum. 2005;52:1968–1978. doi: 10.1002/art.21132. [DOI] [PubMed] [Google Scholar]