Abstract
tRNAs are among the most ancient, highly conserved sequences on earth, but are often thought to be poor phylogenetic markers because they are short, often subject to horizontal gene transfer, and easily change specificity. Here we use an algorithm now commonly used in microbial ecology, UniFrac, to cluster 175 genomes spanning all three domains of life based on the phylogenetic relationships among their complete tRNA pools. We find that the overall pattern of similarities and differences in the tRNA pools recaptures universal phylogeny to a remarkable extent, and that the resulting tree is similar to the distribution of bootstrapped rRNA trees from the same genomes. In contrast, the trees derived from tRNAs of identical specificity or of individual isoacceptors generally produced trees of lower quality. However, some tRNA isoacceptors were very good predictors of the overall pattern of organismal evolution. These results show that UniFrac can extract meaningful biological patterns from even phylogenies with high level of statistical inaccuracy and horizontal gene transfer, and that, overall, the pattern of tRNA evolution tracks universal phylogeny and provides a background against which we can test hypotheses about the evolution of individual isoacceptors.
Keywords: evolution, isoacceptors, phylogeny, tRNA, unifrac
INTRODUCTION
Transfer RNAs (tRNAs) are thought to be among the oldest biological sequences, present at the dawn of life in the last universal common ancestor (LUCA). tRNAs provide a critical step in translation, enforcing the genetic code by linking anticodon to amino acid (Crick 1957) and are widely speculated to be among the most ancient RNA molecules (Crick et al. 1976; Eigen and Winkler-Oswatitsch 1981b; Fitch and Upper 1987; Szathmary 1993; Di Giulio 1994, 2004). The availability of large tRNA databases (Lowe and Eddy 1997; Marck and Grosjean 2002; Sprinzl and Vassilenko 2005), containing tens of thousands of tRNA sequences from hundreds of complete genomes, has allowed the development of the new field of “tRNAomics” (Marck and Grosjean 2002), in which the analysis of complete tRNA pools can be used to reveal selective pressures on the evolution of the translation apparatus. The overall structure of the tRNA molecules is well conserved at both the secondary and tertiary levels, with some exceptions for specific identity elements such as the variable loops (Giege et al. 1998; Marck and Grosjean 2002).
Most bioinformatics studies of tRNA evolution to date were aimed at identifying tRNA identity elements (Marck and Grosjean 2002; Ardell and Andersson 2006) or sequence patterns associated with other functions of tRNA in translation (Saks et al. 1998), but not the overall pattern of tRNA evolution per se. Despite interest in tRNA phylogeny as a source of information about the evolution of the genetic code (Eigen and Winkler-Oswatitsch 1981a,b; Fitch and Upper 1987; Eigen et al. 1989; Di Giulio 1994, 1995, 1999, 2004, 2006), and, although tRNAs were among the first nucleic acid sequences to be used for phylogenetic reconstruction (Cedergren et al. 1980; Sankoff et al. 1982), the phylogenetic trees obtained from tRNAs are often radically different from the trees relating the species. tRNAs are now considered especially poor candidates for phylogenetic studies for several reasons. First, the sequences are short (the canonical tRNA sequence is 76 nucleotides [nt]), including invariant regions such as the terminal CCA and regions under strong selective pressure such as the anticodon loop and nucleotides involved in tertiary interactions. Additional pressures conserving tRNA structure may be imposed by the sequence requirements of other components of the translation machinery that interact with tRNAs: For example, conserved nucleotide patterns in bacterial tRNAs that correlate with the anticodon sequences were recently identified (Saks and Conery 2007). Second, tRNAs are often involved in horizontal gene transfer, in part because mobile elements such as prophages carrying their own tRNAs are better able to express their genes after transfer (Canchaya et al. 2004), and partly because many mobile elements preferentially integrate into or near tRNA genes (Williams 2002). Indeed, these processes are so predictable that proximity to tRNAs has been exploited in computational methods for finding both prophages (Fouts 2006) and other genomic islands (Ou et al. 2006). Third, tRNAs can change specificity by as little as a single point mutation in an anticodon (Saks et al. 1998), suggesting that membership in a given tRNA isoacceptor family is not necessarily an evolutionary stable trait. Fourth, tRNAs have extensive paralogy through gene duplication, making the pattern of species evolution difficult to see through the tangle of duplications and losses of individual tRNA genes. Thus, it is reasonable to expect that the phylogenies of individual tRNA isoacceptor families might fail to match the organismal phylogeny. However, the question remains: Do more closely related organisms tend to have more similar tRNA pools?
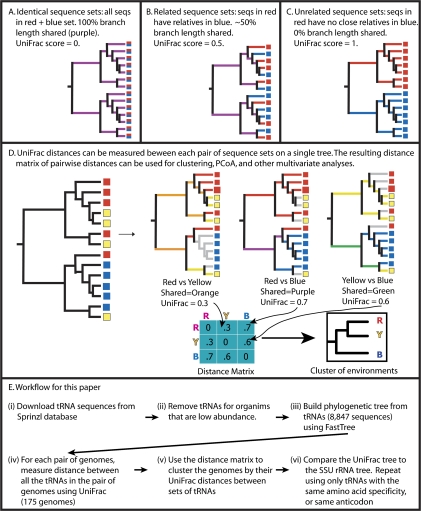
An algorithm that we developed that has been widely applied in microbial ecology, UniFrac, addresses this kind of question (Fig. 1; Lozupone and Knight 2005; Lozupone et al. 2006). UniFrac works by measuring distances between groups of sequences on a phylogenetic tree in terms of the amount of evolution (measured by branch length within the tree) that is unique to each group. It then uses hierarchical clustering (Sneath and Sokal 1973) to relate the groups based on these distances. Although it was originally developed for the analysis of microbial communities, in which the groups represent different environmental samples of 16S rRNA or other functional genes amplified from environmental samples (Ley et al. 2005; Lozupone and Knight 2005), it can be applied to a wide range of other problems. For instance, we also recently used it to cluster genomes based on their pools of carbohydrate-active enzymes, including glycosyltransferases and glycoside hydrolases, and showed that bacteria and archaea that inhabit the human gut have converged in gene content for these groups compared with their relatives that live in other environments (Lozupone et al. 2008). In the present work, we again use UniFrac to cluster genomes, but this time we treat each genome as a group of tRNA sequences (its tRNA pool).
FIGURE 1.
Overall tRNA tree-building procedure, including UniFrac clustering. UniFrac measures the fraction of branch length that is not shared between two groups of sequences, so that two identical groups of sequences (A) have a UniFrac score of 0, two completely dissimilar sets of sequences (C) have a UniFrac score of 1, and two related groups of sequences (B) have an intermediate UniFrac score. For a tree with many groups (here, the groups are genomes), the distance between each pair of groups can be calculated separately and summarized in a distance matrix (D). The overall workflow, including UniFrac steps, is shown in E. These analyses were run using the weighted version of the UniFrac algorithm, which corrects for the abundance of each sequence (Lozupone et al. 2007).
In other studies, we have found that UniFrac is able to relate complex data sets containing dozens of different microbial lineages to one another, revealing patterns in the data such as the divide between saline and nonsaline aquatic communities (Lozupone and Knight 2005) and the dominance of founder effects in establishing mouse gut microbial communities (Ley et al. 2005). Here, where the “communities” are genomes, we expect to be able to detect the total amount of tRNA evolution in each lineage, which may or may not track the organismal phylogeny depending on whether the tRNA complement is largely inherited or largely under selection. For example, we might expect unrelated lineages with similar codon usage, such as GC-rich Gram positive and Gram negative bacteria, to appear more similar to one another rather than to their relatives; similarly, we might expect archaea and bacteria that have Class I lysyl-tRNA synthetases, or that are extreme thermophiles, to cluster together. Our goal is thus to test whether the overall pattern of tRNA evolution is phylogenetically stable, or whether genomes that are similar in some other respect have convergently evolved similar tRNA pools.
RESULTS
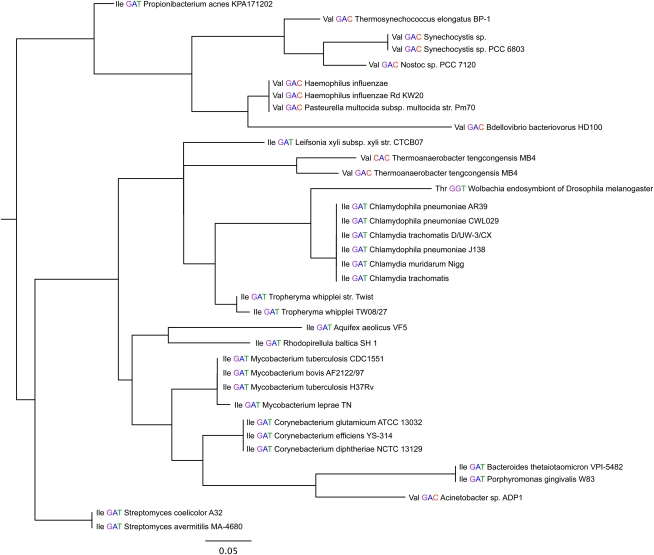
The neighbor-joining phylogenetic tree relating all 8847 tRNA sequences was difficult to interpret directly. Although there were blocks of isoacceptors that appeared more or less consistent with organismal phylogeny, in general amino acid specificity, isoacceptor identity, and genome were mixed together. Figure 2 shows an excerpt of 35 tRNAs from the full tree of 8847. Even in this small sample, several different amino acid specificities and a range of bacterial taxa are mixed together.
FIGURE 2.
Small excerpt from the neighbor-joining phylogenetic tree containing 8847 tRNA sequences. Each tRNA is labeled with its amino acid specificity, its anticodon, and the organism name. This tree containing only 35 tRNAs shows a mixture of several different amino acid specificities and different microbial lineages, reflecting the difficulty of using individual tRNA sequences for phylogeny. Scale bar shows 0.05 substitutions per site.
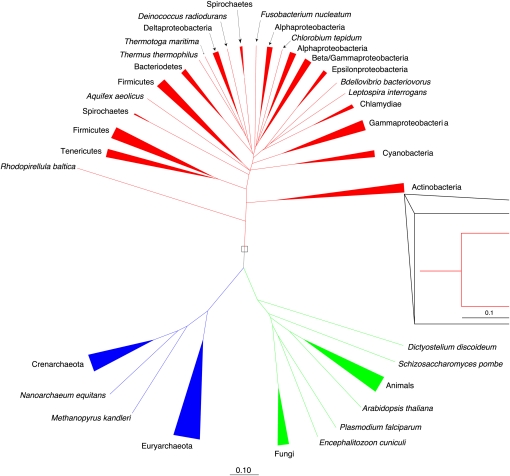
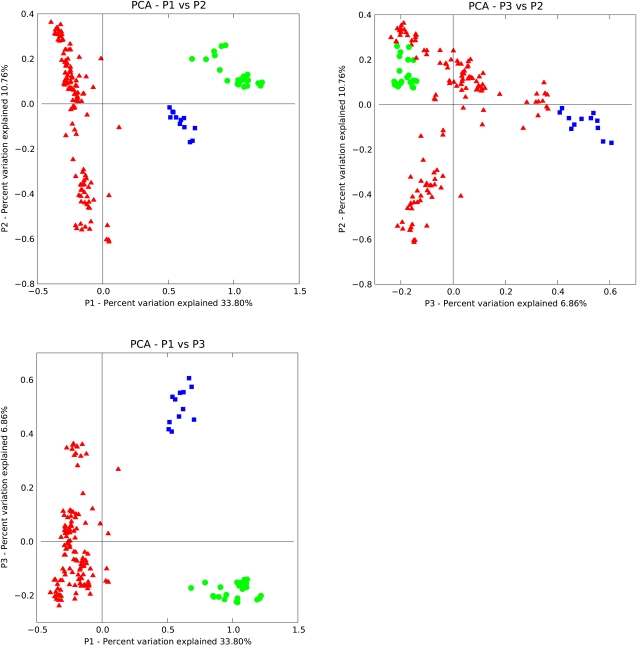
In contrast, the tree produced by applying UniFrac clustering to the tRNA pools from each genome reflected organismal phylogeny much better (Fig. 3). The monophyly of each of the three domains of life (the eukaryotes, the archaea, and the bacteria) is recovered, and in general taxonomic groups of organisms (genera, families, etc.) cluster together. The clustering can also be represented as a scatterplot by projecting the distance matrix relating all genomes down onto the n dimensions that best explain the variation in the data using a multivariate technique called principal coordinates analysis (PCoA) (Fig. 4 shows the first three dimensions). These scatter plots show the same pattern: Monophyly of each of the three domains of life and eukaryotes and archaea are grouped together to the exclusion of the bacteria. Specifically, the first principal component separates the bacteria from the other two domains; the second separates groups of bacteria from one another (primarily the Gram negatives, at the top, from the Gram positives), and the third separates the archaea from the eukaryotes. The split between Gram negatives and Gram positives in the bacteria is possibly an interesting feature because these are not monophyletic groups and suggests that cell wall structure has the potential to cause a convergence in tRNA pools. Counter to our initial hypotheses, we did not find that thermophilic archaea and bacteria clustered together or that clustering was driven by GC content. Similarly, at the level of the overall tRNA pools, spirochetes with the Class I lysyl-tRNA synthetase such as Borrelia burgdorferi (Ibba et al. 1997a) clustered with the bacteria rather than with the archaea.
FIGURE 3.
Weighted UniFrac tree of the tRNA pools in 175 genomes. The clustering recovers the monophyly of the eukaryotes (green), the archaea (blue), and the bacteria (red), along with a large number of genus-level and other taxonomic groupings. Inset shows grouping at the genus level within the actinobacteria.
FIGURE 4.
UniFrac PCoA of global tRNA pools showing clustering within the archaea (blue squares), eukaryotes (green circles), and bacteria (red triangles). The scatterplots show P1 against P2 (A), P3 against P2 (B), P1 against P3 (C), and P1 against P2 plotted with an equal number of genomes from each domain (D); axes are aligned for direct comparison of the same components. This clustering was performed using the weighted UniFrac algorithm as implemented on the UniFrac website (Lozupone et al. 2006).
In principal coordinates analyses, the axes are chosen to maximize the variability in the data set and can thus be dominated by the most abundant categories (in this case, the bacteria). Although the separation of bacterial groups along PC axis 2 suggests that, when all species in the database are considered, the bacteria have much more variation in tRNA content than do either the eukaryotes or the archaea, there are many more bacterial genomes in this data set than archaea and eukaryotes, and, when an equal number of genomes is sampled from each domain, the effect disappears. Reinforcing this point, the total amount of sequence divergence in each of the three domains is comparable (i.e., the diversity, in terms of branch length, in Fig. 3 does not reveal the bacteria to be far more diverse than the other domains). Thus, there is a clear split within the bacteria, but this split does not imply more variability overall in this domain than within the other two domains.
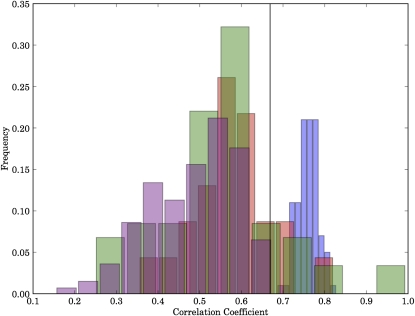
We tested the similarity of the tRNA pool cluster to a SSU rRNA tree using two approaches: the Mantel test (Bonnet and Van De Peer 2002) and MAST (Swofford 1998). The Mantel test is a permutation test that asks whether two distance matrices are correlated by permuting the row and column labels, calculating the correlation coefficient between the two matrices, and deriving an empirical distribution for the correlation expected by chance in the permuted matrices. It then tests whether the correlation coefficient for the true matrix is an outlier from the distribution of correlation coefficients from the permuted matrices. The Mantel test showed the correlation between the ARB 16S rRNA reference tree and the tree obtained from the full tRNA pool clustering to be highly significant (P < 10−6). The correlation coefficient between the tRNA pool tree and the reference SSU rRNA tree was high (r = 0.83), approaching the mean value of r = 0.88 for the correlation between the ARB tree and the bootstrapped NJ rRNA trees (Fig. 5). In contrast, the mean correlation coefficients from the trees based on clustering tRNAs, with UniFrac, from individual isoacceptor families, or from individual amino acid specificities, were much lower (r = 0.78 and r = 0.79, respectively). Interestingly, the tRNA isoacceptor clusters and amino acid clusters both outperformed on average trees built from arbitrarily sampled 76-nt regions of the 16S rRNA itself (Fig. 5).
FIGURE 5.
Distribution of correlation coefficients of distance matrices between the SSU rRNA reference phylogeny and bootstrapped rRNA trees sampled from the same alignment (blue), amino acid specificity clusters (red), isoacceptor clusters (green), and trees constructed from randomly sampled 76 nt rRNA slices (purple). Each element in a matrix corresponds to the branch length traversed when moving from one genome to another genome in the corresponding tree using the shortest possible path (the tip-to-tip distance). The correlation coefficient for the full tRNA pool clustering, 0.67, is shown as a black line.
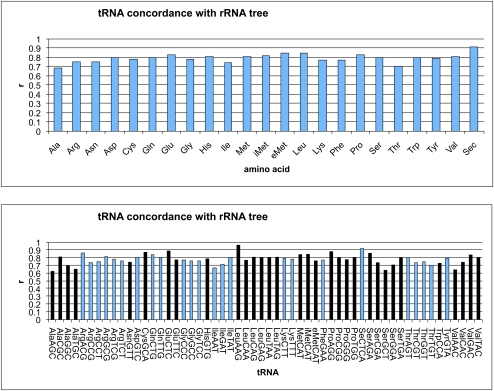
No individual amino acid specificity tree matched the rRNA tree especially closely (the best was selenocysteine, r = 0.91). The amino acid specificities ranged fairly evenly from r = 0.6 to r = 0.9 (Fig. 6A), and the isoacceptor trees were far more variable (Fig. 6B). The Leu-IAG tree correlates almost perfectly with the rRNA tree (r = 0.97, better than most bootstrapped rRNA trees). This strong correlation cannot be explained by restricted phylogenetic range (Leu-IAG tRNA is not found in archaea), because other tRNAs with similar phylogenetic distribution do not have similarly high correlations with the rRNA phylogeny. Sec-UCA, Ser-UCA, Pro-AGG, Glu-CUC, Val-UAC, and Ala-CGC all had r > 0.80 (note that A at the first position of the anticodon is typically modified to I in tRNAs). In contrast, Ser-GCU, Val-AAC, Ile-AAU, Thr-UGU, and Ala-UGC all had r < 0.70; similar variability in tRNA conservation was recently observed by Saks and Conery (2007). It is unclear why the evolutionary rate of certain isoacceptors is higher then the others. It is unlikely that the observed variation in the evolutionary rate of the different tRNA sequences is correlated with the evolution of the corresponding aminoacyl-tRNA synthetases, because their recognition patterns are the same among all the isoacceptor members of tRNA family and seem to be generally well conserved, at least in bacteria (Saks and Conery 2007).
FIGURE 6.
Concordance of individual tRNA trees with the rRNA tree for the full set of tRNAs for each amino acid (top), and for each isoacceptor family of tRNAs separately (bottom). Y-axis values range from 0 (no correlation with tRNA tree) to 1 (perfect correlation). iMet and eMet refer to initiator methionine and elongator methionine tRNAs separately. In the tRNA graph (bottom), the tRNAs with each amino acid specificity are colored the same way, alternating dark and light by family for clarity.
The poor correlation between the rate of tRNA and rRNA evolution might be caused either by higher or lower degrees of sequence conservation. The initiator tRNA-Met is by far more highly conserved than other tRNAs (Marck and Grosjean 2002). The higher conservation of initiator tRNAs may be explained by the additional functional pressure applied to these tRNA by interactions with the additional components of translation initiation machinery, such as initiation factor 2 (Varshney et al. 1993; Kolitz and Lorsch 2010).
Interestingly, the bacterial initiator tRNA is more conserved then either the archaeal or eukaryotic initiator tRNA. This conservation may be due to the requirement for formylation of this tRNA in bacteria. Other tRNAs with low r-values are not generally highly conserved. No particular pattern seems to link these anticodons: There is a mixture of GC contents, first anticodon position base identity, etc. However, the difference in phylogenetic stability between different amino acid and anticodon identities presumably has some biochemical basis, perhaps in terms of interactions with other components of the translation apparatus. There may be not a single factor that explains all the differential rates of evolution in different tRNA isoacceptors. We note that both tRNAAsn and tRNAGln fall in the group of tRNAs that correlate poorly with rRNA phylogeny. Both these tRNAs are considered to be later additions to the genetic code (e.g., Di Giulio 1994, 1995, 2004) and have to be adapted to the indirect transamidation pathway in most archaea and bacteria (Tumbula et al. 2000). Using tRNA phylogeny as a guide, we can now begin to explore the corresponding changes in translation machinery, with the hope of establishing causal relationships between changes in different lineages of interacting molecules.
DISCUSSION
Our results demonstrate that UniFrac is able to derive biologically meaningful patterns even from trees with considerable levels of horizontal gene transfer and statistical error in their reconstruction (in this case, due to short sequences) and has considerable promise for other applications. In particular, it expands upon previous work with carbohydrate-active enzymes (Lozupone et al. 2008) to show that UniFrac can meaningfully cluster genomes based on subsets of functional genes, to determine whether the content of the pools of these genes is driven by phylogenetic relationships or by the organism's lifestyles or habitats. It thus further supports the potential for the application of UniFrac to genomic and metagenomic data, in order to account to phylogenetic relationships in addition to presence/absence of genes while relating organisms or communities of organisms based on their gene content.
tRNAs were traditionally viewed as inadequate tracers of evolutionary events, primarily due to the their short length and frequent horizontal transfer between genomes. Our analyses have demonstrated that although most tRNA families and individual isoacceptors reflect the organismal phylogeny poorly, some isoacceptors, and the overall set of tRNAs in each genome, reflect the organismal phylogeny very well. Thus, the overall pattern of tRNA evolution is phylogenetically stable, and deviations from this reference pattern may reveal interesting biological features. Although the tRNA phylogenies are not quite as consistent as rRNA bootstrapped phylogenies, they may, like breakpoint phylogenies (Sankoff and Blanchette 1998), provide an additional source of information to help address poorly resolved relationships throughout the tree of life.
Why is UniFrac able to recover phylogenies using the complete tRNA pools, when the trees recovered from individual isoacceptors perform so poorly? We suspect that the answer is that although individual tRNAs have idiosyncratic histories, these histories differ from one another, and thus these individual effects disappear when UniFrac effectively averages the results over all tRNAs. Because the overall pattern of similarities in tRNA pools is consistent with organismal phylogeny, it is meaningful when organisms resemble each other in specific tRNA features. In future studies, application of the phylogenetic techniques may allow us to detect convergent evolution in response to specific factors, such as the gain or loss of a modifying enzyme that certain tRNAs must fold into a different structure to interact with (Ishitani et al. 2003), or gain or loss of an aminoacyl-tRNA synthetase. In particular, factors such as the use of a class I or class II lysyl-tRNA synthetase (Ibba et al. 1997b), or direct tRNA synthesis versus transamidation for Asn and Gln (Curnow et al. 1997), may be reflected in the history and conservation of specific groups of tRNA isoacceptors. Comparative evolutionary studies of tRNA may thus provide a clue to better understanding the evolution of the rest of the translation machinery.
We expected to find the effect of major events in evolution of tRNA aminoacylation machinery, such as introduction of the Asp and Glu transamidase pathways, indirect formation of Cys-tRNA Cys (Sauerwald et al. 2005), or the presence of class 1 lysyl-tRNA synthetase may be a significant factor in tRNA evolution. In our current analysis we did not find these events as a major factors affecting the evolution in the corresponding tRNA isoacceptor families. This finding agrees with notions derived from the study of the effect of the presence of an indirect pathway for Cys-tRNA Cys formation (Hohn et al. 2006). In this paper, the authors did not find any effect of the presence of Sep-tRNA synthetase on the identity features of tRNACys and concluded that formation of tRNACys identity preceded consequent evolution of aminoacylation machinery. The apparent lack of a visible effect of recruitment of novel tRNA recognition proteins on the phylogeny of potentially affected tRNAs implies that adaptation to the recruitment event occurs mostly on the protein side. It seems that adaptation of a newly recruited protein to pre-existing framework of tRNAs is evolutionary simpler than introducing changes into tRNA sequence, as the latter is already adapted to multiple interactions with other components of translational and RNA processing machinery. This finding is another confirmation of the notion that the tRNA system may have been established very early in evolution preceding formation of the modern aminoacylation system and divergence of aminoacyl-tRNA synthetases into the two modern classes.
MATERIALS AND METHODS
We used the Sprinzl genomic tRNA compilation (Sprinzl and Vassilenko 2005; Juhling et al. 2009) as our source for tRNA sequences. We identified 175 genomes (see Supplemental Data) where (1) the complete genome was available in the Sprinzl database, and (2) the full-length rRNA sequence was available from the Silva Arb database (Pruesse et al. 2007). tRNA sequences with unknown characters were removed from the alignment. Genomes with <20 tRNA genes were also removed from the full alignment. This procedure resulted in a final data set of 8847 tRNA sequences, of which 6047 were unique.
The reference small subunit (SSU) rRNA tree was obtained by the following procedure. First, the full SSU rRNA tree (SSU Ref 100) was obtained from the Silva Arb database. This tree consists of >400,000 sequences from all three domains. To construct the final tree for comparison with the tRNA tree, all sequences other than those corresponding to the 175 genomes were removed from the tree full tree.
Bootstrapped SSU rRNA alignments were built with the PyCogent (Knight et al. 2007) package, using a character matrix exported from ARB, and the highly variable regions were removed using the LaneMaskPH mask available for download at the Greengenes website (DeSantis et al. 2006). One thousand bootstrapped alignments were constructed and neighbor-joining trees were built using FastTree. We compared the ARB reference tree and the population of bootstrapped SSU rRNA trees to the population of tRNA trees described below.
We built two distinct types of tRNA-based trees [Fig. 1E, cf. (iii) and (v)]. First, we performed neighbor-joining (NJ) on the full 8847 sequence tRNA alignment. Second, we used weighted UniFrac clustering as implemented in the web interface (Lozupone et al. 2006) to cluster the genomes according to the tRNA pool that each genome contained. For these analyses, we excluded the variable loop and the anticodon domain of the tRNAs and added CCA to the ends of sequences in which the CCA was not encoded in the genomic sequence. The anticodon was excluded so that similarities between tRNAs would not be influenced by similarities in amino acid identity, which was the criterion used to group the tRNAs. Similarly, CCA is an invariant sequence in the mature tRNA molecule, and whether this sequence is genomically encoded or added after transcription is likely to be a distracting factor rather than a meaningful criterion for grouping. The variable loop was excluded to prevent artificial clustering of sequences based on differences in the length of this region.
Trees were compared using two methods: the Mantel test for distance matrix correlation, performed using the matrix of tip-to-tip distances relating each pair of taxa between a given pair of trees as implemented in the PyCogent package, and the subset distance which calculates the fraction of overlapping subsets where two trees differ (also implemented in the PyCogent package).
SUPPLEMENTAL MATERIAL
Supplemental material can be found at http://www.rnajournal.org.
ACKNOWLEDGMENTS
We thank Michael Yarus, Olke Uhlenbeck, Norm Pace, Jeffrey Gordon, and Frederic Bushman for valuable feedback on drafts of the manuscript, and Micah Hamady for assistance with an initial version of the analysis. C.L. was supported in part by NIH/CU Cell Signaling Training Program T32 GM08759. This work was supported in part by NSF grant MCB-0344002 to A.W., the W.M. Keck RNA Bioinformatics Initiative, by a donation from the Jane and Charlie Butcher Foundation, and by the Howard Hughes Medical Institute.
Footnotes
Article published online ahead of print. Article and publication date are at http://www.rnajournal.org/cgi/doi/10.1261/rna.726010.
REFERENCES
- Ardell DH, Andersson SG 2006. TFAM detects co-evolution of tRNA identity rules with lateral transfer of histidyl-tRNA synthetase. Nucleic Acids Res 34: 893–904 [DOI] [PMC free article] [PubMed] [Google Scholar]
- Bonnet E, Van De Peer Y 2002. zt: A software tool for simple and partial Mantel tests. J Stat Softw 7: 1–12 [Google Scholar]
- Canchaya C, Fournous G, Brussow H 2004. The impact of prophages on bacterial chromosomes. Mol Microbiol 53: 9–18 [DOI] [PubMed] [Google Scholar]
- Cedergren RJ, LaRue B, Sankoff D, Lapalme G, Grosjean H 1980. Convergence and minimal mutation criteria for evaluating early events in tRNA evolution. Proc Natl Acad Sci 77: 2791–2795 [DOI] [PMC free article] [PubMed] [Google Scholar]
- Crick FHC 1957. Discussion, in The structure of nucleic acids and their role in protein synthesis. Biochem Soc Symp 14: 25–26 [PubMed] [Google Scholar]
- Crick FHC, Brenner S, Klug A, Pieczenik G 1976. A speculation on the origin of protein synthesis. Orig Life 7: 389–397 [DOI] [PubMed] [Google Scholar]
- Curnow AW, Hong KW, Yuan R, Soll D 1997. tRNA-dependent amino acid transformations. Nucleic Acids Symp Ser 36: 2–4 [PubMed] [Google Scholar]
- DeSantis TZ Jr, Hugenholtz P, Keller K, Brodie EL, Larsen N, Piceno YM, Phan R, Andersen GL 2006. NAST: A multiple sequence alignment server for comparative analysis of 16S rRNA genes. Nucleic Acids Res 34Web Server issue: W394–W399 [DOI] [PMC free article] [PubMed] [Google Scholar]
- Di Giulio M 1994. The phylogeny of tRNA molecules and the origin of the genetic code. Orig Life Evol Biosph 24: 425–434 [DOI] [PubMed] [Google Scholar]
- Di Giulio M 1995. The phylogeny of tRNAs seems to confirm the predictions of the coevolution theory of the origin of the genetic code. Orig Life Evol Biosph 25: 549–564 [DOI] [PubMed] [Google Scholar]
- Di Giulio M 1999. The nonmonophyletic origin of the tRNA molecule. J Theor Biol 197: 403–414 [DOI] [PubMed] [Google Scholar]
- Di Giulio M 2004. The origin of the tRNA molecule: Implications for the origin of protein synthesis. J Theor Biol 226: 89–93 [DOI] [PubMed] [Google Scholar]
- Di Giulio M 2006. The nonmonophyletic origin of the tRNA molecule and the origin of genes only after the evolutionary stage of the last universal common ancestor (LUCA). J Theor Biol 240: 343–352 [DOI] [PubMed] [Google Scholar]
- Eigen M, Lindemann BF, Tietze M, Winkler-Oswatitsch R, Dress A, von Haeseler A 1989. How old is the genetic code? Statistical geometry of tRNA provides an answer. Science 244: 673–679 [DOI] [PubMed] [Google Scholar]
- Eigen M, Winkler-Oswatitsch R 1981a. Transfer-RNA, an early gene? Naturwissenschaften 68: 282–292 [DOI] [PubMed] [Google Scholar]
- Eigen M, Winkler-Oswatitsch R 1981b. Transfer-RNA: The early adaptor. Naturwissenschaften 68: 217–228 [DOI] [PubMed] [Google Scholar]
- Fitch WM, Upper K 1987. The phylogeny of tRNA sequences provides evidence for ambiguity reduction in the origin of the genetic code. Cold Spring Harb Symp Quant Biol 52: 759–767 [DOI] [PubMed] [Google Scholar]
- Fouts DE 2006. Phage_Finder: Automated identification and classification of prophage regions in complete bacterial genome sequences. Nucleic Acids Res 34: 5839–5851 [DOI] [PMC free article] [PubMed] [Google Scholar]
- Giege R, Sissler M, Florentz C 1998. Universal rules and idiosyncratic features in tRNA identity. Nucleic Acids Res 26: 5017–5035 [DOI] [PMC free article] [PubMed] [Google Scholar]
- Hohn MJ, Park HS, O'Donoghue P, Schnitzbauer M, Soll D 2006. Emergence of the universal genetic code imprinted in an RNA record. Proc Natl Acad Sci 103: 18095–18100 [DOI] [PMC free article] [PubMed] [Google Scholar]
- Ibba M, Bono JL, Rosa PA, Soll D 1997a. Archaeal-type lysyl-tRNA synthetase in the Lyme disease spirochete Borrelia burgdorferi. Proc Natl Acad Sci 94: 14383–14388 [DOI] [PMC free article] [PubMed] [Google Scholar]
- Ibba M, Morgan S, Curnow AW, Pridmore DR, Vothknecht UC, Gardner W, Lin W, Woese CR, Soll D 1997b. A euryarchaeal lysyl-tRNA synthetase: Resemblance to class I synthetases. Science 278: 1119–1122 [DOI] [PubMed] [Google Scholar]
- Ishitani R, Nureki O, Nameki N, Okada N, Nishimura S, Yokoyama S 2003. Alternative tertiary structure of tRNA for recognition by a posttranscriptional modification enzyme. Cell 113: 383–394 [DOI] [PubMed] [Google Scholar]
- Juhling F, Morl M, Hartmann RK, Sprinzl M, Stadler PF, Putz J 2009. tRNAdb 2009: Compilation of tRNA sequences and tRNA genes. Nucleic Acids Res 37: D159–D162 [DOI] [PMC free article] [PubMed] [Google Scholar]
- Knight R, Maxwell P, Birmingham A, Carnes J, Caporaso JG, Easton BC, Eaton M, Hamady M, Lindsay H, Liu Z, et al. 2007. PyCogent: A toolkit for making sense from sequence. Genome Biol 8: R171. [DOI] [PMC free article] [PubMed] [Google Scholar]
- Kolitz SE, Lorsch JR 2010. Eukaryotic initiator tRNA: Finely tuned and ready for action. FEBS Lett 584: 396–404 [DOI] [PMC free article] [PubMed] [Google Scholar]
- Ley RE, Backhed F, Turnbaugh P, Lozupone CA, Knight RD, Gordon JI 2005. Obesity alters gut microbial ecology. Proc Natl Acad Sci 102: 11070–11075 [DOI] [PMC free article] [PubMed] [Google Scholar]
- Lowe TM, Eddy SR 1997. tRNAscan-SE: A program for improved detection of transfer RNA genes in genomic sequence. Nucleic Acids Res 25: 955–964 [DOI] [PMC free article] [PubMed] [Google Scholar]
- Lozupone C, Knight R 2005. UniFrac: A new phylogenetic method for comparing microbial communities. Appl Environ Microbiol 71: 8228–8235 [DOI] [PMC free article] [PubMed] [Google Scholar]
- Lozupone C, Hamady M, Knight R 2006. UniFrac—an online tool for comparing microbial community diversity in a phylogenetic context. BMC Bioinformatics 7: 371. [DOI] [PMC free article] [PubMed] [Google Scholar]
- Lozupone CA, Hamady M, Kelley ST, Knight R 2007. Quantitative and qualitative β diversity measures lead to different insights into factors that structure microbial communities. Appl Environ Microbiol 73: 1576–1585 [DOI] [PMC free article] [PubMed] [Google Scholar]
- Lozupone CA, Hamady M, Cantarel BL, Coutinho PM, Henrissat B, Gordon JI, Knight R 2008. The convergence of carbohydrate active gene repertoires in human gut microbes. Proc Natl Acad Sci 105: 15076–15081 [DOI] [PMC free article] [PubMed] [Google Scholar]
- Marck C, Grosjean H 2002. tRNomics: Analysis of tRNA genes from 50 genomes of Eukarya, Archaea, and Bacteria reveals anticodon-sparing strategies and domain-specific features. RNA 8: 1189–1232 [DOI] [PMC free article] [PubMed] [Google Scholar]
- Ou HY, Chen LL, Lonnen J, Chaudhuri RR, Thani AB, Smith R, Garton NJ, Hinton J, Pallen M, Barer MR, et al. 2006. A novel strategy for the identification of genomic islands by comparative analysis of the contents and contexts of tRNA sites in closely related bacteria. Nucleic Acids Res 34: e3. [DOI] [PMC free article] [PubMed] [Google Scholar]
- Pruesse E, Quast C, Knittel K, Fuchs BM, Ludwig W, Peplies J, Glockner FO 2007. SILVA: A comprehensive online resource for quality checked and aligned ribosomal RNA sequence data compatible with ARB. Nucleic Acids Res 35: 7188–7196 [DOI] [PMC free article] [PubMed] [Google Scholar]
- Saks ME, Conery JS 2007. Anticodon-dependent conservation of bacterial tRNA gene sequences. RNA 13: 651–660 [DOI] [PMC free article] [PubMed] [Google Scholar]
- Saks ME, Sampson JR, Abelson J 1998. Evolution of a transfer RNA gene through a point mutation in the anticodon. Science 279: 1665–1670 [DOI] [PubMed] [Google Scholar]
- Sankoff D, Blanchette M 1998. Multiple genome rearrangement and breakpoint phylogeny. J Comput Biol 5: 555–570 [DOI] [PubMed] [Google Scholar]
- Sankoff D, Cedergren RJ, McKay W 1982. A strategy for sequence phylogeny research. Nucleic Acids Res 10: 421–431 [DOI] [PMC free article] [PubMed] [Google Scholar]
- Sauerwald A, Zhu W, Major TA, Roy H, Palioura S, Jahn D, Whitman WB, Yates JR III, Ibba M, Soll D 2005. RNA-dependent cysteine biosynthesis in archaea. Science 307: 1969–1972 [DOI] [PubMed] [Google Scholar]
- Sneath PHA, Sokal RR 1973. Numerical taxonomy Freeman, San Francisco [Google Scholar]
- Sprinzl M, Vassilenko KS 2005. Compilation of tRNA sequences and sequences of tRNA genes. Nucleic Acids Res 33: D139–D140 [DOI] [PMC free article] [PubMed] [Google Scholar]
- Swofford D 1998. PAUP*: Phylogenetic analysis using parsimony (and other methods) Sinauer Associates, Sunderland, MA [Google Scholar]
- Szathmary E 1993. Coding coenzyme handles: A hypothesis for the origin of the genetic code. Proc Natl Acad Sci 90: 9916–9920 [DOI] [PMC free article] [PubMed] [Google Scholar]
- Tumbula DL, Becker HD, Chang WZ, Soll D 2000. Domain-specific recruitment of amide amino acids for protein synthesis. Nature 407: 106–110 [DOI] [PubMed] [Google Scholar]
- Varshney U, Lee CP, RajBhandary UL 1993. From elongator tRNA to initiator tRNA. Proc Natl Acad Sci 90: 2305–2309 [DOI] [PMC free article] [PubMed] [Google Scholar]
- Williams KP 2002. Integration sites for genetic elements in prokaryotic tRNA and tmRNA genes: Sublocation preference of integrase subfamilies. Nucleic Acids Res 30: 866–875 [DOI] [PMC free article] [PubMed] [Google Scholar]


