Abstract
In this paper, we propose an automated method for colon registration from supine and prone scans. Four anatomical salient points on the colon are distinguished first. Then correlation optimized warping (COW) method is applied to the segments defined by the anatomical landmarks to find better global registration based on local correlation of segments. To utilize more features along the colon centerline, we extended the COW method by embedding canonical correlation analysis into it for correlation calculation of colon segments. To verify the effectiveness of the proposed method, we tested the algorithm on a CTC dataset of 19 patients with 23 polyps. Experimental results show that by using our method, the estimation error of polyp location could be reduced 68.5% (from 41.6mm to 13.1mm on average) compared to a traditional dynamic warping algorithm.
I. Introduction
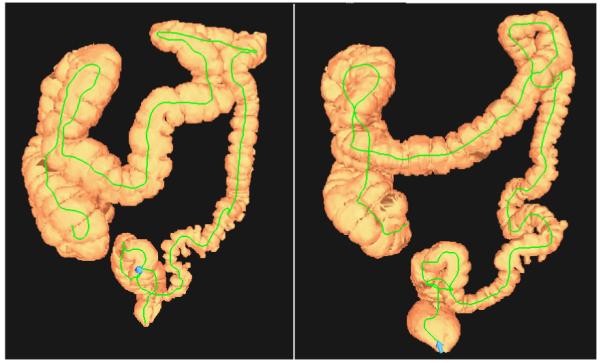
Colon cancer is the second leading cause of cancer-related deaths in the United States. It was estimated that there were 154,000 new cases and 52,000 deaths in 2007 [1]. Computed tomographic colonography (CTC) allows relatively noninvasive detection of colorectal polyps and cancer screening [2, 3]. In CTC, a patient will be scanned twice - once supine and once prone - to improve the sensitivity for polyp detection. This improves CTC sensitivity by reducing the extent of uninterpretable collapsed or fluid-filled segments. In Fig. 1 we show two typical three-dimensional colon CTC surface reconstructions of a patient.
Figure 1.

Two typical three-dimensional colon CTC surface reconstructions of a 55 years old man. Left: supine scan; right: prone scan. Lines inside the segmented colon indicate centerlines.
Because the colon moves between the prone and supine scans, colon registration is a challenging problem. One way to reduce the complexity of the problem is to register the centerlines of prone and supine scans. To make full use of shape information of the colon for registration, Nain et al. proposed a centerline registration algorithm based on dynamic time warping (DTW) and colon distension along the centerline [4]. They showed encouraging results for synchronized virtual colonoscopy. Nappi et al. proposed a region-based supine-prone correspondence method to reduce false-positive CAD polyp candidates in CTC [5]. Li et al. proposed a heuristic algorithm for the colon centerline registration by employing the coordinate information of the centerline [6]. To assist radiologists in CTC reading, in this paper we propose an automated method for colon registration based on correlation optimized warping (COW) [7] and canonical correlation analysis (CCA) [8].
II. Centerline Registration Algorithm
Our method contains two major steps. The first step extracts the centerline of the colon and calculates two features that describe the centerline (z-coordinate and curvature). The second step formulates the colon registration problem as a multiple time series matching problem that uses COW and CCA in combination with a priori knowledge of the anatomical structure of the human colon.
A. Correlation Optimized Warping Algorithm
The COW algorithm was proposed by Nielsen et al. to align chromatographic profiles for chemometric data analysis [7]. Given two time series to be aligned, we designate one as the target series T and the other the sample series P. The sample series P has LP+1. elements and total length LP (for equally-spaced time series data and sampling resolution of 1). If we segment the whole series P into segments of uniform-length m, then the number of sections N is given by N = Lp/m. (With N we can segment the target series T into N pieces at the same time so both P and T have N sections.) Each segment will be stretched or compressed using linear interpolation in order to generate aligned time series A. The border points of segments are referred to as nodes and the position of the starting point of section i in the target series T is defined as xi. Note that xi is also the starting point of segment i in aligned time series A after warping. For each segment, a slack variable t (an integer) is introduced. The slack variable t determines the warping magnitudes of each segment. The actual warping of section i is called ui (which is limited by the slack variable t). If there is a large difference between the length of time series T and P, then warpings are limited to fall in the interval ( Δ − t ; Δ + t ) where Δ is the difference of section length between T and P ( LT is the length of target series):.
To show how good the warping is for each section, we utilize the correlation coefficient ρ between the two corresponding segments of series T and A as the measure of alignment quality f(I): f(I) = ρ(IT, IA), where I denotes the I th segment. Segment alignment quality f(I). which is also called the benefit function defines the local alignment quality for each section. Our goal is to find the global optimal alignment between the entire series P and T. So we need to find an optimal combination of warpings of all segments as determined by the node positions in the aligned series A. The optimization problem can be formulated as follows: Given x0 = 0 < x1 < ⋯ < xN − 1 < xN = LT, ui ∈ [Δ − t, Δ + t]; i=0, ⋯, N − 1 and xi+1 = xi + m + ui; i = 0, ⋯, N − 1, the Optimal warping where [xi : xi+1] denotes the section defined by border points xi and xi+1.
The optimization problem shown above is a combinatorial optimization problem and can be solved by dynamic programming. More specifically, the algorithm is based on a matrix F whose size is (N + 1)×(LT + 1) and contents are the benefit function values. All the elements in F are initialized as minus infinite, except. F (N + 1, LT + 1), which equals zero and indicates that the last points of T and P are aligned. During the backward optimization process, each element in F is replaced by the accumulative benefit function: Fi,x = max (Fi+1, x+m+ui + f([x;x+m+ui])), i = 1, ⋯, N − 1. The global optimization value can be achieved at .
B. Canonical Correlation Analysis
The original COW algorithm can only align one dimensional time series. That means we can use only one feature of the centerline for alignment. However the centerline can be characterized by multiple different features. These features may have some complementary effects and combining them together may lead to better alignment. For example, z-coordinate feature can only show the height information of the centerline and we will know more shape information of the centerline if curvature along the centerline is provided. To make full use of the features extracted along the colon centerline, we embed canonical correlation analysis [8] which is a way of computing cross-covariance matrices for two groups of random variables into COW algorithm for correlation calculation of multiple time series.
Assume that we have two groups of variables X ∈ Rp and Y ∈ Rq with zero-mean. Each group of variables has n observations of samples. CCA considers a new coordinate for X by choosing a mapping Wx (canonical factor) and projecting X onto this new direction, X → 〈 Wx, X〉. The same is done for Y by choosing a mapping Wy. The projections and are called as canonical variables. The optimization objective function of CCA is
If we define Cxx ∈ Rp×p and Cyy ∈ Rq×q as the within-group covariance matrices of X and Y respectively, and Cxy ∈ Rp×q as the between-group covariance matrix, then the objective function can be written as . It can be shown that the stationary points W* of ρ (i.e., the points satisfying ∇ρ (W*) = 0) can be obtained by singular value decomposition (SVD) of the matrix . Let T = UDVT be a SVD of T. Then the i th canonical factor pair is and where ui and vi are the i th column of U and V respectively. The corresponding canonical correlations are the eigenvalues (diagonal entries of D).
C. Border Points Localization Based on Anatomical Structure of the Colon
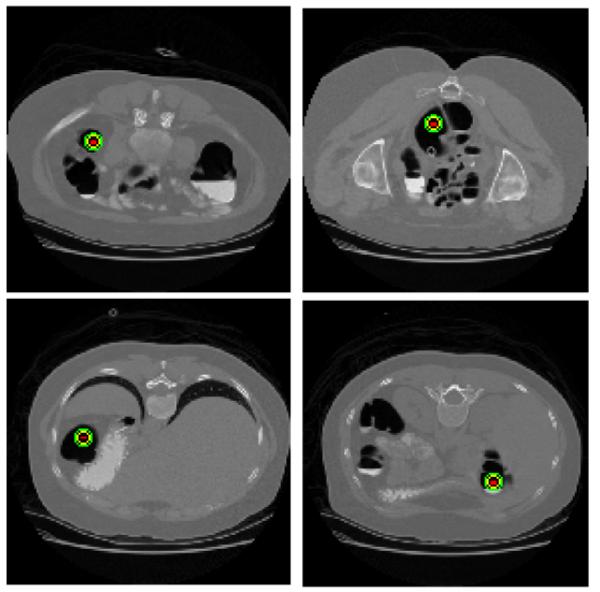
In the COW algorithm introduced above, the time series are divided into segments of uniform-length. In other words, the border points or nodes along the time series are determined arbitrarily. But for colon, we know that it has certain anatomical structure. Two flexures (splenic and hepatic) and two junctions (rectum-sigmoid and sigmoid-descending) play important roles in the segmentation of the colon [9]. These four anatomical landmarks can serve as border points or nodes. Especially for the splenic and hepatic flexures, they have less movement during supine and prone scans and are considered as reliable landmarks. In Fig. 2, we show CT slices of a patient in which four landmarks are marked as red dots with green circle. By utilizing these anatomical landmarks which are detected automatically, we can define more natural segments of the colon automatically and apply the COW method to the segments between the anatomical landmarks.
Figure 2.

Four landmarks of a patient (prone scan). The landmarks are marked by red dots with green circles.
III. Experiments
A. CTC Data Set
Our dataset consisted of CTC examinations of 19 patients collected from three medical centers. Each patient was scanned in the supine and prone positions. Each scan was done during a single breathhold using a 4-channel or 8-channel CT scanner. CT scanning parameters included 1.25- to 2.5-mm section collimation, 15 mm/s table speed, 1-mm reconstruction interval, 100 mAs, and 120 kVp. There were 23 polyps 7-25 mm in size. Each patient has at least one polyp. The polyps were confirmed by both traditional optical colonoscopy and virtual colonoscopy. The histologic diagnoses of these polyps were either hyperplastic or adenomatous.
B. Evaluation of Centerline Registration
To evaluate the registration quality, we need to calculate the warping error along the centerline. In this paper, we use a point evaluation strategy (the polyp position) to evaluate the calibration quality. A polyp’s position along the centerline can be computed by finding the minimum distance between the polyp’s position on the colonic wall and the points along the centerline. After the warping, we map the polyp’s supine centerline position to the prone centerline and use the difference of the centerline distances between prone point and estimated supine point on the prone centerline as the warping error. The centerline distance is the distance of a point on the centerline to the start of the centerline (rectum) measured along the centerline.
To show the effectiveness of the proposed method, we compared it to two other methods. The first one is called normalized distance along the centerline (NDAC) in which we normalize the lengths of the centerlines into the same range [0, 1] and then use linear interpolation to match the centerlines. The second method is the one proposed by Nain et al. which matches supine and prone centerlines based on colon distension information using dynamic time warping [4].
C. Experimental Results
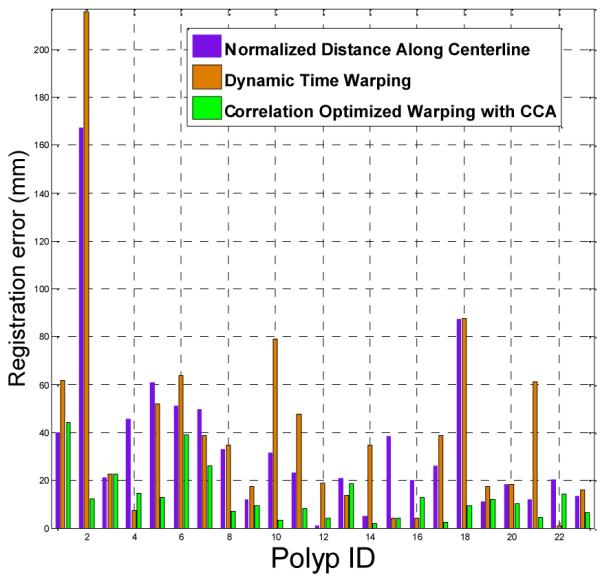
Fig. 3 shows the estimation error of polyp position along the centerline for the three methods. COW achieves the lowest estimation error on 15 of the cases. Experimental results show that by using our method, the estimation error of polyp location could be reduced 68.5% (from 41.6mm (std. 45.2mm) to 13.1mm (std. 10.9mm) on average) compared to a traditional dynamic warping algorithm. The 95% confidence intervals of the two sets of results are [22.1mm, 61.2mm] and [8.4mm, 17.8mm] respectively. Student t-hypothesis test shows that the improvement is significant at significance level 0.05 (p=0.005).
Figure 3.

Registration errors (mm) for the three centerline methods on the 19 patients with 23 colonic polyps.
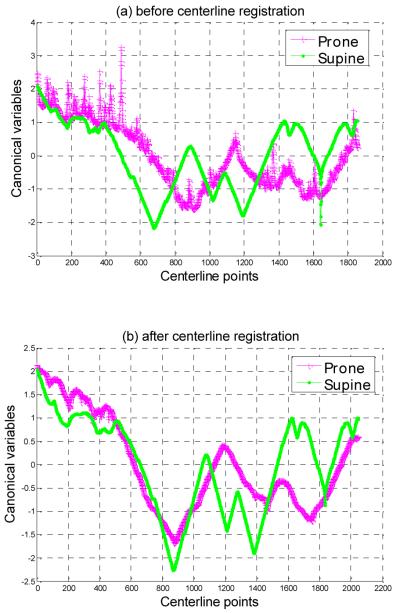
In order to show that our alignment method will lead to higher correlation between prone and supine centerlines, in Fig. 4 we show the first pair of canonical variables from prone and supine centerlines of a patient with/without our matching method. From Fig. 4 we can find that after centerline registration, the two canonical variables show better alignment compared with that without registration. Also we can find that the two canonical variables have similar shape after alignment. In Fig.4(a) There are some spikes on the prone canonical variables. These noisy spikes are related with curvatures from prone scan. They are removed in Fig.4(b) because CCA finds a direction which contains more common characteristics of the two scans after alignment.
Figure 4.
(a) The first pair of canonical variables from prone and supine centerlines of a patient before registration. (b) The first pair of canonical variables from prone and supine centerlines of a patient after applying our COW registration method.
IV. Conclusion
In this paper, we proposed an automated method for colon registration. Four anatomical salient points on the colon are distinguished first which can be viewed as landmarks along the central path of the colon. Then correlation optimized warping is applied to the segments defined by the anatomical landmarks to find better global registration based on local correlation between segments. The original COW algorithm can only align one-dimensional time series. To make full use of the features extracted along the centerline, we extend the algorithm to handle two dimensional time series by embedding canonical correlation analysis to compute cross-covariance matrices for two groups of random variables. Experiments on a CTC dataset of 19 patients show effectiveness of the proposed method.
Acknowledgment
This research was supported by the Intramural Research Program of the NIH Clinical Center. We thank Drs. Perry Pickhardt, J. Richard Choi and William Schindler for providing CT colonography data.
Contributor Information
Shijun Wang, Imaging Biomarkers and Computer-Aided Diagnosis Laboratory, Radiology and Imaging Sciences, National Institutes of Health, Building 10 Room B2S-231 MSC 1182, Bethesda, MD 20892-1182.
Jianhua Yao, Imaging Biomarkers and Computer-Aided Diagnosis Laboratory, Radiology and Imaging Sciences, National Institutes of Health, Building 10 Room B2S-231 MSC 1182, Bethesda, MD 20892-1182.
Jiamin Liu, Imaging Biomarkers and Computer-Aided Diagnosis Laboratory, Radiology and Imaging Sciences, National Institutes of Health, Building 10 Room B2S-231 MSC 1182, Bethesda, MD 20892-1182.
Nicholas Petrick, NIBIB/CDRH Laboratory for the Assessment of Medical Imaging Systems, Food and Drug Administration, 10903 New Hampshire Avenue, Silver Spring, MD 20993-0002.
Ronald M. Summers, Imaging Biomarkers and Computer-Aided Diagnosis Laboratory, Radiology and Imaging Sciences, National Institutes of Health, Building 10 Room B2S-231 MSC 1182, Bethesda, MD 20892-1182.
References
- [1].Jemal A, Siegel R, Ward E, Hao YP, Xu JQ, Murray T, Thun MJ. Cancer statistics, 2008. Ca-a Cancer Journal for Clinicians. 2008;58:71–96. doi: 10.3322/CA.2007.0010. [DOI] [PubMed] [Google Scholar]
- [2].Pickhardt PJ, Choi JR, Hwang I, Butler JA, Puckett ML, Hildebrandt HA, Wong RK, Nugent PA, Mysliwiec PA, Schindler WR. Computed tomographic virtual colonoscopy to screen for colorectal neoplasia in asymptomatic adults. N Engl J Med. 2003;349:2191–200. doi: 10.1056/NEJMoa031618. [DOI] [PubMed] [Google Scholar]
- [3].Johnson CD. Accuracy of CT Colonography for Detection of Large Adenomas and Cancers (vol 359, pg 1207, 2008) New England Journal of Medicine. 2008;359:2853–2853. doi: 10.1056/NEJMoa0800996. [DOI] [PMC free article] [PubMed] [Google Scholar]
- [4].Nain D, Haker S, Cosman WGE, Wells W, Ji H, Kikinis R, Westin C. Intra-patient Prone to Supine Colon Registration for Synchronized Virtual Colonoscopy; presented at Medical Image Computing and Computer-Assisted Intervention; 2002. [Google Scholar]
- [5].Nappi J, Okamura A, Frimmel H, Dachman A, Yoshida H. Region-based supine-prone correspondence for the reduction of false-positive CAD polyp candidates in CT colonography. Acad Radiol. 2005;12:695–707. doi: 10.1016/j.acra.2004.12.026. [DOI] [PubMed] [Google Scholar]
- [6].Ping L, Napel S, Acar B, Paik DS, Jeffrey RB, Beaulieu CF. Registration of central paths and colonic polyps between supine and prone scans in computed tomography colonography: Pilot study. Medical Physics. 2004;31:2912–2923. doi: 10.1118/1.1796171. [DOI] [PubMed] [Google Scholar]
- [7].Nielsen NPV, Carstensen JM, Smedsgaard J. Aligning of single and multiple wavelength chromatographic profiles for chemometric data analysis using correlation optimised warping. Journal of Chromatography A. 1998;805:17–35. [Google Scholar]
- [8].Hardoon DR, Szedmak S, Shawe-Taylor J. Canonical correlation analysis: An overview with application to learning methods. Neural Computation. 2004;16:2639–2664. doi: 10.1162/0899766042321814. [DOI] [PubMed] [Google Scholar]
- [9].Glynn PJ, Summers RM. Automated Labeling of Anatomic Segments of the Colon in CT Colonography; presented at Medical imaging of SPIE; 2009. [Google Scholar]


