

Abstract
Background
The concept of a body weight set point, determined predominantly by genetic mechanisms, has been proposed to explain the poor long-term results of conventional energy-restricted diets in the treatment of obesity.
Objective
The objective of this study was to examine whether dietary composition affects hormonal and metabolic adaptations to energy restriction.
Design
A randomized, crossover design was used to compare the effects of a high-glycemic-index (high-GI) and a low-glycemic-index (low-GI) energy-restricted diet. The macronutrient composition of the high-GI diet was (as percent of energy) 67% carbohydrate, 15% protein, and 18% fat and that of the low-GI diet was 43% carbohydrate, 27% protein, and 30% fat; the diets had similar total energy, energy density, and fiber contents. The subjects, 10 moderately overweight young men, were studied for 9 d on 2 separate occasions. On days −1 to 0, they consumed self-selected foods ad libitum. On days 1–6, they received an energy-restricted high- or low-GI diet. On days 7–8, the high-or low-GI diets were consumed ad libitum.
Results
Serum leptin decreased to a lesser extent from day 0 to day 6 with the high-GI diet than with the low-GI diet. Resting energy expenditure declined by 10.5% during the high-GI diet but by only 4.6% during the low-GI diet (7.38 ± 0.39 and 7.78 ± 0.36 MJ/d, respectively, on days 5–6; P = 0.04). Nitrogen balance tended to be more negative, and energy intake from snacks on days 7–8 was greater, with the high-GI than the low-GI diet.
Conclusion
Diets with identical energy contents can have different effects on leptin concentrations, energy expenditure, voluntary food intake, and nitrogen balance, suggesting that the physiologic adaptations to energy restriction can be modified by dietary composition.
Keywords: Obesity, glycemic index, energy-restricted diet, energy expenditure, blood glucose, insulin, leptin, nitrogen balance, feeding behavior, young men
INTRODUCTION
Excessive body weight is among the most important medical conditions in the United States, with prevalence rates of ≈25% in children (1) and > 50% in adults (2). Although the health consequences and economic costs of obesity are enormous (3), there is currently no effective dietary treatment for this problem (4). One explanation for the poor long-term results of conventional diets involves the concept of a body weight set point (5).
The results of numerous studies suggest that body weight is regulated within a specific range. When lean or obese weight-stable subjects were underfed to achieve a 7.5–10% change in body weight, total energy expenditure (TEE) decreased by ≈12–15% (5–8). Other physiologic changes induced by energy restriction include increased hunger and down-regulation of neuroendocrine functions (9–12). These adaptations together may act to antagonize further weight loss. Genetic factors are known to influence the range in which body weight is regulated (13). However, the increasing prevalence of obesity among genetically stable populations (14) indicates that environment must also play an important role in the regulation of body weight.
One environmental factor that may affect the apparent body weight set point is the dietary glycemic index (GI). The GI is defined as the area under the glycemic response curve for 2 h after consumption of 50 g carbohydrate from a test food divided by the area under the curve for 2 h after consumption of 50 g carbohydrate from a control substance (either white bread or glucose) (15). Most starchy foods commonly eaten in North America, chiefly refined-grain products and potatoes, have high GIs, exceeding that of table sugar by up to 50% (16). By contrast, vegetables, legumes, and fruit generally have low GIs (16). The presence of fiber, protein, and fat in a meal lowers the GI of co-ingested carbohydrate through effects on gastric emptying, glucose absorption, or insulin secretion (17–20). Numerous studies showed an inverse relation between GI and satiety in lean and obese subjects (21–26). High-GI meals were shown to elicit a sequence of hormonal changes that limit availability of metabolic fuels and cause overeating (26). Moreover, diets designed to reduce insulin secretion (eg, low-GI diets) may produce greater weight loss than do standard diets (27). We conducted a study to compare the hormonal and metabolic effects of 2 moderately energy-restricted diets with different GIs to test the hypothesis that dietary composition may modify the physiologic adaptations to energy restriction in overweight persons.
SUBJECTS AND METHODS
Subjects were young men with a mean age of 27.9 y (range: –18–34 y) who were moderately overweight [x̄ ± SEM body mass index (in kg/m2): 30.6 ± 1.5, range: 28.7–32.2). The subjects were otherwise in good health as determined by physical examination and laboratory tests (blood count, glycosylated hemoglobin, thyroid function, and liver function). All subjects were weight stable (within 5% of current body weight during the previous 6 mo, by self-report). We recruited subjects by advertising through local newspapers, flyers, and radio. Ten subjects successfully completed the protocol; one subject dropped out of the study and his data were not included in the results. The research was conducted in the General Clinical Research Center (GCRC), Children’s Hospital, Boston, with approval from the Institutional Review Board and written, informed consent from the subjects.
The experimental protocol followed a randomized, crossover design involving two 9-d admissions to the GCRC separated by a washout period of 2–6 wk. During the first 2 d of each admission (day −1 and day 0), subjects consumed a self-selected diet ad libitum and baseline measurements were obtained. During the next 6 d (days 1–6), subjects consumed either a high-GI or a low-GI energy-restricted test diet. On days 7 and 8, subjects continued to eat the high- or low-GI diets but were allowed to eat additional foods ad libitum from a private food bar. The study was concluded at dinnertime on day 8, allowing a total of 34 h for ad libitum food consumption. Subjects were required to exercise daily on a treadmill until 10% of TEE had been reached. TEE was determined for each subject by the Harris-Benedict equation multiplied by an activity factor of 1.4 (28). Before and between admissions to the GCRC, subjects were instructed to follow their usual diet and exercise patterns and to avoid caffeine, alcohol, and tobacco products.
Resting energy expenditure (REE) was measured by fasting indirect calorimetry (Vmax 29; SensorMedics Corporation, Yorba Linda, CA) for a total duration of 20–30 min while the subjects rested in bed. Blood samples were obtained after measurement of REE and before breakfast. In addition, blood samples were obtained on day 1 every 30 min by indwelling venous catheter for measurement of plasma glucose and serum insulin responses to breakfast, lunch, and dinner to verify predicted differences in GI (see below).
The macronutrient composition of the high-GI diet was (as percent of energy) 67% carbohydrate, 15% protein, and 18% fat and that of the low-GI diet was 43% carbohydrate, 27% protein, and 30% fat. The energy content of the 2 diets on days 1–6 was 50% of predicted TEE. The high-GI diet was predicted to have a GI approximately double that of the low-GI diet (15). For the average subject (aged 27.9 y, measuring 179.3 cm, and weighing 98.4 kg), the energy content of the diet was 6247 kJ, including breakfast, lunch, and dinner (each 1874 kJ) and a bedtime snack (625 kJ). Each meal was calculated to meet the high- or low-GI target macronutrient distribution. The high- and low-GI diets had similar fiber contents (25.6 and 29.0 g/d, respectively) and energy densities (2.95 and 2.96 kJ/g, respectively). Two rotating menus were used for each diet. Representative menus are shown in Table 1. The foods eaten ad libitum on days 7 and 8 included cold meats (turkey and roast beef), cheese, vegetables (celery and carrots), and condiments (mayonnaise and mustard). To maintain differences in GI, there were also slight differences between the high- and low-GI diets in terms of bread (white and pumpernickel), cereal (granola and bran cereal), fruit (banana and apple), milk (lactase-treated skim milk and 2%-fat milk), fruit drinks (sweetened with glucose and saccharine and sweetened with fructose), and gelatin (sweetened with glucose and saccharine and sweetened with fructose). Palatability of the ad libitum foods was assessed by using a 10-cm visual analogue scale. All meals were prepared under the supervision of the GCRC research dietitians at Brigham and Women’s Hospital, Boston. Nutrient compositions were measured by using FOOD PROCESSOR (version 7.0, 1996; ESHA Research, Salem, OR).
Table 1.
One of 2 alternating menus for the high-glycemic-index (high-GI) and low-glycemic-index (low-GI) diets
| High-GI diet | Low-GI diet | |
|---|---|---|
| Carbohydrate (% of energy) | 67 | 43 |
| Protein (% of energy) | 15 | 27 |
| Fat (% of energy) | 18 | 30 |
| Breakfast | Oatmeal (instant oatmeal, 2%-fat milk with lactase added, half and half cream, dextrose, wheat bran) Banana |
Omelet (1 whole egg, 1 egg white, spinach, tomato, low-fat cheddar cheese) Apple, with peel Pumpernickel bread Diet jelly |
| Lunch | Roast beef sandwich (roast beef, top round; wheat bread; mayonnaise; iceberg lettuce; tomato) Raisins Dried apricots Nonfat frozen yogurt |
Turkey breast sandwich (whole-grain 3-kernel bread, skinless turkey breast, mayonnaise, iceberg lettuce) Salad (iceberg lettuce, celery, cucumber, Italian dressing) Stewed tomatoes Apple, with peel Sugar-free gelatin |
| Dinner | Chicken Jambalaya (long-grain white rice, cooked; chicken breast; butter; sweet green bell pepper; tomato sauce; chopped onion) Butternut squash, cooked Angel food cake Skim milk with lactase added |
Salmon fillet String beans Sweet red bell pepper Butter Salad (iceberg lettuce, cucumber, tomato, fat-free French dressing) Pumpernickel bread Grapefruit |
| Snack | Half turkey sandwich (wheat bread, smoked turkey breast, mayonnaise, fat-free American cheese) Applesauce, sweetened |
Canned peaches in light syrup Whole-milk cottage cheese Half and half cream |
Blood samples were analyzed with the following instruments or kits: plasma glucose, Glucose Analyzer (APEC, Inc, Peabody, MA); serum insulin, Abbott IMx (Abbott Laboratories, Abbott Park, IL); and serum leptin, radioimmunoassay kit (Linco Research, Inc, St Charles, MO). Twenty-four–hour urine collections were analyzed for total nitrogen by using the Kjeldahl method (29) and were also analyzed for creatinine to assess adequacy of collection. Nitrogen balance, reported as the average of values obtained on days 3 and 6, was computed by using the following equation (30):
| (1) |
Areas under the glucose and insulin curves were determined by using the trapezoidal rule (FIGP 2.98 software; BIOSOFT, Cambridge, United Kingdom) and the effects of the diets were compared by using a paired Student’s t test. Changes in serum leptin during the 2 diets were compared by using GLM repeated-measures analysis (SPSS 9.0.0; SPSS Inc, Chicago). The effects of diet on REE at the end of treatment (mean of days 5 and 6) and the change in REE from baseline values were evaluated by using paired t tests. Results are reported as means (±SEMs).
RESULTS
Weight loss did not differ significantly between the 2 diets (3.62 ± 1.14 kg with the low-GI diet and 3.23 ± 0.92 kg with the high-GI diet), as shown in Figure 1. The mean area under the glycemic response curve was twice as large with the high-GI diet (2.69 ± 0.47 mmol · h/L) as with the low-GI diet (1.30 ± 0.19 mmol · h/L; P = 0.001). The mean area under the insulinemic response curve was nearly 50% larger with the high-GI diet (700 ± 98.4 pmol · h/L) than with the low-GI diet (478 ± 82.2 pmol · h/L; P = 0.01) (Figure 2).
FIGURE 1.

Mean (± SEM) weight loss from baseline during 6 d of energy restriction. Baseline weight for the high-glycemic-index diet (○) was 98.5 ± 2.7 kg and for the low-glycemic-index diet (◆) was 99.2 ± 2.9 kg (NS; n = 10).
FIGURE 2.

Glycemic (A) and insulinemic (B) responses measured at 0.5-h intervals. Curves are mean (± SEM) values after breakfast, lunch, and dinner on day 1. Columns represent area under the concentration-versus-time curve calculated by using the trapezoidal rule. Actual baseline blood glucose for the high-glycemic-index (high-GI) diet (○) was 5.5 ± 0.2 mmol/L and for the low-glycemic-index (low-GI) diet (◆) was 5.3 ± 0.2 mmol/L (NS; n = 10).
Serum leptin (Figure 3) decreased more rapidly and to a greater extent during the low-GI diet than during the high-GI diet (P = 0.03). By day 6, leptin had decreased by 50.0 ± 5.5% from baseline with the low-GI diet, compared with 38.3 ± 3.5% with the high-GI diet.
FIGURE 3.

Mean (± SEM) daily fasting serum leptin as a percentage of baseline values. Baseline serum leptin for the high-glycemic-index diet (○) was 14.9 ± 1.7 mg/L and for the low-glycemic-index diet was 13.4 ± 1.2 mg/L (NS; n = 10).
REE (Figure 4) decreased from baseline to the end of the period of energy restriction (mean of days 5 and 6) by 4.6% with the low-GI diet (P = 0.03) and by 10.5% with the high-GI diet (P = 0.005). Mean REE was lower on days 5 and 6 of the high-GI diet (7.38 ± 0.39 MJ/d) than on days 5 and 6 of the low-GI diet (7.78 ± 0.36 MJ/d; P = 0.04).
FIGURE 4.
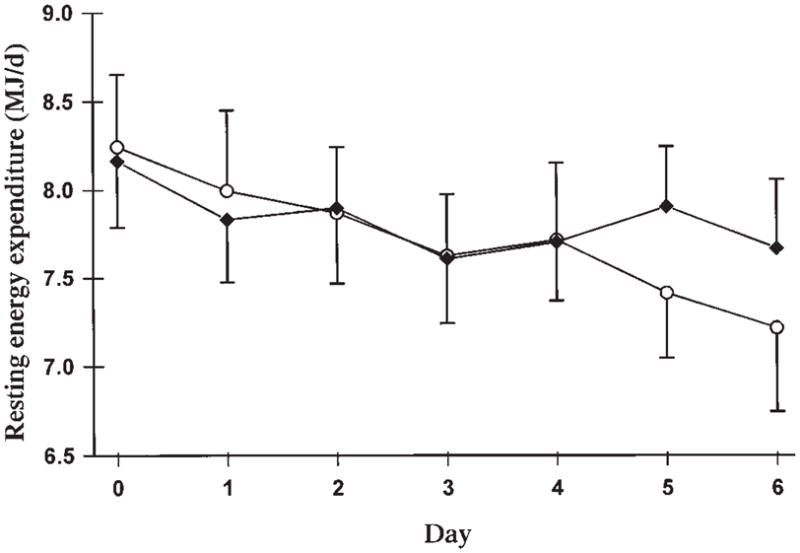
Mean (± SEM) daily resting energy expenditure with the high- (○) and low- (◆) glycemic-index diets (n = 10).
Nitrogen balance was positive with the low-GI diet and negative with the high-GI diet (25.7 ± 14.1 and −9.7 ± 5.5 mg N · kg−1 · d−1, respectively; P = 0.06).
Ad libitum food intake during days 7 and 8 was 25% greater with the high-GI diet (17.0 ± 2.2 MJ) than with the low-GI diet (13.5 ± 1.9 MJ; P = 0.009). Subject ratings of ad libitum food palatability did not differ significantly between diets (7.2 ± 0.8 with the high-GI diet and 6.3 ± 0.9 with the low-GI diet).
DISCUSSION
Conventional energy-restricted diets have very poor long-term outcomes with regard to weight loss (4), possibly because these diets elicit changes in hunger and metabolism that promote weight regain (5). The results of the present study suggest that dietary composition can modify the physiologic adaptations to energy restriction, which might have relevance to the design of novel dietary treatments for obesity.
Weight loss did not differ significantly between the high-GI diet and the low-GI diet, as would be expected from the identical energy contents of the diets. However, serum leptin decreased to a greater extent with the low-GI diet. This difference may be explained by the lower insulin concentrations associated with this diet, because insulin is a leptin secretagogue (31, 32), or by decreased adipocyte glucose metabolism (33). This observation is consistent with that of Jenkins et al (34), who showed a positive association between carbohydrate consumption and leptin concentration during energy restriction. Interestingly, the lower leptin concentration with the low-GI diet occurred without evidence of increased hunger (ad libitum food intake was actually lower with this diet), suggesting a functional improvement in the leptin resistance associated with obesity (35, 36). Further investigation into the significance of this phenomenon is warranted.
REE decreased to a lesser extent with the low-GI than with the high-GI diet. Consistent with this finding, Whitehead et al (37) showed that sleeping metabolic rate fell less rapidly with a high-protein than a low-protein energy-restricted diet. In the present study, the low-GI diet did contain more protein than did the high-GI diet. We note, however, that the present results were not caused by the increased thermic effect of protein relative to that of the other macronutrients because metabolic rate was measured 10 h after the last meal. The preservation of REE during energy restriction with the low-GI diet, together with the differences in voluntary food intake and satiety shown by us and others (21–26), suggests that low-GI diets may be better tolerated than high-GI diets.
Although both diets were protein sufficient (the average subject received 56 or 100 g protein/d), analysis of nitrogen balance suggested that fat tissue was oxidized to a lesser degree, and muscle to a greater degree, with the high-GI than the low-GI diet. This finding is consistent with that of Pasquali et al (38), who observed a more negative nitrogen balance with an isoenergetic, very-low-energy diet with a high carbohydrate-to-protein ratio than with a diet with a low carbohydrate-to-protein ratio. The possible adverse effects of the high-GI diet on body composition can be explained by hormonal responses to meals with different GIs (26). Consumption of a high-GI meal results in relatively high insulin concentrations and low glucagon concentrations. This hormonal response tends to promote uptake of glucose and triacylglycerol in the liver and adipose tissue, limit glycogenolysis and lipolysis, and, therefore, suppress concentrations of glucose and fatty acids in the postabsorptive period. The low circulating concentrations of these major metabolic fuels elicit marked increases in the counterregulatory hormones, some of which have proteolytic actions (39). Thus, decreased mobilization of the primary metabolic fuels with high-GI, energy-restricted diets may induce a series of physiologic events that favor catabolism of lean body tissue.
Two methodologic issues should be discussed. First, although the formula used for calculating nitrogen balance was validated across a variety of dietary conditions (30), the possibility remains that greater delivery of nutrients to the lower digestive tract with the low-GI than with the high-GI diet led to increased nitrogen trapping by colonic bacteria. If this were the case, we may have overestimated nitrogen balance with the low-GI diet. This possibility should be addressed in future studies. Second, previous studies by us and others sought to examine the hormonal and metabolic effects of dietary GI while controlling for other potentially confounding variables, such as macronutrient composition (21–26). However, GI is a complex dietary component that is affected by other factors, including protein and fat (15, 16, 20). Thus, one cannot simultaneously obtain maximum differences in GI and control for confounding variables. We chose to maximize differences between treatment groups because of the relative inaccuracy and imprecision of measuring metabolic rate compared with measuring hormone concentration. We believed that it would be difficult to show significant differences in resting metabolic rate in a relatively brief study using a small number of subjects without varying macronutrients. Therefore, our results cannot be definitively attributed solely to GI. Nevertheless, these results do suggest that the adaptations to energy restriction can be modified by dietary composition. Moreover, the findings are consistent with the possibility that the increased availability of metabolic fuels with a low-GI diet (26) improves tolerance to energy restriction.
In summary, this study showed beneficial effects of a low-GI, medium-fat diet compared with a high-GI, low-fat diet that accorded with current nutritional recommendations. This finding suggests that the hormonal and metabolic responses to energy restriction—involving leptin concentrations, energy expenditure, voluntary food intake, and nitrogen balance—can be affected by dietary composition. Additional research is needed to confirm these results in other populations and over a longer period, to determine which specific dietary factors mediate these physiologic events, and to examine the long-term effects of GI on the regulation of body weight.
Acknowledgments
We thank the GCRC nursing staff at Children’s Hospital, Boston; the staff of the metabolic kitchen at Brigham and Women’s Hospital, Boston; and Kate Donovan, without whom the study would not have been possible.
Supported by grants from the Charles H Hood Foundation, the Endocrine Fellows Foundation, Knoll Pharmaceutical Company, the General Clinical Research Center (M01 RR02172, M01 RR02635), and the National Institute of Diabetes and Digestive and Kidney Diseases (to DSL; 1K08 DK02440).
References
- 1.Troiano RP, Flegal KM. Overweight children and adolescents: description, epidemiology, and demographics. Pediatrics. 1998;101:497–504. [PubMed] [Google Scholar]
- 2.Kuczmarski RJ, Carroll MD, Flegal KM, Troiano RP. Varying body mass index cutoff points to describe overweight prevalence among U.S. adults: NHANES III (1988 to 1994) Obes Res. 1997;5:542–8. doi: 10.1002/j.1550-8528.1997.tb00575.x. [DOI] [PubMed] [Google Scholar]
- 3.Wolf AM, Colditz GA. Current estimates of the economic cost of obesity in the United States. Obes Res. 1998;6:97–106. doi: 10.1002/j.1550-8528.1998.tb00322.x. [DOI] [PubMed] [Google Scholar]
- 4.NIH Technology Assessment Conference Panel. Consensus Development Conference, 30 March to 1 April 1992. Methods for voluntary weight loss and control. Ann Intern Med. 1993;119:764–70. [PubMed] [Google Scholar]
- 5.Leibel RL, Rosenbaum M, Hirsch J. Changes in energy expenditure resulting from altered body weight. N Engl J Med. 1995;332:621–8. doi: 10.1056/NEJM199503093321001. [DOI] [PubMed] [Google Scholar]
- 6.Rosenbaum M, Ravussin E, Matthews DE, et al. A comparative study of different means of assessing long-term energy expenditure in humans. Am J Physiol. 1996;270:R496–504. doi: 10.1152/ajpregu.1996.270.3.R496. [DOI] [PubMed] [Google Scholar]
- 7.Valtuena S, Blanch S, Barenys M, Sola R, Salas-Salvado J. Changes in body composition and resting energy expenditure after rapid weight loss: is there an energy-metabolism adaptation in obese patients? Int J Obes Relat Metab Disord. 1995;19:119–25. [PubMed] [Google Scholar]
- 8.Velthuiste Wierik EJ, Westerterp KR, van den Berg H. Impact of a moderately energy-restricted diet on energy metabolism and body composition in non-obese men. Int J Obes Relat Metab Disord. 1995;19:318–24. [PubMed] [Google Scholar]
- 9.Kibanski A, Beitins IZ, Badger T, Little R, McCarthur JW. Reproductive function during fasting in men. J Clin Endocrinol Metab. 1981;53:258–63. doi: 10.1210/jcem-53-2-258. [DOI] [PubMed] [Google Scholar]
- 10.Fichter MM, Pirke KM, Holsboer F. Weight loss causes neuroendocrine disturbances: experimental study in healthy starving subjects. Psychiatry Res. 1986;17:61–72. doi: 10.1016/0165-1781(86)90042-9. [DOI] [PubMed] [Google Scholar]
- 11.Vagenakis AG, Burger A, Portnary GI, et al. Diversion of peripheral thyroxine metabolism from activating to inactivating pathways during complete fasting. J Clin Endocrinol Metab. 1975;41:191–4. doi: 10.1210/jcem-41-1-191. [DOI] [PubMed] [Google Scholar]
- 12.Jung RT, Shetty PS, James WP. Nutritional effects on thyroid and catecholamine metabolism. Clin Sci. 1980;58:183–91. doi: 10.1042/cs0580183. [DOI] [PubMed] [Google Scholar]
- 13.Rosenbaum M, Leibel RL, Hirsch J. Obesity. N Engl J Med. 1997;337:396–407. doi: 10.1056/NEJM199708073370606. [DOI] [PubMed] [Google Scholar]
- 14.Kuczmarski RJ, Flegal KM, Campbell SM, Johnson CL. Increasing prevalence of overweight among US adults. The National Health and Nutrition Examination Surveys, 1960 to 1991. JAMA. 1994;272:205–11. doi: 10.1001/jama.272.3.205. [DOI] [PubMed] [Google Scholar]
- 15.Wolever TM, Jenkins DJ, Jenkins AL, Josse RG. The glycemic index: methodology and clinical implications. Am J Clin Nutr. 1991;54:846–54. doi: 10.1093/ajcn/54.5.846. [DOI] [PubMed] [Google Scholar]
- 16.Foster-Powell K, Miller JB. International tables of glycemic index. Am J Clin Nutr. 1995;62(suppl):871S–93S. doi: 10.1093/ajcn/62.4.871S. [DOI] [PubMed] [Google Scholar]
- 17.Jenkins DJ, Ghafari H, Wolever TM, et al. Relationship between rate of digestion of foods and post-prandial glycaemia. Diabetologia. 1982;22:450–5. doi: 10.1007/BF00282589. [DOI] [PubMed] [Google Scholar]
- 18.Bjorck I, Granfeldt Y, Liljeberg H, Tovar J, Asp NG. Food properties affecting the digestion and absorption of carbohydrates. Am J Clin Nutr. 1994;59(suppl):699S–705S. doi: 10.1093/ajcn/59.3.699S. [DOI] [PubMed] [Google Scholar]
- 19.Granfeldt Y, Hagander B, Bjorck I. Metabolic responses to starch in oat and wheat products. On the importance of food structure, incomplete gelatinization or presence of viscous dietary fibre. Eur J Clin Nutr. 1995;49:189–99. [PubMed] [Google Scholar]
- 20.Welch IM, Bruce C, Hill SE, Read NW. Duodenal and ileal lipid suppresses postprandial blood glucose and insulin responses in man: possible implications for the dietary management of diabetes mellitus. Clin Sci. 1987;72:209–16. doi: 10.1042/cs0720209. [DOI] [PubMed] [Google Scholar]
- 21.Haber GB, Heaton KW, Murphy D, Burroughs LF. Depletion and disruption of dietary fibre. Effects on satiety, plasma-glucose, and serum-insulin. Lancet. 1977;2:679–82. doi: 10.1016/s0140-6736(77)90494-9. [DOI] [PubMed] [Google Scholar]
- 22.Holt S, Brand J, Soveny C, Hansky J. Relationship of satiety to postprandial glycaemic, insulin and cholecystokinin responses. Appetite. 1992;18:129–41. doi: 10.1016/0195-6663(92)90190-h. [DOI] [PubMed] [Google Scholar]
- 23.van Amelsvoort JM, Weststrate JA. Amylose-amylopectin ratio in a meal affects postprandial variables in male volunteers. Am J Clin Nutr. 1992;55:712–8. doi: 10.1093/ajcn/55.3.712. [DOI] [PubMed] [Google Scholar]
- 24.Leathwood P, Pollet P. Effects of slow release carbohydrates in the form of bean flakes on the evolution of hunger and satiety in man. Appetite. 1988;10:1–11. doi: 10.1016/s0195-6663(88)80028-x. [DOI] [PubMed] [Google Scholar]
- 25.Rodin J, Reed D, Jamner L. Metabolic effects of fructose and glucose: implications for food intake. Am J Clin Nutr. 1988;47:683–9. doi: 10.1093/ajcn/47.4.683. [DOI] [PubMed] [Google Scholar]
- 26.Ludwig DS, Majzoub JA, Al-Zahrani A, Dallal GE, Blanco I, Roberts SB. High glycemic index foods, overeating, and obesity. Pediatrics. 1999;103:E261–6. doi: 10.1542/peds.103.3.e26. [DOI] [PubMed] [Google Scholar]
- 27.Slabber M, Barnard HC, Kuyl JM, Dannhauser A, Schall R. Effects of a low-insulin-response, energy-restricted diet on weight loss and plasma insulin concentrations in hyperinsulinemic obese females. Am J Clin Nutr. 1994;60:48–53. doi: 10.1093/ajcn/60.1.48. [DOI] [PubMed] [Google Scholar]
- 28.Pellett PL. Food energy requirements in humans. Am J Clin Nutr. 1990;51:711–22. doi: 10.1093/ajcn/51.5.711. [DOI] [PubMed] [Google Scholar]
- 29.Munro HN. Analysis of tissues and body fluids for nitrogenous constituents. In: Munro HN, editor. Mammalian protein metabolism. New York: Academic Press; 1969. p. 435. [Google Scholar]
- 30.FAO/WHO/UNU Expert Consultation. Energy and protein requirements. World Health Organ Tech Rep Ser. 1985;724:1–206. [PubMed] [Google Scholar]
- 31.Sivitz WI, Walsh S, Morgan D, Donohoue P, Haynes W, Leibel RL. Plasma leptin in diabetic and insulin-treated diabetic and normal rats. Metabolism. 1998;47:584–91. doi: 10.1016/s0026-0495(98)90244-x. [DOI] [PubMed] [Google Scholar]
- 32.Saladin R, De Vos P, Guerre-Millo M, et al. Transient increase in obese gene expression after food intake or insulin administration. Nature. 1995;377:527–9. doi: 10.1038/377527a0. [DOI] [PubMed] [Google Scholar]
- 33.Wang J, Liu R, Hawkins M, Barzilai N, Rossetti L. A nutrient-sensing pathway regulates leptin gene expression in muscle and fat. Nature. 1998;393:684–8. doi: 10.1038/31474. [DOI] [PubMed] [Google Scholar]
- 34.Jenkins AB, Markovic TP, Fleury A, Campbell LV. Carbohydrate intake and short-term regulation of leptin in humans. Diabetologia. 1997;40:348–51. doi: 10.1007/s001250050686. [DOI] [PubMed] [Google Scholar]
- 35.Caprio S, Tamborlane WV, Silver D, et al. Hyperleptinemia: an early sign of juvenile obesity. Relations to body fat depots and insulin concentrations. Am J Physiol. 1996;271:E626–30. doi: 10.1152/ajpendo.1996.271.3.E626. [DOI] [PubMed] [Google Scholar]
- 36.Caro JF, Kolaczynski JW, Nyce MR, et al. Decreased cerebrospinal-fluid/serum leptin ratio in obesity: a possible mechanism for leptin resistance. Lancet. 1996;348:159–61. doi: 10.1016/s0140-6736(96)03173-x. [DOI] [PubMed] [Google Scholar]
- 37.Whitehead JM, McNeill G, Smith JS. The effect of protein intake on 24-h energy expenditure during energy restriction. Int J Obes Relat Metab Disord. 1996;20:727–32. [PubMed] [Google Scholar]
- 38.Pasquali R, Casimirri F, Melchionda N. Protein metabolism in obese patients during very low-calorie mixed diets containing different amounts of proteins and carbohydrates. Metabolism. 1987;36:1141–8. doi: 10.1016/0026-0495(87)90240-x. [DOI] [PubMed] [Google Scholar]
- 39.Gelfand RA, Matthews DE, Bier DM, Sherwin RS. Role of counterregulatory hormones in the catabolic response to stress. J Clin Invest. 1984;74:2238–48. doi: 10.1172/JCI111650. [DOI] [PMC free article] [PubMed] [Google Scholar]