

Abstract
We performed a proteomic investigation on primary cultures of neonatal rat cardiomyocytes after treatment with 10 nM endothelin-1 (ET1) for 48 h, an in vitro model for cardiac hypertrophy. Two-dimensional gel electrophoresis profiles of cell lysates were compared after colloidal Coomassie Blue staining. 12 protein spots that significantly changed in density due to ET1 stimulation were selected for in-gel digestion and identified through mass spectrometry. Of these, 8 spots were increased and 4 were decreased. Four of the increased proteins were identified as desmin, the cardiac component of intermediate filaments and one as α-B-crystallin, a molecular chaperone that binds desmin. All the desmins increased 2- to 5-fold, and α-B-crystallin increased 2-fold after ET1 treatment. Desmin cytoskeleton has been implicated in the regulation of mitochondrial activity and distribution, as well as in the formation of amyloid bodies. Mitochondria-specific fluorescent probe MitoTracker indicated mitochondrial redistribution in hypertrophic cells. An increase of amyloid aggregates containing desmin upon treatment with ET1 was detected by filter assay. Of the four proteins that showed decreased abundance after ET1 treatment, the chaperones hsp60 and grp75 were decreased 13- and 9-fold, respectively. In conclusion, proteomic profiling of ET1-stimulated rat neonatal cardiomyocytes reveals specific changes in cardiac molecular phenotype mainly involving intermediate filament and molecular chaperone proteins.
Keywords: Endothelin, Hypertrophy, Proteomics, Desmin, Mitochondria
1. Introduction
Various common cardiovascular diseases, such as ischemic heart disease, hypertension and valve defects result in increased cardiac workload and/or impaired mechanical performance, leading to hypertrophy [1,2]. It has become evident that not only mechanical stress but also locally produced (neuro)hormones – such as noradrenaline, angiotensin II, endothelin-1 (ET1) and growth factors – contribute to the initial development of cardiac hypertrophy. Although cardiac hypertrophy at initial stages is considered to be compensatory in nature, the hypertrophied heart eventually decompensates and ultimately goes into failure [1-4]. The molecular processes involved in the transition from hypertrophy to failure are still poorly understood [5]. Changes in cardiac phenotype, i.e. quantitative (amount) and qualitative [isoform and post-translational modifications (PTMs)] variations in the protein expression profile, are believed to be associated with the deterioration of cardiac function. Like other hypertrophic stimuli, such as angiotensin II and α1-adrenergic agonists, ET1 has potent effects on signaling pathways that depend on both Ca2+ and hydrolysis of membrane phospholipids [6]. In addition, ET1 activates tyrosine kinases and mitogen-activated protein kinases, signaling pathways known to regulate cell growth [7]. Increased levels of plasma ET1 have been observed in several cardiovascular diseases such as acute myocardial infarction, chronically increased workload and heart failure [8].
Previously, we and many other groups demonstrated that the primary culture of rat neonatal cardiomyocytes, as far as the signaling reactions and characteristic phenotypic changes are concerned, responds to the various hypertrophic stimuli (angiotensin II, ET1, noradrenaline, leukemia inhibitory factor, etc) in a manner very similar to the in vivo situation [3,5,7,9]. Moreover, cell cultures offer different advantages when one tries to dissect phenotype changes through a proteomic approach, such as: homogenous cell population, enrichment of cardiac myocyte-specific protein, improved reproducibility, etc. Therefore we performed a global two-dimensional gel electrophoresis (2DE)-based proteomic analysis of ET1-stimulated rat neonatal cardiomyocytes to track changes in protein expression and their PTMs during the development of cardiomyocyte hypertrophy. Here we show that a cluster of post-translationally modified desmin species and α-B-crystallin (CryAB) are among the cardiomyocyte proteins found to be increased upon ET1 stimulation. Recent literature highlights the concerted role of intermediate filament and chaperone proteins, and mitochondria in the etiopathology of diverse cardiomyopathies. [10-12]. Therefore the cellular localization of desmin and mitochondria in control and ET1-stimulated cardiomyocytes using a monoclonal antibody against desmin and the specific mitochondrial fluorescent probe, MitoTracker (MT), respectively, is also presented. Finally, the presence of desmin-immunopositive amyloid-like aggregates is also quantified since it may indicate the induction of a maladaptive phenotype already at the early stages of hypertrophy.
2. Materials and methods
2.1. Reagents
ET-1 (human/porcine sequence), and DE-U-10 mouse anti-desmin antibody, were obtained from Sigma (St Louis, MO, USA), and MitoTracker Red CM-H2XRos from Molecular Probes (Eugene, OR, USA). Culture dishes were obtained from Becton Dickinson (Franklin Lakes, NJ, USA). Culture medium M199 and DMEM were obtained from Gibco BRL (UK) while fetal calf and horse serum (FCS and HS respectively) from Boehringer Ingelheim (D) were used. 30% Acrylamide/Bis Solution, 37.5:1 (2.6% C), mineral oil, iodoacetamide (IAA) and Biolytes were from Bio-Rad Laboratories (Hercules, CA, USA). Immobiline DryStrip pH 3–10 NL, 18 cm and 24 cm, electrode paper wicks and L-[4,5-3H]-leucine (54 Ci/mmol) were from Amersham (UK). Complete protease inhibitor cocktail tablets were purchased from Roche Diagnostic (IN, USA). All other reagents were from Sigma (St Louis, MO, USA).
2.2. Cell culture
The investigation conforms to the Guide for the Care and Use of Laboratory Animals published by the US National Institute of Health (NIH Publication No 85–23, revised 1996). Primary cultures of neonatal cardiomyocytes were prepared as described previously [6,7,13-15] with slight protocol modifications. Briefly, cultures were obtained from 1–2 day-old Wistar rats. Cardiomyocyte to non-cardiomyocyte ratio was increased by preplating. Cells were seeded in 6 cm diameter dishes (1,25 × 10⁵ cells/cm2 for 2-DE analysis) and 4-well multiplates (3 × 10⁴ cells/cm2 for immunocytochemistry). For the latter assay sterile glass coverslips were placed inside each well prior to cell seeding. Cells were cultured in complete HEPES buffered medium (DMEM/M199) (4:1) supplemented with 100 U/ml penicillin, 100 μg/ml streptomycin, 5% FCS and 5% HS and maintained at 37 °C and 5% CO2. After 24 h serum content was decreased to 4% HS. Cardiomyocytes formed a confluent monolayer of spontaneously contracting cells 24 h after plating. The day prior to ET1 treatment cells were cultured in serum-free medium (SFM) to prevent the effect of serum growth factors. ET1 was diluted in SFM (10−6 M), sterilized with a 0.22 μm porosity filter and kept at −20 °C (stock solution). ET1 stock solution was diluted 100-fold (final concentration 10 nM) in SFM immediately before addition to the cell cultures and incubation was continued for 48 h.
2.3. Biochemical parameters for hypertrophy
3H-leucine incorporation and protein/DNA ratio were measured as previously described [6,7]. Briefly, after washing the cells with phosphate-buffered saline (PBS), protein and DNA content of cardiomyocytes were determined in lysates prepared by dissolving the cells in 1 N NaOH for 16 h at 4 °C. Protein concentration was determined using the Bradford assay, while DNA concentration was measured fluorimetrically with 4,6-diamine-2-phenylindol-dihydrochloride [6,7]. Protein synthesis was quantified by pulse-labelling of cardiomyocytes with 2 μCi/ml 3H-leucine for the last 2 h of the 48 h incubation either in the absence or presence of ET1. After washing with PBS to remove extracellular free label, the cells were lysed and the protein was precipitated and washed three times in 10% TCA for 10 min to remove any remaining unincorporated 3H-leucine. The protein was subsequently dissolved in 1 N NaOH for 16 h at 4 °C, and the incorporated 3H-leucine was quantified by liquid scintillation counting.
2.4. Immunocytochemistry
MT (dissolved in DMSO) was added (final concentration 1 μM) to ET1-stimulated and control cells 30 min before ending ET1 treatment. Wells were then washed twice with cold PBS and the cells were immediately fixed with 3% paraformaldehyde for 20 min in the dark at room temperature (RT). Cells were permeabilized using 0.3% Triton X-100 in PBS after fixation. Desmin was stained using a mouse anti-desmin antibody (DE-U-10, Sigma, MO, USA, 1:60) followed by a Cy3-conjugated anti-mouse antibody (Sigma, MO, USA, 1:1000). A phalloidin–fluorescein isothiocyanate (FITC–phalloidin) 33.3 μg/ml solution was diluted in PBS (1:200) and added to the cells for 1 1 h at RT. Coverslips were then mounted on microscope slides by means of Vectashield Mounting Medium (Vector Laboratories, CA, USA) and sealed using nail polish. Pictures of MT and anti-desmin staining were obtained using an Olympus IX50 inverted microscope equipped with a Cy3 filter and an Olympus C3030 digital camera. 1000× magnification was reached using oil-immersion microscopy. Pictures of FITC–phalloidin staining were obtained with a FITC filter and 400× magnification.
2.5. Two-dimensional electrophoresis, gel-imaging, matching and quantification
After 48 h incubation, ET1-stimulated and control cells were washed twice with cold PBS and twice with 10 mM Tris–HCl/250 mM sucrose pH 7.4 to remove salts. Cells were then lysed directly in 800 μl rehydration buffer (5 M urea, 2 M thiourea, 0.25% CHAPS, 0.8% Triton X-100, 10% isopropanol, 12.5% water saturated isobutanol, 5% glycerol, 1% DTT, protease inhibitor cocktail Complete and Biolytes according to supplier instructions). After 1 h incubation at RT, lysed cells were flash frozen in liquid N2 and stored at −80 °C.
After thawing, samples were clarified by centrifugation (18,000 rcf, 15 min, 4 °C) and aliquots of 350 μl of the supernatant (approx. 600 μg protein) were loaded into the isoelectric focusing (IEF) tray lanes. After placing electrode paper wicks on the IEF tray electrodes the 18 cm-long IPG strips were placed gel side-down and sealed with 3 ml mineral oil. First dimension electrophoresis started with rehydration under voltage (50 V) for 10 h. Separation protocol was designed as follows: 250 V (1 h), 500 V (1 h), linear gradient to 8000 V (10 h), 8000 V till total 50,000 Vh, using an IEF Protean apparatus (Bio-Rad, CA, USA).
After reduction and alkylation, by 1% DTT and 2.5% iodoacetamide respectively, strips were loaded onto 20 cm long gel slabs and second dimension electrophoresis was performed at 25 mA/gel for 6–7 h. After fixing (40% ethanol, 10% acetic acid, in water) gel slabs were stained with freshly prepared colloidal Coomassie Blue stain (34% methanol, 12% ammonium sulphate, 2% ortho-phosphoric acid, 0.066% Coomassie Blue G-250, in water). Gel images were acquired with a calibrated GS-800 scanner and differential display analysis was performed using PD-QUEST 7.1 (Bio-Rad, CA, USA). Density values were normalized by the software on the basis of total density in valid spots. Spots of interest were then excised from gel, destained and in-gel digested with trypsin. Digested samples were used for MALDI-TOF-MS analysis and, when appropriate, LC–ESI-Q-TOF-MS/MS analysis (described below).
2.6. Immunoblotting analysis
For 2D immunoblotting, aliquots of 450 μl (750 μg protein) from the supernatants (see above) of ET1-treated and control cells were loaded onto 24 cm-long IPG strips. After separation by means of an IPGphor cell (Amersham, UK) a 10.5 cm portion at the cathodic side was cut off as well as a 3 cm portion at the acidic end of the strip. The remaining 7.5 cm-long strips were loaded on top of small gel slabs 8 × 7 cm in size. Proteins were separated in 12% acrylamide gels in a Mini-Protean II device (Bio-Rad, CA, USA) applying 400 mA for 1 h and then electrophoretically transferred to supported nitrocellulose membranes at 100 V for 1 h. Non-specific binding to the membrane was blocked by incubating in TBS/Tween (Tris-buffered saline/0.02% Tween-20, pH 8.0) containing 5% non-fat dried milk for 1 h at RT. Nitrocellulose membranes were then incubated overnight at 4 °C with mouse monoclonal anti-desmin antibody (DE-U-10, Sigma, MO, USA) 1:2500. Blots were washed with TBS/Tween and incubated for 1 h at room temperature with anti-mouse IgG conjugated to horseradish peroxidase (Santa Cruz Biotechnology, CA, USA) 1:2500 diluted in TBS/Tween containing 5% non-fat dried milk. Membranes were washed with TBS/Tween and probed western Blotting Luminol Reagent (Santa Cruz Biotechnology, CA, USA). Luminescence was captured on X-ray films. A GS-800 (Bio-Rad, CA, USA) scanner was used to acquire the film images.
2.7. In-gel protein digestion and peptide identification
Spots of interest were picked out from the gels with a shortened pipette tip, placed in a 96-well low binding plate (Nunc) and destained by using a 50 mM NH4HCO3 in bi-distilled water/acetonitrile (1:3 v/v) solution under shaking for two 20 min runs. After a further washing with bi-distilled water, gel plugs were dried by means of a Vacuspeed lyophilizer and rehydrated directly in 4 μl of0.1μg/μl trypsin in 3 mM Tris–HCl pH 8.8 solution (Trypsin ultra grade sequencing grade, Promega, WI, USA). Digestion was performed overnight at RT. Peptides were extracted in 7 μl of 0.1% TFA/ACN (1/2 v/v) solution. 0.5 μl of this peptide solution was mixed with 0.5 μl of 0.2% (w/v) of alpha-cyano-cinnamic acid directly onto a MALDI anchorchip plate and allowed to air-dry. Peptide map fingerprints (PMFs) were obtained using a BIFLEX-III MALDI-TOF-MS (Bruker Daltonics, MA, USA). The PMFs derived from each gel plug were analyzed using the MASCOT search engine (www.matrixscience.com) against the NCBI protein database. Protein search was performed assuming maximally 1 missed cleavage, variable methionine oxidation, carbamidomethylation of cystein, 100 ppm tolerance and Rattus norvegicus as taxonomy category. Only protein identifications with a significant MOWSE score were considered.
2.8. LC–ESI-Q-TOF-MS/MS
In order to obtain sequence information on peptide fragments, protein digests were analyzed by nanoflow LC–MS/MS by using an electrospray ionisation-quadrupole/time-of-flight mass spectrometer (Q-Tof Ultima, Waters, Manchester, U.K.) operating in positive mode. A nanoLC system (CapLC, Waters, Manchester, U.K.) was coupled to the Q-Tof Ultima. Peptide mixtures were delivered to the system by using the CapLC autosampler at 5 μl/min and were trapped on a μ-precolumn (Pepmap C18, 5mm*300 μm ID, LC Packings, Amsterdam, The Netherlands). After flow splitting down to 200 nl/min, peptides were transferred to the analytical column (Pepmap C18, 15 cm*75 μm ID, LC Packings). Peptides were eluted using an acetonitrile gradient. Fragmentation was performed in data-dependent mode, and mass spectra were acquired in continuum mode. Database searches were performed using MASCOT against the NCBI protein database.
2.9. Amyloid-like aggregates detection assay
A filter assay to detect the presence of amyloid bodies was performed essentially as described by Sanbe and collegues [10,16] with minor protocol modifications. Briefly 0.2 μm cut-off nitrocellulose membrane was used as a filter (filter assay). After solubilization under proper condition, the samples were filtered through the membrane by means of a dot blot apparatus. Amyloid-like aggregates captured by the membrane were probed with specific antibodies as described for western blot analyses. Anti-desmin (DE-U-10, monoclonal, Sigma) and anti-troponin I (8I/7, monoclonal, Spectral Diagostic) antibodies were used to detect the presence of desmin in the aggregates and rule out non-specific protein interaction with the membrane, respectively. Optimal protein concentration was found to be in the 31.2–15.6 ng/μl range. Membranes were also stained with the Direct Blue 71 (DB71, Sigma) protein stain to confirm equal protein load among different wells.
2.10. Statistical analysis
Statistical analysis of differential protein display was performed from replicate gels of different batches of primary cardiomyocytes (n≥4) using Student’s t-test at 95% (p≤0.05) of probability run by PDQUEST, densitometry results were also analyzed by means of Excel Student’s t-test decreasing the probability to 99.5% (p≤0.005). All experiments were performed at least three times. Significance of Protein/DNA ratio, 3H-Leucine incorporation and filter assay density data differences were also analyzed by Student’s t-test and standard deviation calculated assuming uncertain error propagation.
3. Results
3.1. Characterization of the in vitro model of hypertrophy
During hypertrophic cellular growth total protein is expected to increase while total DNA should remain constant. Indeed, protein/DNA ratio was previously shown to be a valid marker of the degree of hypertrophy after long-term (24–48 h) ET1 stimulation of cultured cardiomyocytes [6,9,15]. A similar increase in protein/DNA ratio was found in the present study using 48 h incubation with 10 nM ET1 (Fig. 1A). Likewise, the rate of 3H-leucine incorporation into total protein increased by exposure to ET1 (Fig. 1B), which is also consistent with previous observations [6,9,15]. Moreover, changes at the mRNA level such as upregulation of ANF and downregulation of SERCA2, which are characteristic for cardiac hypertrophy in vivo, were observed [not shown, see e.g. [6]]. Therefore, treatment of cell cultures for 48 h with 10 nM ET1 is a sufficient and yet effective stimulus for induction of a measurable hypertrophic response in a way very similar to the in vivo situation as has also been documented in the above mentioned studies. The hypertrophic response also resulted in mild morphologic changes such as a slight increase in cell length and a rearrangement of cell clustering (Fig. 1 panels C and D). As shown in Fig. 1, ET1-stimulated cells (panel D) formed “star-shaped” three-dimensional aggregates with respect to the scattered phenotype observed in control cultures (panel C).
Fig. 1.

Hypertrophic response of cardiomyocytes to ET-1. Protein/DNA ratio (A), 3H-leucine incorporation (B), and morphology of the cardiomyocytes after 48 h incubation without (C) or with ET-1 (D) were determined. Data plotted in A and B were obtained from various experiments (n ≥ 3), the values normalized as percentages of average control values (±SEM). A significant increase of protein/DNA ratio (60 ± 10%, mean ± SEM) by ET1 was observed (A). A similar increase in 3H-leucine incorporation (74 ± 14%, mean ± SEM) was seen by ET1 (B). Photographs of fixed cells stained with FITC–phalloidin were taken by means of an epifluorescence microscope (Olympus IX50) using a FITC filter. Control cells are shown in panel C whereas cells stimulated with 10 nM ET1 are shown in panel D. After ET1 stimulation cells appeared to show a slight increase in cell size together with different “star-shaped” arrangement of cell clusters.
3.2. Proteomic profiling of ET1-stimulated versus control cells
Protein extracts were prepared from control and ET1-stimulated cells (n≥4) and separated on 2DE gels. Colloidal Coomassie Blue staining revealed a total of about 200 well-defined spots. 2DE gel images were acquired and statistical analysis was performed on classes of replicates. Significant changes in the optical density of 12 spots were detected by PDQUEST image analysis software. These spots are indicated by arbitrarily assigned spot numbers in Fig. 2. Four out of the 12 differentially displayed spots, in the region indicated by the small box in Fig. 2, and enlarged in panels B and C, were identified as desmin (DESM_RAT, Desmin – Rattus norvegicus) by means of MALDI-TOF-MS (Table 1). Comparison of Fig. 2B and C illustrates representative differences in spot densities between control and ET1-stimulated cardiomyocyte protein extracts. The four desmin spots all increased by ET1 treatment, the fold changes ranging from 2- to 5-fold (Table 1). The highest fold change was observed with the lower mass desmin species (spot 1 and 2, 4- and 5-fold respectively). The apparent deviations in location on 2-D gel from the theoretical pI (5.21) and Mw (53.3 kDa) of the desmin spots both in ET1-stimulated and control cells may be indicative of cleaved forms or other type of PTMs. Spot 12 is identified as CryAB, which undergoes a 2-fold increase upon ET1 treatment (Table 1). Three other proteins were up-regulated (spots 6, 7 and 8), but the changes in the expression are less than 2-fold. These include tropomyosin 4, tropomyosin 1 alpha-chain and vimentin. Four proteins were dramatically downregulated in ET1-stimulated cardiomyocytes (Fig. 3 and Table 1). These are calumenin (4-fold), thiol-specific antioxidant (3-fold), Hsp60 (13-fold) and DNA K-type molecular chaperone precursor (grp75, 9-fold). Relative optical densities in parts per million (ppm) are plotted in Fig. 3 together with representative spot images (each centered at the relative spot), for each of the 12 spots.
Fig. 2.

2DE gel-based proteomic profile of control cardiomyocytes. A representative image of colloidal Coomassie Blue-stained 2DE gel (18 × 20 cm) is shown (A). Proteins of which the quantity is changed in ET1-stimulated cultures relative to control cultures are encircled and marked by a number assigned on the basis of direction (+/−) and –fold (n) changes (1–12). Differential display analysis is derived from statistical variation of spot density between classes of gels (n=4). The squared box highlights the “desmin area”. The same area is magnified in panels B and C from representative gel images obtained from control (B) and hypertrophic (C) cell lysates. Refer to Table 1 for spot description.
Table 1.
Differential display analysis of ET1-stimulated versus control cardiomyocytes
| Spot | ID | Mowse score |
Sequence coverage % |
Accession number | Protein name | Observed pI/Mr (kDa) |
Theoretical pI/Mw (kDa) |
C AU±SD# | ET AU±SD# | p value | Fold change* |
|---|---|---|---|---|---|---|---|---|---|---|---|
| 1 | AAH61872 | 128 | 31 | AAH61872 [gi:38197676] | Desmin | 4.87/45.3 | 5.21/53.4 | 3851±1107 | 19374±4572 | 0.0005 | +5.0 |
| 2 | AAH61872 | 219 | 45 | AAH61872 [gi:38197676] | Desmin | 4.93/45.9 | 5.21/53.4 | 4909±1774 | 19442±7379 | 0.0056 | +4.0 |
| 3 | AAH61872 | 219 | 44 | AAH61872 [gi:38197676] | Desmin | 5.0/47.0 | 5.21/53.4 | 2720±1109 | 7551±2675 | 0.0103 | +2.8 |
| 4 | AAH61872 | 154 | 39 | AAH61872 [gi:38197676] | Desmin | 5.1/47.4 | 5.21/53.4 | 4279±1075 | 8465±2581 | 0.0152 | +2.0 |
| 5 | CAA42911 | 64 | 25 | CAA42911 [gi:57580] | α-B-crystallin | 6.9/19.7 | 6.84/20.1 | 28271±3165 | 55168±5393 | 0.0002 | +1.9 |
| 6 | VIME_RAT | 102 | 22 | CAA44722 [gi:57480] | Vimentin | 4.7/45.4 | 5.06/53.6 | 8086±459 | 14343±666 | 1.35E-05 | +1.8 |
| 7 | AAA21801 | 140 | 37 | P04692 [gi:92090646] | Tropomyosin 1 α-chain | 4.7/32.7 | 4.71/32.7 | 49036±5867 | 78413±6432 | 0.0007 | +1.6 |
| 8 | S10623 | 111 | 27 | AAA42291 [gi:207504] | Tropomyosin 4 | 4.6/28.6 | 4.66/28.5 | 12416±2370 | 17190±1510 | 0.0147 | +1.4 |
| 9 | CAA37654 | 70 | 23 | CAA37654 [gi:1334284] | 60 kDa HSP, mitochondrial | 5.3/52.1 | 5.35/57.9 | 5616±2518 | 420±374 | 0.0090 | −13.4 |
| 10 | I56581 | 143 | 30 | AAB34982 [gi:1000439] | grp75 | 5.4/72.2 | 5.87/73.7 | 4065±1995 | 453±773 | 0.0156 | −9.0 |
| 11 | CAA05100 | 61 | 26 | O35783 [gi:30315806] | Calumenin | 4.4/46.5 | 4.40/37.0 | 4332±1914 | 1109±802 | 0.0216 | −3.9 |
| 12 | A57716 | 56 | 27 | AAA19959 [gi:514254] | Thiol-specific antioxidant | 5.1/20.5 | 5.34/21.8 | 6634±545 | 2224±1501 | 0.0013 | −3.0 |
means arbitrary units±standard deviation;
fold change is expressed as the ratio between mean highest and mean lowest protein expression level;
+ and − sign indicates that ET>C and C>ET, respectively.
Fig. 3.

Graphical illustration of the quantitative protein changes in control versus ET1-stimulated cells. Results of statistical analysis (p<0.05) for spot density variation in ET1-stimulated cells with relative to control cells are plotted. Numeric values are reported in Table 1. Representative spot images are shown each on top of the relative bar and encircled when accompanied by other spots present in the same gel area.
3.3. Validation of desmin identity and quantitative changes
Desmin identity was further confirmed by sequence analysis of fragment peptides by LC–ESI-Q-TOF-MS/MS. Fig. 4A shows an example of a secondary fragmentation MS spectrum of a peptide chosen from the tryptic peptides detected by the primary MS run in the desmin spot 1. Immunoblot analysis was performed on the indicated 2DE-gel area using a monoclonal anti-desmin antibody (Fig. 4B and C). These results further substantiate the conclusions drawn from the differential display of the Coomassie Blue-stained spots on 2DE. The immunoblot analysis showed four desmin species in the same pI and Mr range as the Coomassie Blue-stained 2DE gels and that all of these are markedly increased after ET1 stimulation. A Coomassie stained 1D gel is also presented (Fig. 4D) showing equal protein load together with the 1D immunoblotting analysis for desmin. The increased abundance of desmin was confirmed together with the presence of a lighter band after ET1 treatment.
Fig. 4.

Desmin identity and changes validation. A representative fragmentation spectrum (tandem MS) of the peptide FLEQNAALEVNR obtained from the tryptic digestion of spot 5 is shown in panel A. The sequence of the peptide ion selected in the first MS is shown at the bottom of the spectra. The masses of detected b and y ions after fragmentation are listed in the table next to the spectra. y° indicates additional loss of H2O; b*,y* indicate additional loss NH3. Representative images of two-dimensional western blotting analysis for desmin are displayed for control (B) and ET1-treated cells (C). A Coomassie stained 1D gel is shown in panel D showing equal protein load (60 μg) together with representative image of 1D western blotting analysis for desmin aside.
3.4. Localization of desmin and mitochondria in ET-stimulated cells
Since recent literature [11,12,17] suggested a role of desmin in mitochondrial (re)positioning, we tracked the localization of desmin as well as mitochondria by respectively, a monoclonal anti-desmin antibody and the fluorescent probe MitoTracker (MT). As expected on the basis of the results of proteomics and immunoblotting analysis, an increase in desmin signal was observed upon ET1 stimulation (compare Fig. 5A and B). Interestingly, desmin staining reveals some aggregate-like perinuclear signal after ET1 stimulation (Fig. 5B). When probed with MT, the expected distribution of mitochondrial signal – i.e. a punctuate distribution all over the cellular profile – was observed under control conditions (Fig. 5C). After ET1 treatment the mitochondria signal was less prominent in peripheral cytoplasm and more concentrated in the perinuclear region of the cell, indicating that ET1 induces an intracellular redistribution of mitochondria (Fig. 5D).
Fig. 5.

Intracellular localization of desmin (A and B) and mitochondria (C and D). Control (A and C) and ET1-stimulated cells (B and D) were stained either with anti-desmin antibody or MitoTracker. Pictures were taken at 1000× magnification using oil-immersion microscopy. Desmin signal appeared to be markedly increased in ET1-stimulated cells (B) compared to control conditions (A), showing aggregate-like signals especially in the perinuclear area. MitoTracker probing revealed a network spread throughout the whole cell in control cells (C) whereas the signal appeared to be accumulated in the perinuclear region, after ET1 stimulation (D).
3.5. Filter assay for amyloid-like aggregates
Since fluorescence microscopy suggested the presence of potential protein aggregates in the cells (amyloid bodies) an assay for the detection of amyloid-like aggregates was performed as described by Sanbe et al. [10,16]. Fig. 6A shows a representative image of a typical filter assay obtained from control and ET1 treated cells. The upper row of panel A shows the signal obtained by incubating the membrane with an anti-desmin antibody, whereas the lower row shows the total protein staining with Direct Blue 71. Aggregate-like deposits appear to be present already in control cell lysates but increase significantly after ET1 treatment. Negative anti-troponin I immunostaining excluded a specific binding of proteins to the membrane (data not shown). Mean density values obtained in three independent experiments, each performed at least in duplicate, are plotted in Fig. 6B and show that amyloid-like desmin aggregates are increased by 81% upon ET1 stimulation.
Fig. 6.
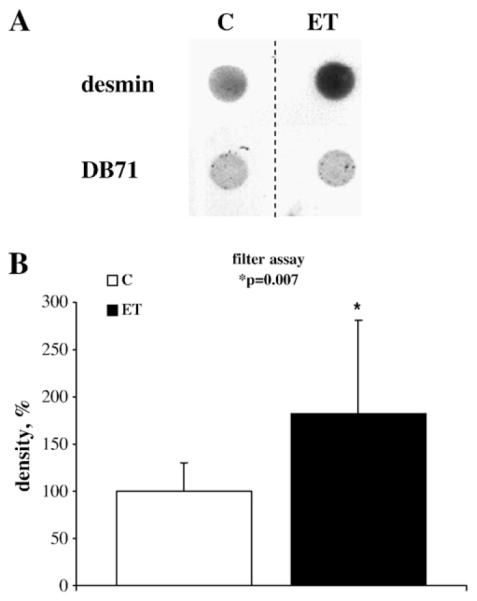
Detection of amyloid-like aggregates by filter assay. A representative image is shown of a membrane filter (A), probed with anti-desmin antibody (upper row) or the general protein stain Direct Blue 71 (lower row). Direct blue staining shows equal protein load. Mean density values obtained from three independent experiments (n≥2) are plotted in B. Density values are expressed as percentage (±SD). Each value was normalized to the relative average of control values (100%). Desmin signal was significantly increased (81%; p=0.007) after ET treatment.
4. Discussion
Data of proteomic profiling of the hypertrophied and/or failing human and animal heart are available but most of these studies pertain to the dilated cardiomyopathy (DCM) type of left ventricular disease as reviewed in [18]. In the present study 2DE gel-based proteomic analysis of a well-established in vitro model for cardiomyocyte hypertrophy is presented. The most intriguing observation is the increase in the abundance of four desmin species. On the basis of their apparent mobilities on 2DE gels compared to the theoretical pI and Mw values these four increased desmin species must represent post-translationally modified forms of desmin. This suggests a role of quantitative (abundance) and qualitative (PTM) changes of intermediate filaments in developing hypertrophy. Interestingly, CryAB, which is known to be able to bind to desmin, is upregulated in the hypertrophied cardiomyocytes as well. Our group recently reported a similar effect on both desmin and CryAB in a differential proteomic profiling study on right ventricular hypertrophy in a pulmonary artery banded rat model [19]. In this in vivo model, we observed parallel upregulation of desmin and CryAB in the myofilament fraction obtained from whole homogenates of hypertrophied right ventricle. Although the hypertrophic cardiomyocyte lysates were not subfractionated in the present study, the observed changes in expression of desmin and CryAB appear to be similar to those in the pressure-overloaded intact hearts [19].
Desmin is an intermediate filament (IF) protein, associated with intercalated discs and involved in stabilization of sarcomeres by connecting Z-discs to plasma membrane on one end and nuclear envelope on the other side [20]. Desmin has been shown to interact with various organelles in the cell and evidence is increasing for its role in their cellular distribution and function [21].
Several studies have described desmin abnormalities in human DCM and heart failure [22-26]. Generally a reduction of desmin levels is seen in diseased myocardium, although Heling et al. [26] found an upregulation of desmin in cardiac disorders such as hypertrophy and congestive heart failure. Corbett et al. [25] observed a reduction in five desmin species in samples from patients with DCM versus ischemic heart disease. They speculated that these protein changes could be the result of the increased proteolytic activity in the failing myocardium [25]. Degradation of IF proteins, such as vimentin and desmin, by Ca2+-activated proteases was first described by Nelson and Traub [27]. These authors described a two-step cleavage, initially involving the N-terminal side of desmin where a 9 kDa fragment is cleaved off. Desmin mutations are associated with desmin-related cardiomyopathy (DRM) and idiopathic DCM [20,28,29]. Desmin-null mice develop cardiomyocyte hypertrophy and DCM. Ultrastructural alterations include disrupted myofibrillar alignment and profound mitochondrial abnormalities [30]. The absence of desmin leads to loss of proper mitochondrial distribution, number, morphology and function [11,31,32]. In fact, the latter studies were the first to show the role and significance of the physical association of mitochondria with IFs. In view of this hypothesis we examined the localization of desmin and mitochondria in the hypertrophied cardiomyocytes by respectively, immuno- and MT staining. Desmin signal appeared to be more intense in ET1-stimulated cells with some perinuclear aggregates (Fig. 5A and B). Moreover, repositioning of mitochondria is observed in ET1-stimulated cells (Fig. 5C and D). Connections of the desmin IF network with both nuclei and mitochondria, directly, or indirectly through the Z-discs of the contractile apparatus, were postulated to provide a means by which contractile activity could mechanically influence and coordinate mitochondrial and nuclear activity in the myocardium [11,32]. IFs could influence mitochondrial function by stabilizing their positioning to areas of high energy demand or by directly influencing their membrane properties [32,33]. Therefore, during hypertrophy mitochondrial function may be regulated by IFs through proper mitochondrial repositioning.
Likely, the small heat shock protein CryAB also plays a role in this context. CryAB is known to bind to both desmin and cytoplasmic actin and participates as a chaperone in the IF formation and maintenance in the normal heart [34,35]. It is noteworthy that a R120G missense mutation in CryAB is known to cause DRM in mice and this disease is characterized by the formation of amyloid-like aggregates containing CryAB and desmin [35]. These structures were mainly distributed in the perinuclear region in isolated cardiomyocytes transfected with CryABR120G [36]. These features may be related to the co-upregulation of CryAB and post-translationally modified desmins as observed in the hypertrophied cardiomyocytes in the present work. Moreover recent findings from Sanbe et al. in the same DRM model [16] suggest that the formation of amyloid bodies could affect the contraction capacity of the heart. Liu et al. recently demonstrated a causal, dose-dependent relation between overexpression of a mutant desmin form (DRM-linked-7-aminoacid R172 to E178 deletion or MT-des) and ubiquitine proteasome system (UPS) imbalance in rat neonatal cardiac myocytes [37]. The same group has previously demonstrated a similar effect of overexpression of the mutant (R120G) form of CryAB [38]. According to these authors the formation of abnormal protein aggregates, or amyloid bodies, is responsible for proteasome malfunctioning, also referred to as proteasome “choking” by Patterson [39,40]. Accordingly, we report here that amyloid-like aggregates increased in our in vitro model for cardiac hypertrophy.
A number of different mechanisms of pathophysiology based on desmin protein expression have been postulated to date. Despite the increasing number of functions attributed to the protein, the type of PTM mechanisms occurring in in vivo models for cardiac disease and their effects on cardiomyocyte architecture and organelle function have not been fully characterized yet. As a rule PTMs of IF proteins such as phosphorylation and proteolysis induce a shift in their distribution from the assembled, functional, scaffold to a “soluble” pool of IF protein subunits. What this implies in terms of cell biology (organelles distribution and function), cytoarchitecture and pathophysiology needs to be addressed. We are currently characterizing the extent of desmin PTMs in different human and animal models for cardiac hypertrophy and failure. We believe that the exact characterization of phosphorylated or cleaved sites (and other potential PTMs) under pathophysiological conditions will set the rationale to build mechanistic models of desmin function and validate current knowledge in the field.
ET1 treatment of cardiomyocytes in culture also affected abundance of other proteins. This includes the decreased abundance of calumenin, a member of the CREC-family. Although the function of this protein remains largely unknown calumenin is the only member of this calcium-binding protein family believed to be secreted out of the cell [41]. Interestingly, thrombin-activated thrombocytes release calumenin which can be found in atherosclerotic lesions [42]. Previous studies demonstrated also the ability of calumenin to bind serum amyloid B component (SAP) thus participating in the formation of amyloid deposits [43]. Finally, the same group demonstrated more recently that calumenin can induce cytoskeletal reorganization in fibroblasts in a paracrine manner [44]. The decrease in the cellular levels of this protein may be compatible with its increased secretion. It should be pointed out that the difference observed in the electrophoretic mobility of this protein with respect to the theoretical mass is due to its high acidity as reported by Vorum et al. [43].
ET1 treatment also decreased the abundance of a protein participating in the control of the redox potential of the cell, i.e. thiol-specific antioxidant, a cytosolic protein that might participate in signal cascades of growth factors by regulating the intracellular concentration of H2O2. Two mitochondrial heat shock proteins – Hsp60 and grp75 – were also decreased after ET1 stimulation. Both are molecular chaperones involved in the maintenance of protein folding after mitochondrial import. In heart and muscle cells Hsp60 is also found in the cytosol (25 to 30% of the protein). This protein has been investigated for its anti-apoptotic properties. According to Gupta and Knowlton [45-47] reduction of Hsp60 expression is able to precipitate apoptosis in the heart. The role of grp75 in heart mitochondria was recently investigated in a rat model for septic shock. The expression of the protein appeared to be decreased during the shock accounting for the accompanying mitochondrial dysfunction [48]. Three proteins, typically originating from fibroblasts (tropomyosins 4 and 1α and vimentin) showed a slight upregulation, which may reflect an increased abundance of these proteins from a small fibroblast population in the cultures or a reversal of the cardiomyocyte cytoskeleton to a fetal phenotype [5,49].
In conclusion, 2DE gel-based proteomic analysis of hypertrophied cardiomyocytes reveals quantitative alterations in protein expression. The observed upregulation of multiple desmin species and CryAB, together with the accumulation of desmin in the perinuclear region, the redistribution of mitochondria towards the cell center, and the increased presence of desmin-positive amyloid bodies in the hypertrophic cells, support a role of post-translationally modified desmin in mitochondrial repositioning during hypertrophy. Together with the decrease in mitochondrial Hsps expression these observations, suggest a concerted role of different desmin species, mitochondrial and possibly proteosomal impairment already at the early stages of developing hypertrophy.
Acknowledgements
We want to express our gratitude to Dr. Ben Tilly (Erasmus MC, NL) and Dr. Francesca Bonafé (Bologna University, I) for their expert assistance in the preparation of samples and use of fluorescence microscopy, and to Dr J. Robbins (Cincinnati Children’s Hospital MC, US) and co-workers for the useful suggestions on filter assay protocol. Grants from Compagnia di San Paolo, Turin, Italy (CMC), Programma Marco Polo, Universitá di Bologna, Italy (GA) and COFIN, MIUR, Italy [(EF 2003; CG) (EF 2004; EG)] are gratefully acknowledged.
Abbreviations
- 2DE
2-dimensional gel electrophoresis
- ACN
acetonitrile
- CryAB
α-B-crystallin
- DCM
dilated cardiomyopathy
- DRM
desmin-related cardiomyopathy
- ET1
endothelin-1
- IEF
isoelectric focusing
- IFs
intermediate filaments
- IPG
Immobilized pH gradient
- LC–ESI-Q-TOF-MS/MS
liquid chromatography–electrospray-ionisation-quadrupole selection/time-of-flight tandem mass spectrometry
- MALDI-TOF-MS
matrix-assisted laser-desorption-ionisation/time-of-flight mass spectrometry
- MT
MitoTracker
- PTM
post-translational modification
- SFM
serum-free medium
- TBS
Tris-buffered saline
- TCA
trichloroacetic acid
- TFA
trifluoroacetic acid
References
- [1].Lorell BH, Carabello BA. Left ventricular hypertrophy: pathogenesis, detection, and prognosis. Circulation. 2000;102:470–479. doi: 10.1161/01.cir.102.4.470. [DOI] [PubMed] [Google Scholar]
- [2].Houser SR, Lakatta EG. Function of the cardiac myocyte in the conundrum of end-stage, dilated human heart failure. Circulation. 1999;99:600–604. doi: 10.1161/01.cir.99.5.600. [DOI] [PubMed] [Google Scholar]
- [3].Hunter JJ, Chien KR. Signaling pathways for cardiac hypertrophy and failure. N. Engl. J. Med. 1999;341:1276–1283. doi: 10.1056/NEJM199910213411706. [DOI] [PubMed] [Google Scholar]
- [4].Brancaccio M, Fratta L, Notte A, Hirsch E, Poulet R, Guazzone S, De Acetis M, Vecchione C, Marino G, Altruda F, Silengo L, Tarone G, Lembo G. Melusin, a muscle-specific integrin beta1-interacting protein, is required to prevent cardiac failure in response to chronic pressure overload. Nat. Med. 2003;9:68–75. doi: 10.1038/nm805. [DOI] [PubMed] [Google Scholar]
- [5].Hoshijima M, Chien KR. Mixed signals in heart failure: cancer rules. J. Clin. Invest. 2002;109:849–855. doi: 10.1172/JCI15380. [DOI] [PMC free article] [PubMed] [Google Scholar]
- [6].van Heugten HA, van Setten MC, Eizema K, Verdouw PD, Lamers JM. Sarcoplasmic reticulum Ca2+ ATPase promoter activity during endothelin-1 induced hypertrophy of cultured rat cardiomyocytes. Cardiovasc. Res. 1998;37:503–514. doi: 10.1016/s0008-6363(97)00254-x. [DOI] [PubMed] [Google Scholar]
- [7].Lamers JM, Eskildsen-Helmond YE, Resink AM, de Jonge HW, Bezstarosti K, Sharma HS, van Heugten HA. Endothelin-1-induced phospholipase C-beta and D and protein kinase C isoenzyme signaling leading to hypertrophy in rat cardiomyocytes. J. Cardiovasc. Pharmacol. 1995;26(Suppl 3):S100–S103. [PubMed] [Google Scholar]
- [8].Colucci WS. Myocardial endothelin. Does it play a role in myocardial failure? Circulation. 1996;93:1069–1072. doi: 10.1161/01.cir.93.6.1069. [DOI] [PubMed] [Google Scholar]
- [9].Bogoyevitch MA, Glennon PE, Andersson MB, Clerk A, Lazou A, Marshall CJ, Parker PJ, Sugden PH. Endothelin-1 and fibroblast growth factors stimulate the mitogen-activated protein kinase signaling cascade in cardiac myocytes. The potential role of the cascade in the integration of two signaling pathways leading to myocyte hypertrophy. J. Biol. Chem. 1994;269:1110–1119. [PubMed] [Google Scholar]
- [10].Sanbe A, Osinska H, Saffitz JE, Glabe CG, Kayed R, Maloyan A, Robbins J. Desmin-related cardiomyopathy in transgenic mice: a cardiac amyloidosis. Proc. Natl. Acad. Sci. U. S. A. 2004;101:10132–10136. doi: 10.1073/pnas.0401900101. [DOI] [PMC free article] [PubMed] [Google Scholar]
- [11].Capetanaki Y. Desmin cytoskeleton: a potential regulator of muscle mitochondrial behavior and function. Trends Cardiovasc. Med. 2002;12:339–348. doi: 10.1016/s1050-1738(02)00184-6. [DOI] [PubMed] [Google Scholar]
- [12].Maloyan A, Sanbe A, Osinska H, Westfall M, Robinson D, Imahashi K, Murphy E, Robbins J. Mitochondrial dysfunction and apoptosis underlie the pathogenic process in alpha-B-crystallin desmin-related cardiomyopathy. Circulation. 2005;112:3451–3461. doi: 10.1161/CIRCULATIONAHA.105.572552. [DOI] [PMC free article] [PubMed] [Google Scholar]
- [13].de Jonge HW, Dekkers DH, Houtsmuller AB, Sharma HS, Lamers JM. Differential signaling and hypertrophic responses in cyclically stretched vs endothelin-1 stimulated neonatal rat cardiomyocytes. Cell Biochem. Biophys. 2007;47:21–32. doi: 10.1385/cbb:47:1:21. [DOI] [PubMed] [Google Scholar]
- [14].Faber MJ, Agnetti G, Bezstarosti K, Lankhuizen IM, Dalinghaus M, Guarnieri C, Caldarera CM, Helbing WA, Lamers JM. Recent developments in proteomics: implications for the study of cardiac hypertrophy and failure. Cell Biochem. Biophys. 2006;44:11–29. doi: 10.1385/CBB:44:1:011. [DOI] [PubMed] [Google Scholar]
- [15].Van Heugten HA, Bezstarosti K, Dekkers DH, Lamers JM. Homologous desensitization of the endothelin-1 receptor mediated phosphoinositide response in cultured neonatal rat cardiomyocytes. J.Mol.Cell.Cardiol. 1993;25:41–52. doi: 10.1006/jmcc.1993.1006. [DOI] [PubMed] [Google Scholar]
- [16].Sanbe A, Osinska H, Villa C, Gulick J, Klevitsky R, Glabe CG, Kayed R, Robbins J. Reversal of amyloid-induced heart disease in desmin-related cardiomyopathy. Proc. Natl. Acad. Sci. U. S. A. 2005;102:13592–13597. doi: 10.1073/pnas.0503324102. [DOI] [PMC free article] [PubMed] [Google Scholar]
- [17].Ralston E, Lu Z, Biscocho N, Soumaka E, Mavroidis M, Prats C, Lomo T, Capetanaki Y, Ploug T. Blood vessels and desmin control the positioning of nuclei in skeletal muscle fibers. J. Cell. Physiol. 2006;209:874–882. doi: 10.1002/jcp.20780. [DOI] [PubMed] [Google Scholar]
- [18].Jager D, Jungblut PR, Muller-Werdan U. Separation and identification of human heart proteins. J. Chromatogr. B. Analyt Technol. Biomed. Life. Sci. 2002;771:131–153. doi: 10.1016/s1570-0232(02)00039-9. [DOI] [PubMed] [Google Scholar]
- [19].Faber MJ, Dalinghaus M, Lankhuizen IM, Bezstarosti K, Dekkers DH, Duncker DJ, Helbing WA, Lamers JM. Proteomic changes in the pressure overloaded right ventricle after 6 weeks in young rats: correlations with the degree of hypertrophy. Proteomics. 2005;5:2519–2530. doi: 10.1002/pmic.200401313. [DOI] [PubMed] [Google Scholar]
- [20].Franz WM, Muller OJ, Katus HA. Cardiomyopathies: from genetics to the prospect of treatment. Lancet. 2001;358:1627–1637. doi: 10.1016/S0140-6736(01)06657-0. [DOI] [PubMed] [Google Scholar]
- [21].Capetanaki Y, Bloch RJ, Kouloumenta A, Mavroidis M, Psarras S. Muscle intermediate filaments and their links to membranes and membranous organelles. Exp. Cell Res. 2007;313:2063–2076. doi: 10.1016/j.yexcr.2007.03.033. [DOI] [PubMed] [Google Scholar]
- [22].Francalanci P, Gallo P, Bernucci P, Silver MD, d’Amati G. The pattern of desmin filaments in myocardial disarray. Hum. Pathol. 1995;26:262–266. doi: 10.1016/0046-8177(95)90055-1. [DOI] [PubMed] [Google Scholar]
- [23].Schaper J, Froede R, Hein S, Buck A, Hashizume H, Speiser B, Friedl A, Bleese N. Impairment of the myocardial ultrastructure and changes of the cytoskeleton in dilated cardiomyopathy. Circulation. 1991;83:504–514. doi: 10.1161/01.cir.83.2.504. [DOI] [PubMed] [Google Scholar]
- [24].Wilke A, Schonian U, Herzum M, Hengstenberg C, Hufnagel G, Brilla CG, Maisch B. The extracellular matrix and cytoskeleton of the myocardium in cardiac inflammatory reaction. Herz. 1995;20:95–108. [PubMed] [Google Scholar]
- [25].Corbett JM, Why HJ, Wheeler CH, Richardson PJ, Archard LC, Yacoub MH, Dunn MJ. Cardiac protein abnormalities in dilated cardiomyopathy detected by two-dimensional polyacrylamide gel electrophoresis. Electrophoresis. 1998;19:2031–2042. doi: 10.1002/elps.1150191123. [DOI] [PubMed] [Google Scholar]
- [26].Heling A, Zimmermann R, Kostin S, Maeno Y, Hein S, Devaux B, Bauer E, Klovekorn WP, Schlepper M, Schaper W, Schaper J. Increased expression of cytoskeletal, linkage, and extracellular proteins in failing human myocardium. Circ. Res. 2000;86:846–853. doi: 10.1161/01.res.86.8.846. [DOI] [PubMed] [Google Scholar]
- [27].Nelson WJ, Traub P. Proteolysis of vimentin and desmin by the Ca2+-activated proteinase specific for these intermediate filament proteins. Mol. Cell. Biol. 1983;3:1146–1156. doi: 10.1128/mcb.3.6.1146. [DOI] [PMC free article] [PubMed] [Google Scholar]
- [28].Li D, Tapscoft T, Gonzalez O, Burch PE, Quinones MA, Zoghbi WA, Hill R, Bachinski LL, Mann DL, Roberts R. Desmin mutation responsible for idiopathic dilated cardiomyopathy. Circulation. 1999;100:461–464. doi: 10.1161/01.cir.100.5.461. [DOI] [PubMed] [Google Scholar]
- [29].Sjoberg G, Saavedra-Matiz CA, Rosen DR, Wijsman EM, Borg K, Horowitz SH, Sejersen T. A missense mutation in the desmin rod domain is associated with autosomal dominant distal myopathy, and exerts a dominant negative effect on filament formation. Hum. Mol. Genet. 1999;8:2191–2198. doi: 10.1093/hmg/8.12.2191. [DOI] [PubMed] [Google Scholar]
- [30].Weisleder N, Soumaka E, Abbasi S, Taegtmeyer H, Capetanaki Y. Cardiomyocyte-specific desmin rescue of desmin null cardiomyopathy excludes vascular involvement. J. Mol. Cell. Cardiol. 2004;36:121–128. doi: 10.1016/j.yjmcc.2003.10.010. [DOI] [PubMed] [Google Scholar]
- [31].Milner DJ, Mavroidis M, Weisleder N, Capetanaki Y. Desmin cytoskeleton linked to muscle mitochondrial distribution and respiratory function. J. Cell Biol. 2000;150:1283–1298. doi: 10.1083/jcb.150.6.1283. [DOI] [PMC free article] [PubMed] [Google Scholar]
- [32].Capetanaki Y. Desmin cytoskeleton in healthy and failing heart. Heart Fail. Rev. 2000;5:203–220. doi: 10.1023/A:1009853302447. [DOI] [PubMed] [Google Scholar]
- [33].Lesnefsky EJ, Moghaddas S, Tandler B, Kerner J, Hoppel CL. Mitochondrial dysfunction in cardiac disease: ischemia–reperfusion, aging, and heart failure. J. Mol. Cell. Cardiol. 2001;33:1065–1089. doi: 10.1006/jmcc.2001.1378. [DOI] [PubMed] [Google Scholar]
- [34].Wang X, Osinska H, Dorn GW, II, Nieman M, Lorenz JN, Gerdes AM, Witt S, Kimball T, Gulick J, Robbins J. Mouse model of desmin-related cardiomyopathy. Circulation. 2001;103:2402–2407. doi: 10.1161/01.cir.103.19.2402. [DOI] [PubMed] [Google Scholar]
- [35].Wang X, Klevitsky R, Huang W, Glasford J, Li F, Robbins J. AlphaB-crystallin modulates protein aggregation of abnormal desmin. Circ. Res. 2003;93:998–1005. doi: 10.1161/01.RES.0000102401.77712.ED. [DOI] [PubMed] [Google Scholar]
- [36].Wang X, Osinska H, Klevitsky R, Gerdes AM, Nieman M, Lorenz J, Hewett T, Robbins J. Expression of R120G-alphaB-crystallin causes aberrant desmin and alphaB-crystallin aggregation and cardiomyopathy in mice. Circ. Res. 2001;89:84–91. doi: 10.1161/hh1301.092688. [DOI] [PubMed] [Google Scholar]
- [37].Liu J, Tang M, Mestril R, Wang X. Aberrant protein aggregation is essential for a mutant desmin to impair the proteolytic function of the ubiquitin–proteasome system in cardiomyocytes. J. Mol. Cell. Cardiol. 2006;40:451–454. doi: 10.1016/j.yjmcc.2005.12.011. [DOI] [PubMed] [Google Scholar]
- [38].Chen Q, Liu JB, Horak KM, Zheng H, Kumarapeli AR, Li J, Li F, Gerdes AM, Wawrousek EF, Wang X. Intrasarcoplasmic amyloidosis impairs proteolytic function of proteasomes in cardiomyocytes by compromising substrate uptake. Circ. Res. 2005;97:1018–1026. doi: 10.1161/01.RES.0000189262.92896.0b. [DOI] [PubMed] [Google Scholar]
- [39].Patterson C. Search and destroy: the role of protein quality control in maintaining cardiac function. J. Mol. Cell. Cardiol. 2006;40:438–441. doi: 10.1016/j.yjmcc.2006.01.003. [DOI] [PubMed] [Google Scholar]
- [40].Wang X, Robbins J. Heart failure and protein quality control. Circ. Res. 2006;99:1315–1328. doi: 10.1161/01.RES.0000252342.61447.a2. [DOI] [PubMed] [Google Scholar]
- [41].Vorum H, Hager H, Christensen BM, Nielsen S, Honore B. Human calumenin localizes to the secretory pathway and is secreted to the medium. Exp. Cell Res. 1999;248:473–481. doi: 10.1006/excr.1999.4431. [DOI] [PubMed] [Google Scholar]
- [42].Coppinger JA, Cagney G, Toomey S, Kislinger T, Belton O, McRedmond JP, Cahill DJ, Emili A, Fitzgerald DJ, Maguire PB. Characterization of the proteins released from activated platelets leads to localization of novel platelet proteins in human atherosclerotic lesions. Blood. 2004;103:2096–2104. doi: 10.1182/blood-2003-08-2804. [DOI] [PubMed] [Google Scholar]
- [43].Vorum H, Jacobsen C, Honore B. Calumenin interacts with serum amyloid P component. FEBS Lett. 2000;465:129–134. doi: 10.1016/s0014-5793(99)01734-2. [DOI] [PubMed] [Google Scholar]
- [44].Ostergaard M, Hansen GA, Vorum H, Honore B. Proteomic profiling of fibroblasts reveals a modulating effect of extracellular calumenin on the organization of the actin cytoskeleton. Proteomics. 2006;6:3509–3519. doi: 10.1002/pmic.200500686. [DOI] [PubMed] [Google Scholar]
- [45].Gupta S, Knowlton AA. HSP60 trafficking in adult cardiac myocytes: role of the exosomal pathway. Am. J. Physiol, Heart Circ. Physiol. 2007 doi: 10.1152/ajpheart.01355.2006. [DOI] [PubMed] [Google Scholar]
- [46].Gupta S, Knowlton AA. HSP60, Bax, apoptosis and the heart. J. Cell. Mol. Med. 2005;9:51–58. doi: 10.1111/j.1582-4934.2005.tb00336.x. [DOI] [PMC free article] [PubMed] [Google Scholar]
- [47].Knowlton AA, Gupta S. HSP60, Bax, and cardiac apoptosis. Cardiovasc. Toxicol. 2003;3:263–268. doi: 10.1385/ct:3:3:263. [DOI] [PubMed] [Google Scholar]
- [48].Chen HW, Hsu C, Lu TS, Wang SJ, Yang RC. Heat shock pretreatment prevents cardiac mitochondrial dysfunction during sepsis. Shock. 2003;20:274–279. doi: 10.1097/00024382-200309000-00013. [DOI] [PubMed] [Google Scholar]
- [49].Nelson WJ, Traub P. Purification and further characterization of the Ca2+-activated proteinase specific for the intermediate filament proteins vimentin and desmin. J. Biol. Chem. 1982;257:5544–5553. [PubMed] [Google Scholar]