

Abstract
Background:
Clinical and epidemiologic studies suggest that patients with Alzheimer disease (AD) with larger head circumference have better cognitive performance at the same level of brain pathology than subjects with smaller head circumference.
Methods:
A total of 270 patients with AD participating in the Multi-Institutional Research in Alzheimer's Genetic Epidemiology (MIRAGE) study underwent cognitive testing, APOE genotyping, and MRI of the brain in a cross-sectional study. Linear regression analysis was used to examine the association between cerebral atrophy, as a proxy for AD pathology, and level of cognitive function, adjusting for age, duration of AD symptoms, gender, head circumference, APOE genotype, diabetes mellitus, hypertension, major depression, and ethnicity. An interaction term between atrophy and head circumference was introduced to explore if head circumference modified the association between cerebral atrophy and cognition.
Results:
There was a significant inverse association between atrophy and cognitive function, and a significant interaction between atrophy and head circumference. With greater levels of atrophy, cognition was higher for individuals with greater head circumference.
Conclusion:
This study suggests that larger head circumference is associated with less cognitive impairment in the face of cerebral atrophy. This finding supports the notion that head circumference (and presumably brain size) offers protection against AD symptoms through enhanced brain reserve.
GLOSSARY
- AD
= Alzheimer disease;
- BR
= brain reserve;
- CR
= cognitive reserve;
- MIRAGE
= Multi-Institutional Research in Alzheimer's Genetic Epidemiology;
- MMSE
= Mini-Mental State Examination.
Alzheimer disease (AD) pathology is characterized by neurofibrillary tangle formation, amyloid-β deposition, neuronal loss, and volume reduction.1 Structural changes including atrophy of the limbic, temporal, parietal, and frontal lobes are reliably detected in vivo by modern neuroimaging techniques such as MRI. Imaging findings are consistent with proposed pathologic staging schemes,2 and the correlation between brain volume loss and cognitive impairment is well-established.3 However, the association between AD pathology and clinical symptoms is not always strong. Elderly people with sufficient plaques and tangles to meet AD criteria at autopsy do not necessarily show clinical symptoms of AD shortly before death.4 The individual capacity to withstand pathologic changes is usually referred to as brain reserve (BR) or cognitive reserve (CR). One common hypothesis defines BR as a passive protection against the consequences of brain damage, mediated by a larger brain or more neurons and synaptic connections; CR, on the other hand, is characterized by active processes helping to compensate for or cope with brain damage, e.g., through alternative neuronal pathways.5,6 The exact neural substrate of reserve is still to be discovered; it may consist of both passive and active components, and a growing body of evidence is exploring the mechanisms behind these concepts. Studies relating plaque counts,7 brain atrophy,8 regional blood flow,9 or glucose metabolism10–13 to clinical symptoms and biographic variables have demonstrated that patients with higher educational or occupational attainment show better cognitive performance at the same level of disease severity. However, not only biographic but also brain morphologic characteristics seem to provide reserve against neurodegeneration. Some, but not all,14–16 studies suggest that individuals with larger brains, usually estimated by head circumference or intracranial volume, are less likely to have cognitive decline in old age17–19 or AD.20–26 However, the question of whether maximal attained brain size modifies the association between structural indices of AD pathology and clinical symptoms of AD has not been addressed. The present study investigated if head circumference attenuates the effect of cerebral atrophy on cognitive function in AD, taking into account other variables that are known to impact cognitive ability, including age, duration of AD symptoms, gender, APOE genotype, diabetes mellitus, hypertension, major depression, and ethnicity.
METHODS
Study participants.
The Multi-Institutional Research in Alzheimer's Genetic Epidemiology (MIRAGE) study is a family-based multicenter study of genetic and environmental risk factors for AD; details of data collection and reliabilities of questionnaires have been published elsewhere.27 In summary, participants were recruited through research registries or specialized memory clinics at 17 sites in the United States (14), Canada (1), Germany (1), and Greece (1). Diagnosis of AD was established according to National Institute of Neurological and Communicative Disorders and Stroke–Alzheimer's Disease and Related Disorders Association criteria.28 Medical history, information on risk factors, blood samples for genetic testing, and cranial MRI scans were collected from all participants. The most recent Mini-Mental State Examination (MMSE)29 was recorded. To ensure diagnostic accuracy, all participants with an MMSE score higher than 25 were excluded.30
Standard protocol approvals, registrations, and patient consent.
A combination of informed consent by both participant and by proxy was obtained. Institutional review boards from each study site reviewed and approved all protocols.
Study procedures.
The MRI scanning procedures and analysis protocols in the MIRAGE study have been described elsewhere in greater detail.31 Briefly, fluid-attenuated inversion recovery and high-resolution T1 scans were obtained from each participant according to a standard protocol. A 100-mm visual analog scale with 0 for no atrophy and 100 for most severe atrophy was used to rate cerebral atrophy. The image evaluation was performed by a single rater (C.D.), blinded to all other patient data; a visual rating of cerebral atrophy and manual volumetric measures are highly correlated.32 APOE genotyping was performed using a standard PCR.33 APOE genotype was dichotomized for the present study into individuals with 1 or 2 copies of the ε4 allele (ε4+) and those without any copies of the ε4 allele (ε4−). Head circumference was measured by placing a measuring tape over the eyebrows and passing it around the head to fit over the most posterior protuberance of the occiput.
Statistical analyses.
Data were analyzed with the Statistical Package for Social Sciences, v16 (SPSS Inc., Chicago, IL). All p values shown are 2-sided and subject to a significance level of 5%. First, statistical parametric correlations (Pearson product-moment correlation coefficients) were calculated in order to explore dependencies in the dataset. In detail, correlation analyses were performed between the MMSE score and the atrophy rating, the age, the duration of AD symptoms, and the head circumference. Second, the association of brain atrophy and cognitive function was examined via a multiple linear regression analysis with MMSE score as the dependent and the atrophy rating as the independent variable. Other variables with a possible effect on cognitive function, such as age, duration of AD symptoms, gender, head circumference, APOE genotype, presence of hypertension, diabetes mellitus, or major depression, and ethnicity, were also entered as independent variables along with atrophy. Ethnicity was treated as a quadrotomy (Hispanic, African American, and Asian American) with non-Hispanic white as the referent. The presence or absence of hypertension, diabetes mellitus, and major depression were treated as dichotomies. To determine whether head circumference modified the effect of atrophy on cognitive ability, an interaction term between head circumference and atrophy was added to the model. This interaction model was also repeated for other covariates. To compare the distribution of the MMSE score with the normal distribution, a normal p-p plot of regression standardized residuals was generated, which plots the cumulative proportions of standardized residuals of the MMSE score against the cumulative proportions of the respective normal distribution. The normality assumption was supported by this plot (results not shown).
RESULTS
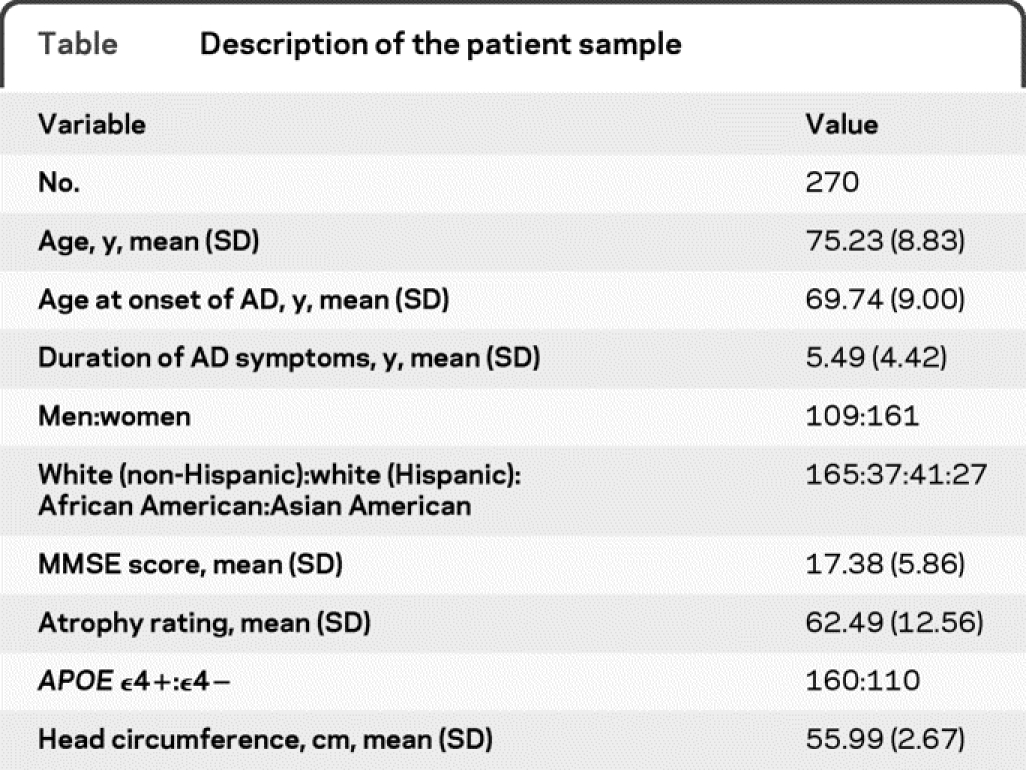
A description of the study sample is given in the table. A total of 270 patients with AD were included with an average age of 75 years, a mean MMSE score of 17 (median 19, range 0–25, kurtosis 0.28, skewness −0.89), 60% women, and 69% APOE ε4+. Higher MMSE scores were associated with less severe atrophy (r = −0.23, p < 0.01) and shorter duration of AD symptoms (r = −0.15, p < 0.05). There was no association between MMSE scores and head circumference (r = −0.2, p = 0.77). Older age was correlated with lower MMSE scores (r = −0.43, p = 0.05). In the linear regression analysis with the MMSE score as the dependent variable and independent variables as described above, atrophy (p < 0.001, β = −0.13, standard error = 0.03) and age (p = 0.02, β = −0.11, standard error = 0.05) entered the model as predictors; both were inversely associated with cognitive performance. The other independent variables did not exert any statistical effects (duration of AD symptoms: p = 0.2; gender: p = 0.94; APOE genotype: p = 0.56; head circumference: p = 0.89; diabetes mellitus: p = 0.75; hypertension: p = 0.91; major depression: p = 0.55; Hispanic ethnicity: p = 0.09; Asian American ethnicity: p = 0.64; African American ethnicity: p = 0.09).
Table Description of the patient sample
In the model testing for interaction between atrophy and head circumference, the interaction term was significant (p = 0.04, β = −0.21, standard error = 0.01), indicating that head circumference was associated with a reduced impact of atrophy on cognitive performance. Except age (p = 0.01, β = −0.11, standard error = 0.05), all other independent variables did not show any effects (duration of AD symptoms: p = 0.29; atrophy: p = 0.09; gender: p = 0.86; APOE genotype: p = 0.59; head circumference: p = 0.07; diabetes mellitus: p = 0.78; hypertension: p = 0.86; major depression: p = 0.53; Hispanic ethnicity: 0.07; Asian American ethnicity: p = 0.57, African American ethnicity: p = 0.10). The effect of head circumference on the association between cognitive function and brain atrophy is illustrated in the figure, which shows the partial regression plots of MMSE score and atrophy rating in patients with smaller head circumference compared to those with larger head circumference (cutoff defined as the mean head circumference of 56 cm). The figure illustrates that the association of atrophy and cognitive function differs by head circumference. In the additional models testing for interactions between atrophy and the other covariates, only age showed a negative effect (p = 0.04).

Figure Partial regression plots of Mini-Mental State Examination (MMSE) and atrophy rating
Partial regression plots of MMSE and atrophy rating (standardized predicted values with fitted lines [centered on 0] and 95% confidence intervals), controlled for other variables with a potential effect on cognitive function as specified in the regression analyses; (A) patients with head circumference ≤56 cm; (B) patients with head circumference >56 cm.
DISCUSSION
Smaller brain size, estimated from intracranial volume or head circumference, has been associated with an earlier onset of symptoms,34,35 and an increased risk for AD20–26 as well as worse cognitive performance in old age.17–19 Hence, larger brains seem to protect against the clinical manifestations of AD pathology by providing more BR. Staff and colleagues16 reported no association between intracranial volume and cognitive performance in old age, controlling for individual differences in cerebrovascular brain burden. We directly addressed the question of a modifying effect of head circumference on the association between brain atrophy and cognitive impairment in AD and report that larger head circumference attenuated the association between atrophy and cognitive performance, taking into account other factors known to impact on cognition. We did not observe a correlation between head circumference and cognitive performance, which was shown in previous studies of cognitively healthy elderly individuals; this finding suggests different effects of brain size on neurodegeneration compared with healthy aging. However, our results support the concept of BR and underline the importance of optimal neurologic development in early life. Brain size reaches 93% of its final size at age 6, and therefore measurements of head circumference mainly reflect brain growth during the first few years.36 Drawing on evidence that larger brains contain more neurons and synaptic connections,37 and that maximal brain size is largely determined in early childhood, our results suggest that optimal neural development in the first few years provides a buffer against cerebral pathology in late life. While brain growth is also genetically predefined, its full expression is modified by numerous external influences, including nutrition,38 CNS infections and inflammations,39 and perinatal brain injury.40 Therefore, the improvement of prenatal and early life conditions could significantly increase BR in the population, which in turn may have an impact on the risk of developing AD or the severity of symptoms in AD.
Limitations of the study include patient recruitment at specialized memory clinics, which restricts the generalization of the results to the population with AD. Furthermore, a visual rating procedure was used to grade brain atrophy. Although all ratings were performed by the same observer, automated volumetric procedures might further improve the results. Moreover, head circumference was used to estimate maximal adult brain size. Even though the measurements were conducted according to a standard procedure, and head circumference is broadly accepted as a surrogate for intracranial volume and maximal attained brain size,25 volumetric measurement of intracranial volume may have provided information more proximate to the actual variable of interest. However, head circumference and intracranial volume are highly correlated.e1,e2 Both head circumference and intracranial volume are only approximations to the actual maximal brain size attained during life; however, this baseline measure is rarely available in cross-sectional analyses. An additional concern is the lack of pathologic confirmation of AD. However, the validity of present clinical diagnostic criteria compared with autopsy diagnoses has been reported to be very good in study cohorts recruited at specialized centers.e3 Finally, although our cross-sectional study demonstrated that the cognitive function of individuals with larger head circumference was better than that of patients with smaller circumference at any given MMSE level, longitudinal studies are necessary to determine whether brain size modifies cognitive decline over time.
COINVESTIGATORS
Clinton Baldwin, PhD (Boston University, Site Investigator); Mark W. Logue, PhD (Boston University, Site Investigator); Sanford Auerbach, MD (Boston University, Site Investigator); Michael Wake, MSW (Boston University, Study Coordinator); Abimbola Akomolafe, MD (Morehouse Medical School, Site Investigator); Angela Ashley, MD (Morehouse Medical School, Site Investigator); Lorin Freedman, MD (Morehouse Medical School, Site Investigator); Elizabeth Ofili, MD (Morehouse Medical School, Site Investigator); Helena Chui, MD (University of Southern California, Site Investigator); Ranjan Duara, MD (Mt. Sinai Medical Center, Miami); Tatiana Foroud, MD (Indiana University, Site Investigator); Martin Farlow, MD (Indiana University, Site Investigator); Robert Friedland, MD (Case Western University, Site Investigator); Alan Lerner, MD (Case Western University, Site Investigator); Rodney Go, PhD (University of Alabama-Birmingham, Site Investigator); Thomas Obisesan, MD (Howard University, Site Investigator); Helen Petrovich, MD (Pacific Health Research Institute, Site Investigator); Lon White, MD (Pacific Health Research Institute, Site Investigator); Marwan Sabbagh, MD (Sun Health Research Institute, Site Investigator); Dessa Sadovnick, PhD (University of British Columbia, Site Investigator); Magda Tsolaki (University of Aristotle Thessaloniki, Site Investigator); Michael Wake, MSW (Boston University, Study Coordinator).
ACKNOWLEDGMENT
The authors thank Irene Simkin for laboratory work, John Farrell for database programming and electronic data capturing support, and Jianping Guo for data management; the MIRAGE site coordinators and the study participants; and Dorottya Ruisz for proofreading.
DISCLOSURE
Dr. Perneczky serves on the editorial boards of the Journal of Alzheimer's Disease, the Open Journal of Nuclear Medicine, and Open Longevity Science; and has received speaker honoraria from Janssen. Dr. Wagenpfeil serves on the editorial board of Endoscopy; received a speaker honorarium from Munich Business School; and receives research support from Graduate School of Information Science in Health (GSISH) of the Technische Universitaet Muenchen. Dr. Lunetta served as statistical editor for Circulation; and receives research support from the NIH (N01-HC-25195-06 [Co-I], R01 CA118708-02 [Co-I], R01 AG028321-02 [Co-I], P01 NS16367-26 [Co-I], R01-AG029451 [Co-I], R21-AG032598-01 [Co-I], R01-HL092577 [Co-I], and R01 AG0929-15S1 [Co-I]). Dr. Cupples serves on a scientific advisory board for Amgen; receives royalties from the publication of Gene by Environment Interaction Study Designs and Analytical Methods (Henry Stewart Presentation, 2006); and has received research support from Otsuka, Denka, and the NIH (5 R01 AG004390 [senior biostatistical advisor]). Dr. Green reports no disclosures. Dr. DeCarli serves as Editor-in-Chief of Alzheimer Disease and Associated Disorders; serves/has served as a consultant to Eisai Inc. and Merck Serono; and receives research support from Eisai Inc., Merck Serono, the Hillblom Foundation, the Network for Cognitive Neuroscience of Diabetes and Aging, and the NIH (P30 AG10129 [PI], DHS 98-14970 [Co-I], P01 AG12435 [Co-I], P01 AG0027232 [Co-I], R01 AG111101 [Co-I], R01 AG08122 [Co-I], R01 AG16495 [Co-I], U01 AG024904 [Co-I], 1UL1RR024922-01 [Co-I], R01 AG033040 [Co-I], R01 AG010220 [Co-I], R01 AG031252 [Co-I], R01 AG 031563 [Co-I], and R01 AG012975 [Co-I]). Dr. Farrer serves as a consultant for Novartis; serves on the editorial boards of the American Journal of Alzheimer's Disease & Other Dementias and Clinical Genetics; and receives research support from Eisai Inc. and the NIH (R01-AG09029 [PI], R01-DA12849 [Co-PI], R01-DA12690 [Co-PI], R01-AG17173 [Co-PI], P30-AG13846 [Co-I], 2R01-AG16495 [Co-I], R01-DK066388 [Co-I], R01-AG025259 [PI], R01 HL68970 [Co-I], R01-HL87681 [Co-I], R01 AG033040 [Co-I], R01-AG33193 [Co-I], U01-AG032984 [Co-I], R01-EY014458 [Co-PI], RC2-DA028909 [Co-PI], RC2-HL101212 [Co-I], and R01-HG/AG02213 [Co-I]). Dr. Kurz received a speaker honorarium from Eisai Inc.
Supplementary Material
Address correspondence and reprint requests to Dr. Robert Perneczky, Department of Psychiatry and Psychotherapy, Technische Universität München, Ismaninger Str. 22, 81675 München, Germany robert.perneczky@lrz.tum.de
Supplemental data at www.neurology.org
References e1–e3 are available on the Neurology® Web site at www.neurology.org.
Study funding: Supported in part by National Institute on Aging grants R01-AG09029, R01-HG/AG02213, K24-AG027841, and P30-AG13846.
Disclosure: Author disclosures are provided at the end of the article.
Received November 12, 2009. Accepted in final form February 19, 2010.
REFERENCES
- 1.Mirra SS, Heyman A, McKeel D, et al. The Consortium to Establish a Registry for Alzheimer's Disease (CERAD): part II: standardization of the neuropathologic assessment of Alzheimer's disease. Neurology 1991;41:479–486. [DOI] [PubMed] [Google Scholar]
- 2.Whitwell JL, Przybelski SA, Weigand SD, et al. 3D maps from multiple MRI illustrate changing atrophy patterns as subjects progress from mild cognitive impairment to Alzheimer's disease. Brain 2007;130:1777–1786. [DOI] [PMC free article] [PubMed] [Google Scholar]
- 3.Duarte A, Hayasaka S, Du A, et al. Volumetric correlates of memory and executive function in normal elderly, mild cognitive impairment and Alzheimer's disease. Neurosci Lett 2006;406:60–65. [DOI] [PMC free article] [PubMed] [Google Scholar]
- 4.Katzman R, Terry R, DeTeresa R, et al. Clinical, pathological, and neurochemical changes in dementia: a subgroup with preserved mental status and numerous neocortical plaques. Ann Neurol 1988;23:138–144. [DOI] [PubMed] [Google Scholar]
- 5.Stern Y. What is cognitive reserve? Theory and research application of the reserve concept. J Int Neuropsychol Soc 2002;8:448–460. [PubMed] [Google Scholar]
- 6.Stern Y. Cognitive reserve. Neuropsychologia 2009;47:2015–2028. [DOI] [PMC free article] [PubMed] [Google Scholar]
- 7.Bennett DA, Wilson RS, Schneider JA, et al. Education modifies the relation of AD pathology to level of cognitive function in older persons. Neurology 2003;60:1909–1915. [DOI] [PubMed] [Google Scholar]
- 8.Perneczky R, Wagenpfeil S, Lunetta KL, et al. Education attenuates the effect of medial temporal lobe atrophy on cognitive function in Alzheimer's disease: The MIRAGE Study. J Alzheimers Dis 2009;17:855–862. [DOI] [PMC free article] [PubMed] [Google Scholar]
- 9.Stern Y, Alexander GE, Prohovnik I, Mayeux R. Inverse relationship between education and parietotemporal perfusion deficit in Alzheimer's disease. Ann Neurol 1992;32:371–375. [DOI] [PubMed] [Google Scholar]
- 10.Perneczky R, Diehl-Schmid J, Drzezga A, Kurz A. Brain reserve capacity in frontotemporal dementia: a voxel-based 18F-FDG PET study. Eur J Nucl Med Mol Imaging 2007;34:1082–1087. [DOI] [PubMed] [Google Scholar]
- 11.Perneczky R, Diehl-Schmid J, Pohl C, Drzezga A, Kurz A. Non-fluent progressive aphasia: cerebral metabolic patterns and brain reserve. Brain Res 2007;1133:178–185. [DOI] [PubMed] [Google Scholar]
- 12.Perneczky R, Drzezga A, Diehl-Schmid J, et al. Schooling mediates brain reserve in Alzheimer's disease: findings of fluoro-deoxy-glucose-positron emission tomography. J Neurol Neurosurg Psychiatry 2006;77:1060–1063. [DOI] [PMC free article] [PubMed] [Google Scholar]
- 13.Perneczky R, Haussermann P, Diehl-Schmid J, et al. Metabolic correlates of brain reserve in dementia with Lewy bodies: an FDG PET study. Dement Geriatr Cogn Disord 2007;23:416–422. [DOI] [PubMed] [Google Scholar]
- 14.Edland SD, Xu Y, Plevak M, et al. Total intracranial volume: normative values and lack of association with Alzheimer's disease. Neurology 2002;59:272–274. [DOI] [PubMed] [Google Scholar]
- 15.Jenkins R, Fox NC, Rossor AM, Harvey RJ, Rossor MN. Intracranial volume and Alzheimer disease: evidence against the cerebral reserve hypothesis. Arch Neurol 2000;57:220–224. [DOI] [PubMed] [Google Scholar]
- 16.Staff RT, Murray AD, Deary IJ, Whalley LJ. What provides cerebral reserve? Brain 2004;127:1191–1199. [DOI] [PubMed] [Google Scholar]
- 17.Reynolds MD, Johnston JM, Dodge HH, DeKosky ST, Ganguli M. Small head size is related to low Mini-Mental State Examination scores in a community sample of nondemented older adults. Neurology 1999;53:228–229. [DOI] [PubMed] [Google Scholar]
- 18.Tisserand DJ, Bosma H, Van Boxtel MP, Jolles J. Head size and cognitive ability in nondemented older adults are related. Neurology 2001;56:969–971. [DOI] [PubMed] [Google Scholar]
- 19.Gale CR, Walton S, Martyn CN. Foetal and postnatal head growth and risk of cognitive decline in old age. Brain 2003;126:2273–2278. [DOI] [PubMed] [Google Scholar]
- 20.Schofield PW, Logroscino G, Andrews HF, Albert S, Stern Y. An association between head circumference and Alzheimer's disease in a population-based study of aging and dementia. Neurology 1997;49:30–37. [DOI] [PubMed] [Google Scholar]
- 21.Kim JM, Stewart R, Shin IS, Kim SW, Yang SJ, Yoon JS. Associations between head circumference, leg length and dementia in a Korean population. Int J Geriatr Psychiatry 2008;23:41–48. [DOI] [PubMed] [Google Scholar]
- 22.Bickel H, Riemenschneider M, Kurz A. [Associations between dementia and head circumference as a measure of brain reserve: results from the Bavarian School Sisters Study.] Psychiatr Prax 2006;33:138–144. [DOI] [PubMed] [Google Scholar]
- 23.Mortimer JA, Snowdon DA, Markesbery WR. Head circumference, education and risk of dementia: findings from the Nun Study. J Clin Exp Neuropsychol 2003;25:671–679. [DOI] [PubMed] [Google Scholar]
- 24.Mortimer JA, Borenstein AR, Gosche KM, Snowdon DA. Very early detection of Alzheimer neuropathology and the role of brain reserve in modifying its clinical expression. J Geriatr Psychiatry Neurol 2005;18:218–223. [DOI] [PMC free article] [PubMed] [Google Scholar]
- 25.Wolf H, Julin P, Gertz HJ, Winblad B, Wahlund LO. Intracranial volume in mild cognitive impairment, Alzheimer's disease and vascular dementia: evidence for brain reserve? Int J Geriatr Psychiatry 2004;19:995–1007. [DOI] [PubMed] [Google Scholar]
- 26.Borenstein AR, Wu Y, Mortimer JA, et al. Developmental and vascular risk factors for Alzheimer's disease. Neurobiol Aging 2005;26:325–334. [DOI] [PubMed] [Google Scholar]
- 27.Demissie S, Green RC, Mucci L, et al. Reliability of information collected by proxy in family studies of Alzheimer's disease. Neuroepidemiology 2001;20:105–111. [DOI] [PubMed] [Google Scholar]
- 28.McKhann G, Drachman D, Folstein M, Katzman R, Price D, Stadlan EM. Clinical diagnosis of Alzheimer's disease: report of the NINCDS-ADRDA Work Group under the auspices of Department of Health and Human Services Task Force on Alzheimer's Disease. Neurology 1984;34:939–944. [DOI] [PubMed] [Google Scholar]
- 29.Folstein MF, Folstein SE, McHugh PR. “Mini-mental state”: a practical method for grading the cognitive state of patients for the clinician. J Psychiatr Res 1975;12:189–198. [DOI] [PubMed] [Google Scholar]
- 30.Perneczky R, Wagenpfeil S, Komossa K, Grimmer T, Diehl J, Kurz A. Mapping scores onto stages: mini-mental state examination and clinical dementia rating. Am J Geriatr Psychiatry 2006;14:139–144. [DOI] [PubMed] [Google Scholar]
- 31.Lunetta KL, Erlich PM, Cuenco KT, et al. Heritability of magnetic resonance imaging (MRI) traits in Alzheimer disease cases and their siblings in the MIRAGE study. Alzheimer Dis Assoc Disord 2007;21:85–91. [DOI] [PubMed] [Google Scholar]
- 32.Rhys Davies R, Scahill V, Graham A, Williams G, Graham K, Hodges J. Development of an MRI scale for multiple brain regions: comparison with volumetrics and with voxel-based morphometry. Neuroradiology 2008;51:491–503. [DOI] [PubMed] [Google Scholar]
- 33.Wenham PR, Price WH, Blandell G. Apolipoprotein E genotyping by one-stage PCR. Lancet 1991;337:1158–1159. [DOI] [PubMed] [Google Scholar]
- 34.Schofield PW, Mosesson RE, Stern Y, Mayeux R. The age at onset of Alzheimer's disease and an intracranial area measurement: a relationship. Arch Neurol 1995;52:95–98. [DOI] [PubMed] [Google Scholar]
- 35.Borenstein Graves A, Mortimer JA, Bowen JD, et al. Head circumference and incident Alzheimer's disease: modification by apolipoprotein E. Neurology 2001;57:1453–1460. [DOI] [PubMed] [Google Scholar]
- 36.Sinclair D, Dangerfield P. Human Growth After Birth, 6th ed. Oxford: Oxford University Press; 1998. [Google Scholar]
- 37.Haug H. Brain sizes, surfaces, and neuronal sizes of the cortex cerebri: a stereological investigation of man and his variability and a comparison with some mammals (primates, whales, marsupials, insectivores, and one elephant). Am J Anat 1987;180:126–142. [DOI] [PubMed] [Google Scholar]
- 38.Wolf H, Kruggel F, Hensel A, Wahlund LO, Arendt T, Gertz HJ. The relationship between head size and intracranial volume in elderly subjects. Brain Res 2003;973:74–80. [DOI] [PubMed] [Google Scholar]
- 39.Cheong JL, Hunt RW, Anderson PJ, et al. Head growth in preterm infants: correlation with magnetic resonance imaging and neurodevelopmental outcome. Pediatrics 2008;121:e1534–e1540. [DOI] [PubMed] [Google Scholar]
- 40.Morris J, McKeel D, Fulling K, Torack R, Berg L. Validation of clinical diagnostic criteria for Alzheimer's disease. Ann Neurol 1988;24:17–22. [DOI] [PubMed] [Google Scholar]
Associated Data
This section collects any data citations, data availability statements, or supplementary materials included in this article.