

Abstract
Structural changes in limbic regions are often observed in individuals with temporal lobe epilepsy (TLE) and in animal models. However, the brain structural changes during the evolution into epilepsy remain largely unknown. Therefore, the purpose of this study is to define the temporal changes in limbic structures after experimental status epilepticus (SE) during the latency period of epileptogenesis in vivo, with quantitative diffusion tensor imaging (DTI) and T2 relaxometry in an animal model of chronic TLE. A pair of fifty micron electrodes was implanted into the ventral hippocampus in twelve male adult rats. Self-sustaining SE was induced with electrical stimulation in eleven rats. Three rats served as age-matched controls. In vivo diffusion tensor and T2 magnetic resonance imaging (MRI) was performed at 11.1 Tesla, pre- and post-implantation of electrodes and 3, 5, 7, 10, 20, 40 and 60 days post-SE to assess structural changes. Spontaneous seizures were identified with continuous time-locked video-monitoring. Following imaging in vivo, fixed, excised brains were MR imaged at 17.6 Tesla. Subsequently, histological analysis was correlated with MRI results. Following SE, 8/11 injured rats developed spontaneous seizures. Unique to these 8 rats, early T2, diffusivity and anisotropy changes were observed in vivo within the parahippocampal gyrus (contralateral) and fimbria (bilateral). In excised brains, bilateral increase in anisotropy was observed in the dentate gyrus, corresponding to mossy fiber sprouting as determined by Timm staining. Using T2 relaxometry and DTI, specific transient and long-term structural changes were observed only in rats that developed spontaneous limbic seizures.
Keywords: Temporal Lobe Epilepsy, Epileptogenesis, Status Epilepticus, Diffusion Tensor Imaging, Relaxation, Magnetic Resonance Imaging, Epilepsy Animal Models, Parahippocampal gyrus, Hippocampus
INTRODUCTION
More than fifty million people worldwide have epilepsy with an incidence rate of about 50 per 100,000 in developed countries (Hauser, et al., 1993; Sander, 2003). The most common medically intractable form of partial epilepsy is temporal lobe epilepsy (TLE). Some known causes for acquired TLE include brain trauma, head injury, brain infection, and status epilepticus (SE). In each of these causes, a delay often exists between an initial precipitating event and the subsequent manifestation of epileptic behavior, known as the latency period of epileptogenesis (Arzimanoglou, et al., 2002). However, not all individuals that incur a known precipitating event such as brain injury or prolonged SE go on to develop spontaneous seizures following the latency period. Various mechanisms of epileptogenesis in TLE have been studied in individuals and animal models of TLE, and are often associated with mesial hippocampal sclerosis. However, there is evidence that mesial TLE involves not only the hippocampus, but also incorporates a larger epileptic network (Nair, et al., 2004), such as the entorhinal cortex, piriform cortex, amygdala, and medial thalamus (Fabene, et al., 2003; Zhong, et al., 1993). Nevertheless, a large number of target mechanisms of epileptogenesis have been identified that might become substrates for the development of a reliable biomarker. Despite this, very few longitudinal studies have been performed (Whitwell, 2008), and even fewer studies have looked at structural differences after SE, either in patients or experimental animals between spontaneously seizing and non-seizing subjects. Indeed, a reliable structural biomarker for epileptogenesis could greatly improve both the early diagnosis and treatment of epilepsy in individuals (Whitwell, 2008). These biomarkers should not only identify the presence of an early structural abnormality, but measure its severity relative to the normal brain, and also predict the early onset of epileptic seizures.
The development of recurrent spontaneous seizures, for example after an episode of SE in patients, may take from a few months to several years, thereby making it difficult to study the temporal evolution of a large number of structures. Therefore, animal models that mimic the behavioral and neurophysiological features of human epilepsy provide an excellent alternative. The self-sustaining SE rat model (chronic limbic epilepsy, CLE) is of particular interest, since it exhibits both spontaneous recurrent limbic seizures, as well as the latency period between an acute SE injury and the onset of spontaneous recurrent seizures of chronic epilepsy. After a period of 2 to 8 weeks post-SE, the animals begin to have recurrent spontaneous seizures (Bertram and Cornett, 1993; Bertram and Cornett, 1994; Lothman, et al., 1989). Studies performed on this model have shown very similar pathophysiology and EEG patterns (Nair, et al., 2009) relative to humans with TLE. Furthermore, the CLE rat model exhibits “pharmacoresistance” to conventional anticonvulsants, which is another feature of some patients with chronic TLE (Nair, et al., 2007). Despite the similarities, there are differences between human TLE and the CLE animal model. For instance, widespread bilateral neuronal damage is observed post-SE in this animal model, but such widespread structural damage is seldom reported with conventional, 1.5 Tesla (T) magnetic resonance imaging (MRI). Although the CLE model of TLE does not capture all the diverse structural features of human TLE, it remains and excellent test bed for studying epileptogenesis and epilepsy.
MRI is one of the most powerful tools for monitoring structural changes longitudinally. MRI provides the “gold standard” for non-invasive visualization and analysis of structural changes and is one of the primary diagnostic tools used for early clinical diagnosis of epilepsy. In addition, diffusion-weighted MR imaging (DWI) has proven to be more sensitive to neuronal damage then conventional T1- and T2-weighted imaging (Rugg-Gunn, et al., 2001; Wall, et al., 2000). The contrast in DWI depends on the translational diffusion of water molecules due to Brownian motion (LeBihan, et al., 1986). Measurements of DWI’s in multiple diffusion-weighting directions can be modeled as rank-2 diffusion tensor images (DTI), which provides the magnitude (diffusivity) and the directionality (anisotropy) of molecular displacement (Pierpaoli, et al., 1996). This model can be used to visualize anisotropy within the tissue and to track fiber bundles, which facilitates the study of white matter interconnections between gray matter regions. DTI studies of patients have shown bilateral abnormalities in both average diffusivity (AD) and fractional anisotropy (FA) after the onset of spontaneous seizures (Concha, et al., 2009; Concha, et al., 2005; Gong, et al., 2008; Kim, et al., 2008).
In search for a reliable latency-period biomarker to predict the development of seizures, we asked whether there are specific underlying structural changes in animals that develop spontaneous seizures. Therefore, we explored high-resolution quantitative T2 measurements and DTI as possible methods to use for the assessment of specific (mechanistic) structural changes during early epileptogenesis prior to the onset of spontaneous seizures in the CLE rat model. In the work reported herein, injured rat brains were examined serially during the epileptogenesis latency period with in vivo MR imaging. Then, these results were correlated with higher resolution MR images of excised injured CLE and control rat brains and corresponding histology.
METHODS
Animal Preparation
The present study was approved by the University of Florida’s Institutional Animal Care and Use Committee (UF IACUC protocol #D710). Fourteen male, Sprague-Dawley rats (Harlan, Indianapolis, IN) were included in this study. The rats were given 72 hrs to acclimate to 12/12-hr light/dark cycle and weighed 302 ± 66 g [mean ± standard deviation (SD)] at the time of surgery. All surgeries were done with 10 mg/kg subcutaneous injection of Xylazine (Phoenix Pharmaceutical, St. Joseph, MO) and anesthesia maintained with 1.0–1.5 % isoflurane (MINRAD, Bethlehem, PA) in 0.4 L/min O2. Twelve rats were stereotaxically implanted in the right ventral hippocampus (−5.3 mm posterior, 4.9 mm lateral (right) of Bregma, 5 mm ventral) with a pair of 50 micron diameter polyamide coated tungsten microwire electrodes (Plastics One, Roanoke VA). These electrodes were permanently secured with Cranioplast cement (Plastics One, Roanoke VA) which was anchored to 4 short plastic screws driven into the skull. The rats were given at least 72 hrs to recover after which the microwire placement was verified using MRI. Two other rats did not undergo any surgical procedures and served as naïve age-matched controls. Previous studies performed by Bertram’s group have shown, histologically, that no structural damage is observed in the brains post implantation of electrodes (Bertram, 1997; Bertram, et al., 1990; Mathern, et al., 1997). In addition, chronic video-EEG studies in sham age-matched control rats, performed previously by us, indicate that the electrode placement does not contribute to spontaneous seizures, (Nair, et al., 2009; Sanchez, et al., 2006a; Sanchez, et al., 2006b; Simonotto, et al., 2006; Talathi, et al., 2009). Furthermore, we have not observed any structural changes either histologically or with excised brain MRI in control animals within three months after electrode implantation (Sanchez, et al., 2006b; Talathi, et al., 2009). These findings were further confirmed in this study, where one of the twelve rats implanted with electrodes was not stimulated and served as a sham age-matched control.
Induction of Self-Sustaining Status Epilepticus by Hippocampal Electrical Stimulation
Following a delay of 7–14 days post electrode implantation, rats (n = 11) were electrically stimulated to induce self-sustaining SE. Afterdischarge thresholds were determined as the current required to elicit wet dog shakes. These threshold values were doubled and a suprathreshold stimulus of 323 ± 142 µA was delivered to the implanted electrodes for 81 ± 24 min using 10 s pulse trains of 20 ms period, 1 ms pulse duration, and biphasic square waves with a 2 s delay between pulse trains (Lothman, et al., 1989). The animals demonstrated “wet dog shakes” and seized during the stimulation procedure. Duration of SE is a major factor in determining the severity of structural changes (Fujikawa, 1996). However, so as not to confound the results, no anticonvulsant drugs were administered in this study to control for the length of SE post-stimulation. Even without controlling the length of SE, none of the rats displayed continuous seizure-like behavioral activity for over 2 hours, but displayed intermittent seizure-like behavior lasting up to 8 hours. No correlation was found between duration of behavioral seizures during SE, as seen by continuous behavioral video recordings, and onset of spontaneous seizures.
Video Monitoring
To monitor the presence and severity of seizures, the behavior of the animals was continuously video monitored starting 12 days post-induction of SE and continued for an additional 48 days. Seizure detection was performed by visual inspection of the continuous video recordings. A modified Racine scale (Borowicz and Czuczwar, 2003; Racine, 1972) was used to grade the behavioral seizures as follows: grade 0 for no seizure response; grade 1 for immobility, eye closure, ear twitching, twitching of vibrissae, sniffing, facial clonus; grade 2 for head nodding associated with more severe facial clonus; grade 3 for clonus of one forelimb; grade 3.5 for bilateral forelimb clonus without rearing; grade 4 for bilateral forelimb clonus with rearing; grade 4.5 for falling on a side (without rearing), loss of righting reflex accompanied by generalized clonic seizures; grade 5 for rearing and falling on the back accompanied by generalized clonic seizures.. Two blinded investigators (WN, MBP) in this study analyzed all the behavioral videos in order to be certain that no Racine grade 3–5 spontaneous seizures were missed.
Magnetic Resonance Imaging
In-vivo Imaging
Temporal changes in the rat brains were monitored with MRI prior to electrode implantation, post-electrode implantation, and at days 3, 5, 7, 10, 20, 40 and 60 post-SE, using an 11.1 Tesla, 40cm horizontal bore magnet (Magnex Scientific, Abingdon, UK) and a Bruker Advance console (Bruker NMR Instruments, Inc., Billerica, MA). The rats were initially anesthetized with 4 % Isoflurane in 2.0 L/min O2 at and 4 mg/kg of Xylazine was injected subcutaneously, along with 2 mL of lactated Ringers solution (Hospira, Lake Forrest, IL) to maintain the physical condition of the rats during the extended MRI scans. Each rat was placed in a prone position, in a custom made MRI compatible stereotaxic frame and cradle, to allow repeatable positioning and minimize motion artifacts. In the magnet, anesthesia was maintained with 1.5 – 2.0 % Isoflurane in O2 at 1 L/min. Respiration and temperature were monitored and physiological temperature was maintained using heated air flowing over the animal (SA Instruments, Stony Brook, NY). Magnetic resonance was measured using a custom-built, saddle-shaped 470 MHz coil, for both excitation and detection, positioned on top of the rat’s head and centered over the brain.
To adjust the position of the image field-of-view (FOV), three-axis pilot images were acquired with 8-fold segmented phase encoding, recovery time (TR) of 1000 ms, echo time (TE) of 7 ms, FOV of 50 × 50 × 10 mm, matrix size of 198 × 128 with 10, 1 mm thick slices, spectral width of 90 kHz and 4 averages. Then, coronal diffusion-weighted scans were collected with a TR = 1500 ms, TE = 30 ms, 1 average, diffusion-weighting gradient pulse separation time (Δ) of 17.65 ms, diffusion-weighting graduate pulse duration (δ) of 4.8 ms, and spectral width of 55 kHz. Twelve contiguous slices of 0.9 mm thickness were imaged with a FOV of 30 mm × 30 mm and matrix size of 100 × 100. Low-diffusion-weighted image data sets (diffusion weighting of 100 s/mm2) were acquired in 6 directions, defined by the tessellation of an icosahedron on the surface of a unit hemisphere, and high-diffusion-weighted image data sets (diffusion weighting value of 800 s/mm2) were acquired in 21 directions, determined from the level 1 triangular subdivision of an icosahedron tessellated onto the surface of a unit hemisphere. In addition, a series of T2-weighted spin echo coronal scans were acquired with variable TE = 15, 30, 45, 60, 75 ms and TR = 2000ms, 2 averages and spectral width of 70 kHz in 9, 1 mm thick slices with 1.5 mm distance between slice centers, and a FOV of 30 × 30 mm in a matrix of 100 × 100.
Excised Imaging
After the 60 day post-SE MRI measurement, rats were transcardially perfused with fixative, according to Timm’s fixation protocol (Nairismagi, et al., 2004). The electrodes were removed and, the brains were extracted and kept in 10% formalin. Prior to MR imaging, the excised brains were washed for 24 hrs with phosphate buffered saline (PBS), then placed in a 20 mm tube containing Fluorinert (3M, St. Paul, MN). All images were acquired using a Bruker 17.6 T, 89 mm vertical bore magnet and Advance console. Coronal diffusion-weighted scans were acquired with a TR = 1400 ms, TE = 28 ms, Δ = 17.5 ms, δ = 1.5ms, spectral width of 62 kHz. Thirty-two contiguous slices of 0.3 mm thickness were acquired with a FOV of 18 mm × 15 mm and matrix size of 120 × 100. Low-diffusion-weighted image data sets (diffusion weighting of 100 s/mm2) were acquired in 6 directions defined by the tessellation of an icosahedron on a unit hemisphere, and high-diffusion-weighted image data sets (diffusion weighting value of 1250 s/mm2) were acquired in 46 directions determined from the level-2 triangular subdivision of an icosahedron tessellated onto the surface of a unit hemisphere. A series of T2-weighted spin echo coronal scans were acquired with variable TE = 15, 30, 45, 60, 75 ms and TR = 3000 ms, 2 averages and spectral width of 44 kHz in 9, 0.5 mm thick slices, with 0.6 mm distance between slice centers, in a FOV of 36 × 18 mm using a 128 × 128 matrix.
MR Image Analysis
All MR images were processed with in-house software written in Interactive Data Language (IDL) (ITT Boulder, CO). First rigid-body motion correction, using a mutual information algorithm (Viola and Wells Iii, 1997), was performed for both the DWIs and T2 measurements to minimize motion artifacts apparent during imaging. A rigid-body motion correction was applied to each slice in the diffusion-weighted data set, using the first low b-value scan as the reference, and the variable TE data set, using the 15 ms TE scan as the reference. Then for DWIs, the log of the image intensity for each voxel was linearly fit to a rank-2 tensor model of diffusion (i.e. DTI) as a function of the diffusion weighting, and the AD and FA values were calculated from the resulting tensor (Basser, 1995). The T2, AD, and FA values were quantified for selected regions-of-interest (ROIs). These ROIs were chosen bilaterally in the CA3, CA1 and dentate gyrus subfields of the hippocampus, the whole hippocampus, fimbria, amygdala, dorsal thalamus, piriform, and entorhinal cortices (see Fig. 1) using a standard atlas (Paxinos and Watson, 1982) to guide ROI selection. All slices containing the ROI in an anatomical structure were included to provide a quantitative assessment of AD and FA within the ROI volume. T2 values were calculated by fitting a monoexponential function to the averaged ROI signal for each scan in the variable TE data sets, using the Levenberg-Marquardt algorithm to find the least-squares solution.
Figure 1. Regions of Interest for DTI Images In Vivo.

Part A) Representative AD images in approximately the same slice from one rat at different time points where L indicates the left hemisphere (contralateral to injury), P is post-implantation. Parts B and C) FA and T2 images respectively. The regions-of-interest are 1- Left hippocampus, 2 – right CA1, 3 – right CA3, 4 – right dentate gyrus, 5 – left fimbria, 6 – right amygdala, 7 – right piriform cortex, 8 – right entorhinal cortex, 9 – left thalamus. All ROI’s were included bilaterally.
Statistical Analysis
The animals were divided into three groups. The control group (n = 3) consisted of both age-matched naïve controls (n=2) as well as a sham control that underwent the same imaging procedures as above. The spontaneous seizure (SS) group (n = 8) consisted of all the animals that underwent an episode of self-sustaining SE and developed Racine grade 3–5, behavioral spontaneous limbic seizures. The non-seizure (NS) group (n = 3) consisted of all the animals that underwent an episode of self-sustaining SE, but in which no overt Racine grade behavioral spontaneous seizures were observed. Preliminary analysis of the results from the injury group showed that T2, AD, and FA changes in all SS rats post-SE fell into three general phases: 1) the acute phase, included MR imaging sessions at days 3 and 5 post-SE; 2) the latent phase, included MR imaging sessions between 5 days post-SE and before the onset of spontaneous seizures; and 3) the chronic phase, included MR imaging sessions after the onset of spontaneous seizures to 60 days post-SE. One of the eight SS rats died shortly after a spontaneous seizure at day 13 post-SE. MRI data from this rat was included in our analysis of acute time-point and latent period time-point sets. The NS group was divided into only two phases, acute and latent, since no spontaneous seizures were observed. These groupings were used to organize the in vivo data and perform statistical comparisons. Results from each of the imaging sessions were averaged within a phase. Each of the phases for SS rats (n = 8) and NS rats (n = 3) was compared to average pre-implant data (n = 14) to account for variations between animals using the Mann-Whitney U test (results presented in Table 1 and Fig. 2). For excised data, control rats data (n = 3) was compared to the SS rats (n = 4 for AD and FA, and n = 8 for T2 relaxation times) and the NS rats (n = 3). The left and the right hemispheres were also compared in the control rats using the Wilcoxon test. The Mann-Whitney U test and the Wilcoxon test were calculated in R (The R Foundation for Statistical Computing, Vienna, Austria) to compare each of the groups.
Table 1. Percent Change in AD and FA During the Acute Phase (day 3 and 5 post-SE) in Non-seizing Rats Compared to Pre-Implant Values from All Rats.
Column 1 indicates the anatomical location of the region of interest. Columns 2 and 4 show quantitative average pre-implant values of AD and FA from all rats, in the regions of interest. Columns 3 and 5 (NS – non-seizing rat) are percent difference in AD and FA during the acute phase (days 3 and 5 post-SE) of rats in which no spontaneous seizures were observed. For abbreviation of anatomical structures, see Fig. 2.
| Average Diffusivity | Fractional Anisotropy | |||
|---|---|---|---|---|
| Pre-implant (mm2/s) |
% Change in NS rats Acute Phase |
Pre-implant | % Change in NS rats Acute Phase |
|
| L_Hipp | 8.20E-04 | −4.61% | 2.51E-01 | 2.53% |
| R_Hipp | 7.95E-04 | * −7.38% | 2.48E-01 | * 11.02% |
| L_Amy | 7.36E-04 | −7.45% | 4.19E-01 | 0.74% |
| R_Amy | 7.64E-04 | −3.22% | 4.05E-01 | 0.88% |
| L_Pir | 7.77E-04 | −4.10% | 3.54E-01 | 6.35% |
| R_Pir | 7.67E-04 | −1.58% | 3.86E-01 | 1.17% |
| L_Ent | 7.77E-04 | −1.87% | 3.69E-01 | 8.18% |
| R_Ent | 7.97E-04 | −7.94% | 3.48E-01 | 9.59% |
| L_Fim | 8.48E-04 | −6.88% | 5.96E-01 | 1.59% |
| R_Fim | 8.35E-04 | −9.03% | 5.99E-01 | 1.77% |
statistically significant difference using the Mann-Whitney U test (p < 0.05).
Figure 2. Temporal Changes in T2 and Diffusion Parameters of SS rats.

Parts A, B and C are graphs of AD, FA and T2 values respectively for pre-implant (black bar) average calculated from all rats, acute (white bar), latent (cross-hatched bar) and chronic (gray bar) phases post-SE from SS rats. Asterisks mark statistically significant differences (p < 0.05) based on the Mann-Whitney U test comparing data for each of the three phases to the pre-implant group data. Labels: Left hippocampus (L_Hipp), Right hippocampus (R_Hipp), left CA1 (L_CA1), right CA1 (R_CA1), left CA3 (L_CA3), right CA3 (R_CA3), left dentate gyrus (L_DG), right dentate gyrus (R_DG), right fimbria (R_Fim), left fimbria (L_Fim), left amygdala (L_Amy), right amygdala (R_Amy), left entorhinal cortex (L_Ent), right entorhinal cortex (R_Ent), left piriform cortex (L_Pir), right piriform cortex (R_Pir), left thalamus (L_Tha), right thalamus (R_Tha).
Histology
After MR imaging, the excised rat brains were cryoprotected in a 30% sucrose PBS solution for 24–48 hrs then sectioned frozen at 50 µm with a sliding microtome. Every sixth section in succession was stained with Timm’s, Fluoro Jade C (FJC), Black Gold II, glial fibrillary acidic protein (GFAP), microglial (CD68 antibody), and Perl stain. All chemical reagents for histology were purchased from Sigma Chemicals Co., (St. Louis, MO) unless otherwise noted.
Timms staining was performed using the Timm sulfide silver method (Danscher, 1981) to assess mossy fiber sprouting. In order to assess changes in myelin, the slides were stained with 0.2% Black Gold II (Schmued and Slikker, 1999). FJC staining (Schmued, et al., 2005) was used to visualize degenerating neurons. Some sections were stained using a modified Bielschowsky method (Yamamoto and Hirano, 1986) to assess degenerating neurons. Mounted sections were incubated in 20% silver nitrate solution for 15 min followed by incubation in silver nitrate/ammonium hydroxide solution in the dark for 15 min. For pathological visualization of iron, sections were incubated in Perl’s solution. Most sections were counterstained with Cresyl Violet. Sections were dehydrated and coverslipped with Eukitt (Calibrated Instruments, Ardsley, NY). Astrocytosis was assessed using GFAP immunohistochemistry. Free-floating sections were incubated overnight in a 1:400 solution of a primary monoclonal anti-GFAP clone, G-A-5 in PBS. Free-floating sections were placed in 1:500 solution of mouse anti-rat-CD68 (AbD Serotec, Raleigh, NC) in PBS for microglial staining. Sections were washed and incubated overnight in 1:10,000 anti-mouse immunoglobulin G, followed by incubation in a 1:1,000 Extravidin peroxidase solution for two hrs. A reaction with 0.05% 3,3'-Diaminobenzidine (DAB) in a 0.0012% hydrogen peroxide in PBS was performed for coloration.
RESULTS
Behavioral Analysis
Using the modified Racine scale to quantify behavior, animals were observed to be in self-sustaining SE for between 30–45 min during and after electrical stimulation. Intermittent residual seizure-like activity, seen as wet-dog shakes, head bobbing and occasional Racine grade 3–5 seizures were observed for up to 2 hrs, and for as long as 8 hrs post electrical stimulation. Since non-continuous electroencephalograms were performed during electrical stimulation, we cannot exclude the possibility of variable duration and severity of SE electrographically. However, no correlation was found between either, SE behavioral seizures duration, or residual seizure activity duration, and the onset of spontaneous seizures. No anticonvulsant drugs were administered post-SE so as not to confound the results.
Spontaneous seizures were observed in 8/11 (73%) stimulated rats, which is similar to results of previous studies (Lothman, et al., 1990; Talathi, et al., 2009). The SS rats exhibited seizures between grades 3 and 5 on the Racine scale and started seizing at 23.5 ± 10.7 days post-SE. Seven of 8 spontaneously seizing rats had < 1 seizure per day for the time observed. Only 1 of the 8 rats seized with high frequency (>2 seizures/day) for the first two weeks after onset of spontaneous seizures, but no seizures were observed in this rat beyond 31 days post-SE. The majority of observed behavioral spontaneous seizures lasted 30 to 45 seconds. No Racine grade 3–5 spontaneous seizures were observed in the remaining 3 rats. However, we cannot exclude the possibility that the non-seizure group may have had shorter and smaller Racine grade spontaneous seizures that were difficult to observe with visual inspection of behavior alone. However, a recent study published by our group, using long-term time-locked video-EEG recordings reported similar spontaneous seizure onset times and average Racine grades and length of seizures (Talathi, et al., 2009).
In-vivo MR imaging
The measured pre-implant T2, AD, and FA values in this study are comparable to those previously published for rats (de Graaf, et al., 2006; Jansen, et al., 2008; Nakasu, et al., 1995a; Nakasu, et al., 1995b; Wall, et al., 2000). No temporal changes in any of the ROI’s were observed in the naive control and the sham controls (except at the site of electrode implantation in sham controls) for the entire period of the study (pre- and post-electrode implantation, and days 3, 5, 7, 10, 20, 40 and 60 days post-SE), indicating a low variability over time and imaging sessions in a given rat. From pre-implant images, the calculated T2 and AD variability was found to be low (3.70 ± 1.26% and 10.33 ± 2.5% respectively), but the calculated FA values had a larger variability of 25.1 ± 2.1%. This large variation in FA was the result of temporary poor pre-amplifier performance on the MR system, but after the pre-amplifier problem was fixed, the standard deviation of FA for the remaining rats showed a significant reduction (average SD: 13.5%). So as not to confound the results, the average and standard deviation from all pre-implant FA values, including those acquired with the poorly performing amplifier, were used in the statistical analysis. No significant differences were observed in T2, AD and FA between the left and the right hemispheres in the naïve and sham control rats, except (as expected) at the site of electrode placement in the sham control group.
Acute Phase for Both Non-seizure and Spontaneous Seizure Groups
AD, T2 and FA changes were observed in the hippocampi of both the NS and SS rats during the acute phase. In particular, the ipsilateral (right) hippocampus of the three NS rats showed a statistically significant decrease in AD and T2, and an increase in FA, during the acute phase (Table 1). However the T2, AD, and FA returned to baseline by day 7 post-SE and remained at baseline throughout the rest of the time course of this study. Also, during the acute phase, the eight SS rats showed a significant decrease in AD within the ipsilateral dentate gyrus, CA1 and CA3 (−12.0%, −8.7% and −10.0% respectively, Fig. 2A), and within the contralateral dentate gyrus and CA1 (−9.1% and −13.5% respectively). An increase in FA was also observed in the ipsilateral CA1 (24.5%). In addition, a significant decrease in T2 was observed bilaterally in the hippocampal dentate gyrus and CA1 in the SS rats (Fig. 2C).
Despite similar acute changes observed in the hippocampus of all 11 rats (i.e. both NS and SS), only the eight SS rats showed specific changes in the parahippocampal gyrus during the acute phase. These eight SS rats showed a significant increase in AD in the contralateral amygdala, entorhinal cortex and piriform cortex (8.8%, 7.4% and 16.4% respectively, Fig. 1A and Fig. 2A). In one SS rat, a significant increase in AD and T2 was observed bilaterally, in both the amygdala and the piriform cortex. In all eight SS rats, a reduction in FA was also observed in the contralateral entorhinal cortex and piriform cortex (−27.4% and −24.5% respectively, Fig. 2B) during the acute phase. In addition to these parahippocampal changes in the SS rats, a substantial and significant decrease in FA was observed in the fimbria/fornix (−15.4% R, and −18.9% L, Fig. 2B), and the ipsilateral fimbria showed decreased T2 relaxation (−5.5%, Fig. 2C) during the acute phase.
Latent and Chronic Phases for Spontaneous Seizure Group
After the acute phase, all the MR parameters returned to normal values in the NS rats. In the SS rats, acute changes seen in the hippocampus and its subfields recovered by day 7 post-SE, but a further increase of AD in the hippocampi was observed bilaterally (19.0% R, and 21.0% L, Fig. 2A) after the onset of spontaneous seizures. An increase in FA was observed in the ipsilateral hippocampus (17.5%, Fig. 2B) during the latent period and in both hippocampi (23.5% R, and 20.2% L) after onset of spontaneous seizures. After the onset of spontaneous seizures, T2 relaxation times also lengthened bilaterally in the CA3 (16.2% ipsilateral and 17.7% contralateral, Fig. 2C). The decrease in FA in the fimbria observed during the acute phase remained low through the rest of the experiment, and no significant change was observed between the three phases (acute, latent and chronic, Fig. 2B). In additions, a significant increase in AD was observed after the onset of spontaneous seizures in the fimbria, bilaterally (14.9% R and 10.4% L).
Further changes were observed in the parahippocampal gyrus during the latent and chronic phases. A significant increase in AD was seen in the contralateral amygdala, entorhinal cortex and piriform cortex (6.2%, 11.2% and 32.4% respectively) during the latent period that remained elevated after the onset of spontaneous seizures (22.5%, 21.6% and 30.8% respectively, Fig. 1A and Fig. 2A). A corresponding lengthening of T2 (Fig. 1C and Fig. 2C) was observed in the contralateral amygdala (19.4%), piriform cortex (20.60%) and entorhinal cortex (29.3%). In addition, the FA was also significantly lower during the latent and chronic phases (−11.5% and −15.8% respectively) in the contralateral entorhinal cortex. In the dorsal thalamus, statistically significant reductions were seen in AD ipsilaterally (−6.8%) and T2 bilaterally (−4.4% R and −5.4% L), and the FA (24.3% R and 17.0% L) increased bilaterally, during the chronic phase.
Excised MR Imaging and Histology
Because MRI of the excised intact brains was acquired at a higher magnetic field, with better coil filling factor, and more signal averages than MRI in vivo, the resulting images had a higher resolution and signal-to-noise ratio. This allowed the visualization of the same anatomical structures seen in vivo but with better clarity (Fig. 3A). The AD and FA data from four SS rat brains was used for the statistical analysis. In addition, various brain-slice stains were used to provide histopathological correlation to the AD, FA and T2 changes seen both within the brain in vivo and in excised tissue.
Figure 3. DTI Images of Excised Rat Brain.
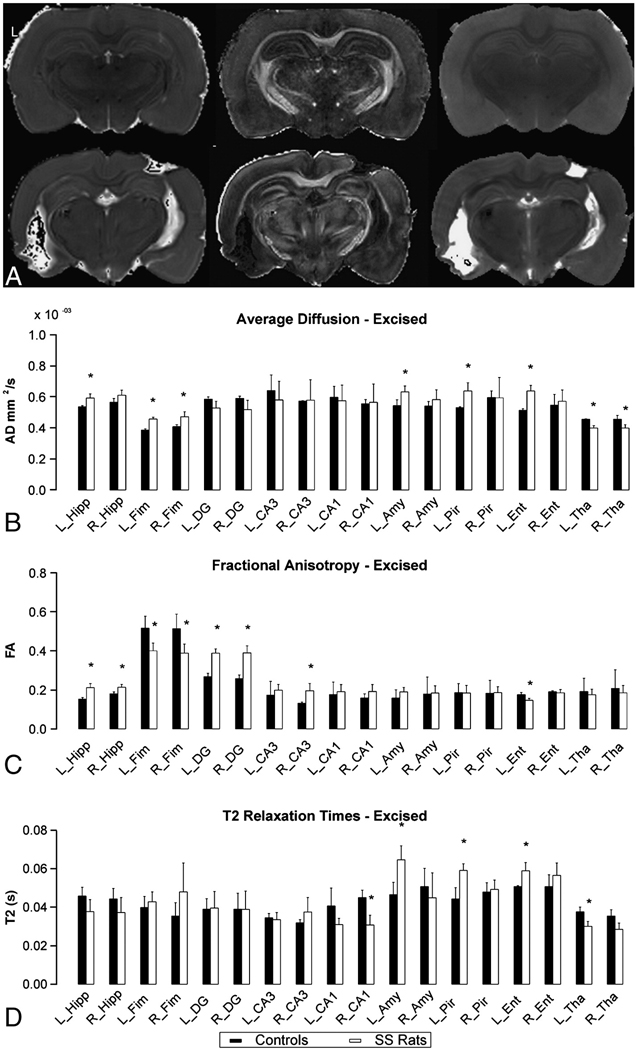
Part A) Excised 60 days post-SE images of a non-seizing rat (top row) and of a spontaneously seizing rat (bottom row), where L indicates the left hemisphere. The left column images are AD, the middle is FA and the right is T2 maps. Parts B, C, and D are graphs comparing AD, FA and T2 relaxation times of control rats (black bar) to spontaneously seizing rats (white rats). Asterisks mark statistically significant differences (p < 0.1) based on the Mann-Whitney U test comparing data from SS rats to data from control rats. For abbreviation of anatomical structures, see Fig. 2.
Hippocampal changes observed in both excised intact-brain MRI and histology correlated with changes observed in vivo. In the excised brain MRI, both AD and FA increased bilaterally in the hippocampus (AD, 10.3% L and 8.3% R; FA, 37.8% L and 18.0% R)(Figs. 3B and 3C). A trend towards shorter T2 times was observed in the hippocampus, however this did not reach statistical significance (Fig. 3D). Significant increases in AD and decreases in FA were observed bilaterally in the fimbria/fornix (AD, 18.6% L and 16.0% R; FA, −22.4% L and −24.4% R) (Figs. 3B and 3C). In CA1 (see Fig, 4A, white arrow), a trend towards decreased T2 was observed (only T2 change in the right CA1 reached statistical significance). These changes corresponded to ongoing neurodegeneration, as seen in FJC-stained slices (see Fig. 4B and at higher magnification in 4C). Black Gold staining of the same region (Fig. 4D, and at higher magnification in 4B) showed reduced myelin in CA1. In three SS rats, FJC positive cells were also observed in the CA3 pyramidal cell layer and in the dentate hilus of the contralateral hippocampus. GFAP-positive cells were also observed in CA1. Thinning of the fimbria was observed in all SS rats (for example, see Figs. 4B and 4D, black arrows) compared to control rats, which is consistent with reduction in FA in the fimbria/fornix seen in vivo (Fig. 2B) and excised imaging (Fig. 3A and 3C). Also the dorsal thalamus showed decreased AD and T2, both in vivo (Fig. 2A and 2C) and in excised-brain images (Figs. 4A, yellow arrow), which correlates to Perl’s staining showing deposition of iron (Fig. 4F) in this region. In addition, Perl’s staining illustrated the electrode pathway (Fig. 4G) within the hippocampus.
Figure 4. Degenerating Neurons and Myelin Loss Visualized with MR in Excised Brain Correlated with Histology.

Part A shows the T2 map of the dorsal hippocampus and the dorsal thalamus of a seizing rat. White arrowhead points to decreased T2 in the CA1 (top) and yellow arrowhead points to decreased T2 in the dorsal thalamus (bottom). Fluoro-Jade C staining in the contralateral hippocampus (part B) and in the 10× magnification of CA1 (part C) shows degenerating neurons. Black Gold staining in the contralateral hippocampus (part D) and in the 10× magnification of the CA1 region (part E) shows reduced myelin stain in the CA1 subfield. Part F shows iron deposition in the right dorsal thalamus. Part G shows Perl’s staining of iron deposition around the electrode track.
In SS rats, quantification of FA (Table 2) in the dentate gyrus of the excised brain showed significantly increased FA bilaterally (Fig. 5D, white arrowhead), compared to control rats (Fig. 5A, white arrowhead) and NS rats (Fig. 5C, white arrowhead). A similar increase in FA was observed in vivo in the ipsilateral dentate gyrus (14.6%) during the latent period and bilaterally (14.7% and 9% in the ipsilateral and contralateral DG respectively) after the onset of spontaneous seizures. However these FA changes in vivo did not reach statistical significance. Sprouting of the mossy fibers, from the granule cell layer to the inner molecular layer (Fig. 5E, black arrow), was observed with Timm’s staining. An increase in FA in one of the three NS rats was also observed in the dentate gyrus of the ipsilateral hippocampus compared to controls. However, no sprouting was observed in the histological results for this rat.
Table 2. Quantification of FA in the Region of Mossy Fibers in Excised Brains.
Bilateral increase in FA is seen in the spontaneously seizing rat brain images compared to both a naïve control and rats that underwent SE but did not exhibit any spontaneous seizures. The rats that did not spontaneously seize post-SE, exhibited increased FA in the right hippocampus but not in the left hippocampus.
| FA | ||||
|---|---|---|---|---|
| Average | Std. Dev | Mann- Whitney test |
||
|
Right Dentate Gyrus |
Naïve Control | 2.58E-01 | 1.87E-02 | |
| Spontaneously seizing | 3.89E-01 | 3.66E-02 | *, ** | |
| No Spontaneous seizures | 3.01E-01 | 2.04E-02 | * | |
|
Left Dentate Gyrus |
Naïve Control | 2.67E-01 | 1.80E-02 | |
| Spontaneously seizing | 3.88E-01 | 2.17E-02 | *, ** | |
| No Spontaneous seizures | 2.83E-01 | 1.74E-02 | ||
p < 0.1 from Mann-Whitney U test comparing both post-SE rats to naïve control
p < 0.1 from a Mann-Whitney U test comparing spontaneously seizing rat to the non-spontaneously seizing rat post-SE.
Figure 5. Visualization of Mossy Fiber Sprouting with MRI.

Part A shows the excised imaging FA map of a sham control rat’s hippocampi. Part B shows Timm staining (counter-stained with cresyl violet) images that reveal no mossy fiber sprouting in the sham control rat and inset is 20× magnification of the granule cell layer and inner molecular layer revealing no sprouting of the mossy fibers. Part C shows the FA map of a rat that did not spontaneously seize, part D of a spontaneously seizing rat, and Part E shows Timm staining (counter-stained with cresyl violet) images revealing mossy fiber sprouting in the dentate gyrus. Inset is 20x magnification of the granule cell layer and inner molecular layer (black arrow) reveal sprouting of the mossy fibers. Arrowheads point to the inner molecular layer in parts A, C and D.
In the SS rats, a significant increase in AD and longer T2 times were observed in the contralateral amygdala (AD 16.4%, T2 38.8%), piriform cortex (AD 20.3%, T2 33.5%) and entorhinal cortex (AD 24.2%, T2 16.1%) (Figs. 3B, 3D and 6A). Also a decrease in FA was observed in the contralateral entorhinal cortex (−16.9%, Fig. 3C). In addition to increased AD in the contralateral parahippocampal gyrus, fluid-filled cavities were observed (Figs. 3A and 6A) in the SS rats, while these cortices from the NS rats appear intact (Fig. 6B). Reduction in myelin staining was also observed in the contralateral piriform cortex (Fig. 6C) of the SS rats compared to the NS rats (Fig. 6D). Corresponding argyrophilic degenerating neurons were also observed in the amygdala and the piriform cortex around the cavity (silver staining, Figs. 6G and at higher magnification in Fig. 6H) in only the SS rats. Darkly stained neurons and iron deposition was also seen in the SS rat sections stained with Perl and Nissl (Figs. 6E and 6F) suggesting degeneration and iron deposition in the area. Shrinkage of the hippocampi and fimbria (Fig. 3A, bottom center) was observed bilaterally and in the contralateral amygdala, which resulted in an increased volume of the ventricles (Fig. 3A, top left). An increase of 0.25 – 4 fold was observed in ventricular volume bilaterally in 7 of 8 seizing rats. No volume change was observed in the eighth rat.
Figure 6. Iron Deposition and Neurodegeneration Visualized with MR in Excised Brain Correlated with Histology.

Excised AD maps showing the contralateral parahippocampal gyrus from a seizing rat (part A) and a non-seizing rat (part B). Black Gold II stained section (part C), corresponding to location in part A, shows reduced myelin stain in the piriform cortex and amygdala; while normal staining is observed from the non-seizing rat (part D). Part E shows Perl’s stained image that reveals iron deposition in the piriform cortex of the seizing rat, with part F showing a 20× magnification of box in E. Part G shows silver staining of the same area illustration ongoing neurodegeneration in the piriform cortex and in the amygdala, with part H showing a 20× magnification of the image in G. Note that around the cavity, this image shows darkly stained individual degenerating neurons.
DISCUSSION
In this study, we employed DTI and T2 relaxation measurements to examine in vivo longitudinal structural changes immediately following SE and during early epileptogenesis in an animal model of TLE. Our results indicate that diffusion and T2 changes during the acute phase in specific anatomical regions are observed only in animals that exhibit spontaneous limbic seizures. Three principal findings are derived from this study: First, rats developed Racine grade 3 – 5 spontaneous seizures only when increased AD and T2 were observed in the parahippocampal gyrus during the acute phase. Second, rats that exhibited seizures also exhibited AD and FA changes in bilateral hippocampal subfields and parahippocampal gyrus during the latent period. Third, white matter changes, such as those in the fimbria and mossy fibers, were observed with DTI but not with T2 relaxometry.
Hippocampus
Reduced AD and T2 were observed bilaterally in the subfields of the hippocampus which is in agreement with previous work (Lothman, et al., 1989) performed in this animal model, suggesting seizure activity, during unilateral stimulation, propagates to the contralateral hippocampus. The reduced AD and T2 may be due to cytotoxic edema following electrical SE (Zhong, et al., 1993). Prolonged seizures cause various changes, such as matrix viscosity, cellular membrane permeability, and microglial and astrocytic proliferation which consequently increase tissue tortuosity and therefore reduce average diffusion rates (Righini, et al., 1994; Zhong, et al., 1993) in the seizure focus. In addition to neuronal swelling, the decrease in AD could be a result of ongoing neurodegeneration, which may in turn result in an increase in extracellular tortuosity (Wall, et al., 2000). The decrease in extracellular water has also been suggested to result in shorter T2 relaxation times (Bhagat, et al., 2001) and the decrease in T2 may result from an increase in deoxyhemoglobin (van Eijsden, et al., 2004), as demand for glucose increases after prolonged seizure activity, leading to increased oxygen utilization.
In rats that developed seizures, the fimbria and fornix showed a significant decrease in FA bilaterally for all time points and histological analysis showed thinning of the fimbria (Figs. 4B and 4D, black arrows). The reduction in FA during the acute phase following SE suggests that there may be an initial loss of structure in the fimbria and fornix that does not recover over time. One cause of this reduction may be Wallerian degeneration of fibers in these bundles since this has been shown to cause a reduction in anisotropy, and a slight increase (Pierpaoli, et al., 2001) or normalization of the rate of diffusion (Beaulieu, et al., 1996). The Wallerian degeneration of fibers in the fimbria and fornix may be a consequence of the degeneration of CA1 and CA3 pyramidal cells observed in the hippocampus of these rats. To our knowledge, this is one of the first studies using an animal model of TLE that shows an FA change in the fimbria and fornix. However, reduced anisotropy and volume of fimbria and fornix have been observed with DTI in patients with TLE, both prior to and after the resection of the epileptogenic focus (Concha, et al., 2007; Concha, et al., 2005) suggesting that a similar loss in fimbria structure also occurs in patients with TLE. Nevertheless, further studies would be necessary to understand whether this structural change plays a role in seizure generation and/or propagation.
Another specific bilateral change observed only in the rats that develop seizures was mossy fiber sprouting. Excised brain imaging of spontaneously seizing rats revealed increased FA in the region of the dentate gyrus, corresponding to the sprouting of mossy fibers shown by Timm staining (Table 2 and Fig. 5). Previous in vivo studies have suggested that approximately 95% of the synapses formed are excitatory, thus forming a primarily recurrent excitatory circuit (Buckmaster, et al., 2002; Scharfman, et al., 2000). As described by Kuo et al. (Kuo, et al., 2008), mossy fibers in the dentate gyrus have preferential orientation and higher regularity of fibers, resulting in the increase in FA. Similar to results observed in this study, a recent paper by Immonen et al. (Immonen, et al., 2008) showed mossy fiber sprouting in spontaneously seizing rats in the region of increased FA. In addition, in accordance with their results, we did not find GFAP and FJC positive cells in the region of increased FA. Therefore, it is postulated that the increase in FA in the dentate gyrus was likely a consequence of mossy fiber sprouting. A recent study by Hunt and collaborators observed that only slice preparations from injured mice with mossy fiber sprouting showed spontaneous hilar-evoked epileptiform activity in the dentate gyrus, while results from injured mice with no mossy fiber sprouting were similar to those of control mice (Hunt, et al., 2009). Therefore, the formation of this recurrent excitatory circuitry may aide in the initiation and propagation of seizure activity in both patients and animal models of TLE. However due to resolution constraints, mossy fiber sprouting is difficult to observe in vivo during the latency period. Therefore, it is difficult to conclude whether mossy fiber sprouting is the cause or an effect of spontaneous seizures.
Parahippocampal Gyrus
Although similar AD and T2 changes within the hippocampus were observed during the acute phase post-SE for both NS and SS rats, only rats with parahippocampal damage during the acute phase post-SE developed spontaneous seizures. To our knowledge, this is the first observation of these early structural differences in a group of rats that develop Racine grade 3–5 spontaneous seizures, versus the group that does not. However, the importance of the parahippocampal gyrus in the initiation and propagation of seizures has been previously studied (Haberly and Sutula, 1992), and similar structural changes in the amygdala and the piriform cortex have been observed in this animal model (Bertram, 1997), other animal models of induced SE (Fujikawa, 1996; McIntyre and Gilby, 2008; Wall, et al., 2000) and in patients with TLE (Bernasconi, et al., 1999; Goncalves, et al., 2005) after the onset of spontaneous seizures. Various studies have suggested that seizure generation begins in the entorhinal cortex (Barbarosie and Avoli, 1997; Barbarosie, et al., 2000) or the amygdala (Aroniadou-Anderjaska, et al., 2008) and then propagates to the hippocampus. It has also been suggested that the normal entorhinal cortex acts as an inhibitory gate between the neocortex and the hippocampus (de Curtis and Pare, 2004), and that structural damage in this area may result in a hyperexcitable hippocampus. In addition, Pitkanen and collaborators (Pitkanen, et al., 1998) have suggested that the loss of inhibitory neurons in various amygdaloid nuclei may allow the remaining excitatory neurons to propagate seizure activity to the hippocampus. Therefore, based on the results of our current study, there is evidence to suggest that the structural loss seen in the parahippocampal gyrus during the acute phase may play an important role in the development of spontaneous seizures post-SE.
Thalamus
In vivo AD, FA and T2 changes were observed within the thalamus in all spontaneously seizing rats, consistent with Bertram et al (Bertram, et al., 2001; Bertram and Scott, 2000), who have observed neuronal damage within the dorsal thalamus as a consistent change in all spontaneously seizing rats using the same animal model. There is evidence to suggest that the thalamus has excitatory influence over the hippocampus (Bertram and Zhang, 1999) and has a regulatory role in the behavioral expression of limbic seizures (Cassidy and Gale, 1998; Lothman and Collins, 1981). Since changes in the thalamus were not observed in our study during the latent period, it is difficult to associate this change with the onset of spontaneous seizures.
Our results suggests that initial changes in the amygdala and piriform cortex during SE may be related to irreversible damage and initiate a cascade of structural reorganization during the latent period, which may subsequently lead to the onset of spontaneous seizures. Furthermore, as suggested by others and the results of our study, changes in the thalamus and mossy fiber sprouting in the hippocampus may contribute to the development of spontaneous seizures. We postulate that these specific hippocampal and parahippocampal changes may represent a structural biomarker for early epileptogenesis in TLE. However, further studies are necessary to co-register MRI with histology, and then correlate the temporal progression of MRI changes to underlying pathological changes. Also the results presented here raise questions about the role of limbic white matter connections, such as the fimbria and fornix, and of extra-limbic structures, such as the thalamus in the initiation and propagation of seizures.
ACKNOWLEDGMENTS
The project described was supported by award numbers R01 EB004752 and R01 EB007082 from the National Institute of Biomedical Imaging and Bioengineering, and award number R01 NS063360 from the National Institute of Neurological Disorders and Stroke. The content is solely the responsibility of the authors and does not necessarily represent the official views of the National Institute of Biomedical Imaging and Bioengineering, the National Institute of Neurological Disorders and Stroke, or the National Institutes of Health. Additional support was provided by the B. J. and Eve Wilder Epilepsy Research Endowment and the Children’s Miracle Network. MRI data was obtained at the Advanced Magnetic Resonance Imaging and Spectroscopy Facility in the McKnight Brain Institute of the University of Florida. The authors would like to thank Professor Baba Vemuri, Garrett Astary and Rabia Zafar for insightful discussions. We would also like to thank William T. Triplett for MRI analysis software development and Angela Hadlock for her technical support and Lan Hoang-Minh for assistance with some of the histology and MR measurements.
Footnotes
Publisher's Disclaimer: This is a PDF file of an unedited manuscript that has been accepted for publication. As a service to our customers we are providing this early version of the manuscript. The manuscript will undergo copyediting, typesetting, and review of the resulting proof before it is published in its final citable form. Please note that during the production process errors may be discovered which could affect the content, and all legal disclaimers that apply to the journal pertain.
REFERENCES
- Aroniadou-Anderjaska V, Fritsch B, Qashu F, Braga MF. Pathology and pathophysiology of the amygdala in epileptogenesis and epilepsy. Epilepsy Res. 2008;78:102–116. doi: 10.1016/j.eplepsyres.2007.11.011. [DOI] [PMC free article] [PubMed] [Google Scholar]
- Arzimanoglou A, Hirsch E, Nehlig A, Castelnau P, Gressens P, Pereira de Vasconcelos A. Epilepsy and neuroprotection: an illustrated review. Epileptic Disord. 2002;4:173–182. [PubMed] [Google Scholar]
- Barbarosie M, Avoli M. CA3-driven hippocampal-entorhinal loop controls rather than sustains in vitro limbic seizures. J Neurosci. 1997;17:9308–9314. doi: 10.1523/JNEUROSCI.17-23-09308.1997. [DOI] [PMC free article] [PubMed] [Google Scholar]
- Barbarosie M, Louvel J, Kurcewicz I, Avoli M. CA3-Released entorhinal seizures disclose dentate gyrus epileptogenicity and unmask a temporoammonic pathway. J Neurophysiol. 2000;83:1115–1124. doi: 10.1152/jn.2000.83.3.1115. [DOI] [PubMed] [Google Scholar]
- Basser PJ. Inferring microstructural features and the physiological state of tissues from diffusion-weighted images. NMR in Biomedicine. 1995;8:333–344. doi: 10.1002/nbm.1940080707. [DOI] [PubMed] [Google Scholar]
- Beaulieu C, Does MD, Snyder RE, Allen PS. Changes in water diffusion due to Wallerian degeneration in peripheral nerve. Magn Reson Med. 1996;36:627–631. doi: 10.1002/mrm.1910360419. [DOI] [PubMed] [Google Scholar]
- Bernasconi N, Bernasconi A, Andermann F, Dubeau F, Feindel W, Reutens DC. Entorhinal cortex in temporal lobe epilepsy: a quantitative MRI study. Neurology. 1999;52:1870–1876. doi: 10.1212/wnl.52.9.1870. [DOI] [PubMed] [Google Scholar]
- Bertram EH. Functional anatomy of spontaneous seizures in a rat model of limbic epilepsy. Epilepsia. 1997;38:95–105. doi: 10.1111/j.1528-1157.1997.tb01083.x. [DOI] [PubMed] [Google Scholar]
- Bertram EH, Cornett J. The ontogeny of seizures in a rat model of limbic epilepsy: evidence for a kindling process in the development of chronic spontaneous seizures. Brain Res. 1993;625:295–300. doi: 10.1016/0006-8993(93)91071-y. [DOI] [PubMed] [Google Scholar]
- Bertram EH, Cornett JF. The evolution of a rat model of chronic spontaneous limbic seizures. Brain Res. 1994;661:157–162. doi: 10.1016/0006-8993(94)91192-4. [DOI] [PubMed] [Google Scholar]
- Bertram EH, Lothman EW, Lenn NJ. The Hippocampus in Experimental Chronic Epilepsy - a Morphometric Analysis. Annals of Neurology. 1990;27:43–48. doi: 10.1002/ana.410270108. [DOI] [PubMed] [Google Scholar]
- Bertram EH, Mangan PS, Zhang D, Scott CA, Williamson JM. The Midline Thalamus: Alterations and a Potential Role in Limbic Epilepsy. 2001:967–978. doi: 10.1046/j.1528-1157.2001.042008967.x. [DOI] [PubMed] [Google Scholar]
- Bertram EH, Scott C. The pathological substrate of limbic epilepsy: neuronal loss in the medial dorsal thalamic nucleus as the consistent change. Epilepsia. 2000;41 Suppl 6:S3–S8. doi: 10.1111/j.1528-1157.2000.tb01548.x. [DOI] [PubMed] [Google Scholar]
- Bertram EH, Zhang DX. Thalamic excitation of hippocampal CA1 neurons: a comparison with the effects of CA3 stimulation. Neuroscience. 1999;92:15–26. doi: 10.1016/s0306-4522(98)00712-x. [DOI] [PubMed] [Google Scholar]
- Bhagat YA, Obenaus A, Hamilton MG, Kendall EJ. Magnetic resonance imaging predicts neuropathology from soman-mediated seizures in the rodent. NeuroReport. 2001;12:1481–1487. doi: 10.1097/00001756-200105250-00037. [DOI] [PubMed] [Google Scholar]
- Borowicz KK, Czuczwar SJ. Effects of etomidate, ketamine or propofol, and their combinations with conventional antiepileptic drugs on amygdala-kindled convulsions in rats. Neuropharmacology. 2003;45:315–324. doi: 10.1016/s0028-3908(03)00203-x. [DOI] [PubMed] [Google Scholar]
- Buckmaster PS, Zhang GF, Yamawaki R. Axon sprouting in a model of temporal lobe epilepsy creates a predominantly excitatory feedback circuit. J Neurosci. 2002;22:6650–6658. doi: 10.1523/JNEUROSCI.22-15-06650.2002. [DOI] [PMC free article] [PubMed] [Google Scholar]
- Cassidy RM, Gale K. Mediodorsal thalamus plays a critical role in the development of limbic motor seizures. J Neurosci. 1998;18:9002–9009. doi: 10.1523/JNEUROSCI.18-21-09002.1998. [DOI] [PMC free article] [PubMed] [Google Scholar]
- Concha L, Beaulieu C, Collins DL, Gross DW. White-matter diffusion abnormalities in temporal-lobe epilepsy with and without mesial temporal sclerosis. J Neurol Neurosurg Psychiatry. 2009;80:312–319. doi: 10.1136/jnnp.2007.139287. [DOI] [PubMed] [Google Scholar]
- Concha L, Beaulieu C, Wheatley BM, Gross DW. Bilateral white matter diffusion changes persist after epilepsy surgery. Epilepsia. 2007;48:931–940. doi: 10.1111/j.1528-1167.2007.01006.x. [DOI] [PubMed] [Google Scholar]
- Concha L, Gross DW, Beaulieu C. Diffusion tensor tractography of the limbic system. AJNR Am J Neuroradiol. 2005;26:2267–2274. [PMC free article] [PubMed] [Google Scholar]
- Danscher G. Histochemical demonstration of heavy metals. A revised version of the sulphide silver method suitable for both light and electronmicroscopy. Histochemistry. 1981;71:1–16. doi: 10.1007/BF00592566. [DOI] [PubMed] [Google Scholar]
- de Curtis M, Pare D. The rhinal cortices: a wall of inhibition between the neocortex and the hippocampus. Prog Neurobiol. 2004;74:101–110. doi: 10.1016/j.pneurobio.2004.08.005. [DOI] [PubMed] [Google Scholar]
- de Graaf RA, Brown PB, McIntyre S, Nixon TW, Behar KL, Rothman DL. High magnetic field water and metabolite proton T-1 and T-2 relaxation in rat brain in vivo. Magnetic Resonance in Medicine. 2006;56:386–394. doi: 10.1002/mrm.20946. [DOI] [PubMed] [Google Scholar]
- Fabene PF, Marzola P, Sbarbati A, Bentivoglio M. Magnetic resonance imaging of changes elicited by status epilepticus in the rat brain: diffusion-weighted and T2-weighted images, regional blood volume maps, and direct correlation with tissue and cell damage. Neuroimage. 2003;18:375–389. doi: 10.1016/s1053-8119(02)00025-3. [DOI] [PubMed] [Google Scholar]
- Fujikawa DG. The temporal evolution of neuronal damage from pilocarpine-induced status epilepticus. Brain Research. 1996;725:11–22. doi: 10.1016/0006-8993(96)00203-x. [DOI] [PubMed] [Google Scholar]
- Goncalves PPM, Insausti R, Artacho-Perula E, Salmenpera T, Kalviainen R, Pitkanen A. MR volumetric analysis of the piriform cortex and cortical amygdala in drug-refractory temporal lobe epilepsy. ANJR Am J Neuroradiol. 2005;26:319–332. [PMC free article] [PubMed] [Google Scholar]
- Gong G, Shi F, Concha L, Beaulieu C, Gross DW. Insights into the sequence of structural consequences of convulsive status epilepticus: a longitudinal MRI study. Epilepsia. 2008;49:1941–1945. doi: 10.1111/j.1528-1167.2008.01666.x. [DOI] [PubMed] [Google Scholar]
- Haberly LB, Sutula TP. Neuronal processes that underlie expression of kindled epileptiform events in the piriform cortex in vivo. J Neurosci. 1992;12:2211–2224. doi: 10.1523/JNEUROSCI.12-06-02211.1992. [DOI] [PMC free article] [PubMed] [Google Scholar]
- Hauser WA, Annegers JF, Kurland LT. Incidence of epilepsy and unprovoked seizures in Rochester, Minnesota: 1935–1984. Epilepsia. 1993;34:453–468. doi: 10.1111/j.1528-1157.1993.tb02586.x. [DOI] [PubMed] [Google Scholar]
- Hunt RF, Scheff SW, Smith BN. Posttraumatic epilepsy after controlled cortical impact injury in mice. Exp Neurol. 2009;215:243–252. doi: 10.1016/j.expneurol.2008.10.005. [DOI] [PMC free article] [PubMed] [Google Scholar]
- Immonen RJ, Kharatishvili I, Sierra A, Einula C, Pitkanen A, Grohn OH. Manganese enhanced MRI detects mossy fiber sprouting rather than neurodegeneration, gliosis or seizure-activity in the epileptic rat hippocampus. Neuroimage. 2008;40:1718–1730. doi: 10.1016/j.neuroimage.2008.01.042. [DOI] [PubMed] [Google Scholar]
- Jansen JF, Lemmens EM, Strijkers GJ, Prompers JJ, Schijns OE, Kooi ME, Beuls EA, Nicolay K, Backes WH, Hoogland G. Short- and long-term limbic abnormalities after experimental febrile seizures. Neurobiol Dis. 2008;32:293–301. doi: 10.1016/j.nbd.2008.07.010. [DOI] [PubMed] [Google Scholar]
- Kim H, Piao Z, Liu P, Bingaman W, Diehl B. Secondary white matter degeneration of the corpus callosum in patients with intractable temporal lobe epilepsy: a diffusion tensor imaging study. Epilepsy Res. 2008;81:136–142. doi: 10.1016/j.eplepsyres.2008.05.005. [DOI] [PubMed] [Google Scholar]
- Kuo LW, Lee CY, Chen JH, Wedeen VJ, Chen CC, Liou HH, Tseng WY. Mossy fiber sprouting in pilocarpine-induced status epilepticus rat hippocampus: a correlative study of diffusion spectrum imaging and histology. Neuroimage. 2008;41:789–800. doi: 10.1016/j.neuroimage.2008.03.013. [DOI] [PubMed] [Google Scholar]
- LeBihan D, Breton E, Lallemand D, Grenier P, Cabanis E, Laval-Jeantet M. MR Imaging of Intravoxel Incoherent Motions: Applications to Diffusion and Perfusion in Neurologic Disorders. Radiology. 1986;1986:401–407. doi: 10.1148/radiology.161.2.3763909. [DOI] [PubMed] [Google Scholar]
- Lothman EW, Bertram EH, Bekenstein JW, Perlin JB. Self-sustaining limbic status epilepticus induced by 'continuous' hippocampal stimulation: electrographic and behavioral characteristics. Epilepsy Res. 1989;3:107–119. doi: 10.1016/0920-1211(89)90038-7. [DOI] [PubMed] [Google Scholar]
- Lothman EW, Bertram EH, Kapur J, Stringer JL. Recurrent Spontaneous Hippocampal Seizures in the Rat as a Chronic Sequela to Limbic Status Epilepticus. Epilepsy Research. 1990;6:110–118. doi: 10.1016/0920-1211(90)90085-a. [DOI] [PubMed] [Google Scholar]
- Lothman EW, Collins RC. Kainic acid induced limbic seizures: metabolic, behavioral, electroencephalographic and neuropathological correlates. Brain Res. 1981;218:299–318. doi: 10.1016/0006-8993(81)91308-1. [DOI] [PubMed] [Google Scholar]
- Mathern GW, Bertram EH, 3rd, Babb TL, Pretorius JK, Kuhlman PA, Spradlin S, Mendoza D. In contrast to kindled seizures, the frequency of spontaneous epilepsy in the limbic status model correlates with greater aberrant fascia dentata excitatory and inhibitory axon sprouting, and increased staining for N-methyl-D-aspartate, AMPA and GABA(A) receptors. Neuroscience. 1997;77:1003–1019. doi: 10.1016/s0306-4522(96)00516-7. [DOI] [PubMed] [Google Scholar]
- McIntyre DC, Gilby KL. Mapping seizure pathways in the temporal lobe. Epilepsia. 2008;49:23–30. doi: 10.1111/j.1528-1167.2008.01507.x. [DOI] [PubMed] [Google Scholar]
- Nair DR, Mohamed A, Burgess R, Luders H. A critical review of the different conceptual hypotheses framing human focal epilepsy. Epileptic Disord. 2004;6:77–83. [PubMed] [Google Scholar]
- Nair SP, Shiau DS, Lasemidis LD, Norman WM, Pardalos PM, Sackellares JC, Carney P. Seizure predictability in an experimental model of epilepsy. Springer US: 2007. [Google Scholar]
- Nair SP, Shiau DS, Principe JC, Iasemidis LD, Pardalos PM, Norman WM, Carney PR, Kelly KM, Sackellares JC. An investigation of EEG dynamics in an animal model of temporal lobe epilepsy using the maximum Lyapunov exponent. Exp Neurol. 2009;216:115–121. doi: 10.1016/j.expneurol.2008.11.009. [DOI] [PMC free article] [PubMed] [Google Scholar]
- Nairismagi J, Grohn OH, Kettunen MI, Nissinen J, Kauppinen RA, Pitkanen A. Progression of brain damage after status epilepticus and its association with epileptogenesis: a quantitative MRI study in a rat model of temporal lobe epilepsy. Epilepsia. 2004;45:1024–1034. doi: 10.1111/j.0013-9580.2004.08904.x. [DOI] [PubMed] [Google Scholar]
- Nakasu Y, Nakasu S, Kizuki H, Uemura S, Morikawa S, Inubushi T, Handa J. Changes in water diffusion of rat limbic system during status epilepticus elicited by kainate. Psychiatry Clin.Neurosci. 1995a;49:S228–S230. doi: 10.1111/j.1440-1819.1995.tb02184.x. [DOI] [PubMed] [Google Scholar]
- Nakasu Y, Nakasu S, Morikawa S, Uemura S, Inubushi T, Handa J. Diffusion-weighted MR in experimental sustained seizures elicited with kainic acid. AJNR Am.J.Neuroradiol. 1995b;16:1185–1192. [PMC free article] [PubMed] [Google Scholar]
- Paxinos G, Watson C. The Rat Brain in Stereotaxic Coordinates. New York: Academic Press; 1982. [Google Scholar]
- Pierpaoli C, Barnett A, Pajevic S, Chen R, Penix LR, Virta A, Basser P. Water diffusion changes in Wallerian degeneration and their dependence on white matter architecture. Neuroimage. 2001;13:1174–1185. doi: 10.1006/nimg.2001.0765. [DOI] [PubMed] [Google Scholar]
- Pierpaoli C, Jezzard P, Basser PJ, Barnett A, Di Chiro G. Diffusion tensor MR imaging of the human brain. Radiology. 1996;201:637–648. doi: 10.1148/radiology.201.3.8939209. [DOI] [PubMed] [Google Scholar]
- Pitkanen A, Tuunanen J, Kalviainen R, Partanen K, Salmenpera T. Amygdala damage in experimental and human temporal lobe epilepsy. Epilepsy Res. 1998;32:233–253. doi: 10.1016/s0920-1211(98)00055-2. [DOI] [PubMed] [Google Scholar]
- Racine RJ. Modification of seizure activity by electrical stimulation. II. Motor seizure. Electroencephalogr Clin Neurophysiol. 1972;32:281–294. doi: 10.1016/0013-4694(72)90177-0. [DOI] [PubMed] [Google Scholar]
- Righini A, Pierpaoli C, Alger JR, Di Chiro G. Brain parenchyma apparent diffusion coefficient alterations associated with experimental complex partial status epilepticus. Magn Reson.Imaging. 1994;12:865–871. doi: 10.1016/0730-725x(94)92027-3. [DOI] [PubMed] [Google Scholar]
- Rugg-Gunn FJ, Eriksson SH, Symms MR, Barker GJ, Duncan JS. Diffusion tensor imaging of cryptogenic and acquired partial epilepsies. Brain. 2001;124:627–636. doi: 10.1093/brain/124.3.627. [DOI] [PubMed] [Google Scholar]
- Sanchez JC, Alba N, Nishida T, Batich C, Carney PR. Structural modifications in chronic microwire electrodes for cortical neuroprosthetics: a case study. IEEE Trans Neural Syst Rehabil Eng. 2006a;14:217–221. doi: 10.1109/TNSRE.2006.875581. [DOI] [PubMed] [Google Scholar]
- Sanchez JC, Mareci TH, Norman WM, Principe JC, Ditto WL, Carney PR. Evolving into epilepsy: Multiscale electrophysiological analysis and imaging in an animal model. Exp Neurol. 2006b;198:31–47. doi: 10.1016/j.expneurol.2005.10.031. [DOI] [PubMed] [Google Scholar]
- Sander JW. The epidemiology of epilepsy revisited. Curr Opin Neurol. 2003;16:165–170. doi: 10.1097/01.wco.0000063766.15877.8e. [DOI] [PubMed] [Google Scholar]
- Scharfman HE, Goodman JH, Sollas AL. Granule-Like Neurons at the Hilar/CA3 Border after Status Epilepticus and Their Synchrony with Area CA3 Pyramidal Cells: Functional Implications of Seizure-Induced Neurogenesis. 2000:6144–6158. doi: 10.1523/JNEUROSCI.20-16-06144.2000. [DOI] [PMC free article] [PubMed] [Google Scholar]
- Schmued L, Slikker W., Jr Black-gold: a simple, high-resolution histochemical label for normal and pathological myelin in brain tissue sections. Brain Res. 1999;837:289–297. doi: 10.1016/s0006-8993(99)01624-8. [DOI] [PubMed] [Google Scholar]
- Schmued LC, Stowers CC, Scallet AC, Xu L. Fluoro-Jade C results in ultra high resolution and contrast labeling of degenerating neurons. Brain Res. 2005;1035:24–31. doi: 10.1016/j.brainres.2004.11.054. [DOI] [PubMed] [Google Scholar]
- Simonotto JD, Myers SM, Furman MD, Norman WM, Liu Z, DeMarse TB, Carney PR, Ditto WL. Coherence analysis over the latent period of epileptogenesis reveal that high-frequency communication is increased across hemispheres in an animal model of limbic epilepsy. Conf Proc IEEE Eng Med Biol Soc. 2006;1:1154–1156. doi: 10.1109/IEMBS.2006.259817. [DOI] [PubMed] [Google Scholar]
- Talathi SS, Hwang DU, Ditto WL, Mareci T, Sepulveda H, Spano M, Carney PR. Circadian control of neural excitability in an animal model of temporal lobe epilepsy. Neurosci Lett. 2009;455:145–149. doi: 10.1016/j.neulet.2009.03.057. [DOI] [PubMed] [Google Scholar]
- van Eijsden P, Notenboom RG, Wu O, de Graan PN, van Nieuwenhuizen O, Nicolay K, Braun KP. In vivo 1H magnetic resonance spectroscopy, T2-weighted and diffusion-weighted MRI during lithium-pilocarpine-induced status epilepticus in the rat. Brain Res. 2004;1030:11–18. doi: 10.1016/j.brainres.2004.09.025. [DOI] [PubMed] [Google Scholar]
- Viola P, Wells Iii WM. Alignment by Maximization of Mutual Information. International Journal of Computer Vision. 1997;24:137–154. [Google Scholar]
- Wall CJ, Kendall EJ, Obenaus A. Rapid alterations in diffusion-weighted images with anatomic correlates in a rodent model of status epilepticus. AJNR Am.J.Neuroradiol. 2000;21:1841–1852. [PMC free article] [PubMed] [Google Scholar]
- Whitwell JL. Longitudinal imaging: change and causality. Curr Opin Neurol. 2008;21:410–416. doi: 10.1097/WCO.0b013e32830719d4. [DOI] [PubMed] [Google Scholar]
- Yamamoto T, Hirano A. A comparative study of modified Bielschowsky, Bodian and thioflavin S stains on Alzheimer's neurofibrillary tangles. Neuropathol Appl Neurobiol. 1986;12:3–9. doi: 10.1111/j.1365-2990.1986.tb00677.x. [DOI] [PubMed] [Google Scholar]
- Zhong J, Petroff OA, Prichard JW, Gore JC. Changes in water diffusion and relaxation properties of rat cerebrum during status epilepticus. Magn Reson.Med. 1993;30:241–246. doi: 10.1002/mrm.1910300214. [DOI] [PubMed] [Google Scholar]