Abstract
Vascular endothelial growth factor (VEGF) is a dimeric glycoprotein that plays a crucial role in microvascular complications of diabetes, including diabetic nephropathy. However, the precise regulatory mechanisms governing VEGF expression in the diabetic milieu are still poorly understood. Here, we provide evidence that microRNA-93 (miR-93) regulates VEGF expression in experimental models of diabetes both in vitro and in vivo. Comparative microRNA expression profile arrays identified miR-93 as a signature microRNA in hyperglycemic conditions. We identified VEGF-A as a putative target of miR-93 in the kidney with a perfect complementarity between miR-93 and the 3′-untranslated region of vegfa in several species. When cotransfected with a luciferase reporter construct containing the mouse vegfa 3′-untranslated region, expression of miR-93 markedly decreased the luciferase activity. We showed that forced expression of miR-93 in cells abrogated VEGF protein secretion. Conversely, anti-miR-93 inhibitors increased VEGF release. Transfection of miR-93 also prevented the effect of high glucose on VEGF downstream targets. Using transgenic mice containing VEGF-LacZ bicistronic transcripts, we found that inhibition of glomerular miR-93 by peptide-conjugated morpholino oligomers elicited increased expression of VEGF. Our findings also indicate that high glucose decreases miR-93 expression by down-regulating the promoter of the host MCM7 gene. Taken together, our findings provide new insights into the role of miR-93 in VEGF signaling pathway and offer a potentially novel target in preventing the progression of diabetic nephropathy.
Keywords: Diabetes, Gene regulation, Growth factors, Kidney, MicroRNA, VEGF
Introduction
Vascular endothelial growth factor-A (VEGF-A)3 is a homodimeric glycoprotein with a central role in angiogenesis, vascular homeostasis, and the maintenance of capillary integrity, particularly in the kidney glomerulus (1, 2). Several lines of evidence have recently suggested that precise regulation of glomerular VEGF expression in the kidney is required for the proper development and function of glomerulus (2, 3). First, pharmacological and genetic disruptions of VEGF were shown to result in significant proteinuria and glomerular endotheliosis (2, 4, 5). Second, the administration of an adenovirus expressing sFlt (soluble fms-like tyrosine kinase) in animal models also caused endotheliosis and proteinuria (6). Finally, targeted deletion of VEGF in podocytes, the major source of VEGF production in the kidneys, resulted in thrombotic glomerular injury (2). Although these observations suggest a detrimental effect of low levels of VEGF in the kidney, high levels of VEGF have also been implicated in the pathogenesis of a variety of inflammatory diseases, particularly in microvascular complications of diabetes (2, 3, 7). Indeed, VEGF has emerged as a major mediator of diabetic retinopathy and nephropathy (7–9). A pathogenic role for VEGF in diabetic nephropathy (DN) was inferred from reports indicating that VEGF-A was up-regulated in the kidneys of animal models of DN. The use of anti-VEGF in streptozotocin-induced type 1 diabetic animals or in db/db type 2 diabetic mice was shown to result in significant improvement in the kidney function in animal models of DN (10, 11). However, the regulatory mechanisms by which glomerular VEGF expression is tightly maintained in the kidneys are unknown.
A potential mechanism for the precise regulation of VEGF in the kidneys might be through its regulation by microRNAs (miRNAs). miRNAs are a class of short (21–24 nucleotides), noncoding RNA molecules that are evolutionarily conserved and function as negative regulators of gene expression (12, 13). The involvement of miRNAs as novel regulators of a variety of biological processes in the cell as well as their roles in diverse pathologies is increasingly reported (14, 15). Of particular interest, several recent reports have implicated miRNAs in the regulation of kidney development and angiogenesis (16, 17).
Despite the critical role of VEGF in microvascular complications of diabetes, the regulatory role of miRNAs on VEGF remains unknown. Here, we investigated the role of miRNAs on VEGF expression in the hyperglycemic environment using an integrated in vitro and in vivo approach. We generated miRNA expression profiles from glomerular kidney samples from diabetic db/db mice as well as from cultured podocytes and kidney microvascular endothelial cells exposed to elevated glucose concentrations. We identified and validated microRNA-93 (miR-93) as a key regulator of VEGF signaling in the kidneys. Using a combination of gain-of-function and silencing experiments, we showed that miR-93 is a critical regulator of VEGF expression in the diabetic milieu both in vitro and in vivo.
EXPERIMENTAL PROCEDURES
Plasmids and Morpholino Oligomers
The 3′-UTR of the mouse vegfa gene (NM_001025250) was amplified from podocyte genomic DNA by PCR using HotMaster Taq polymerase (5PRIME, Gaithersburg, MD), with the following primers: GTCTCGAGGGTTTCGGGAACCAGACCTCTCA (forward) and CAGAATTCCAGAAACAACCCTAATCTTCCGGG (reverse). PCR product was cloned between XhoI and EcoRI sites of luciferase reporter vector 3.1-luc, kindly provided by Dr. Ralph Nicholas (Dartmouth Medical School, Hanover, NH) (18). The putative miR-93 binding site GCACUUU (nucleotides 162–168) was mutated into UGUAGCG by oligonucleotide-directed PCR. All constructs were verified by sequencing. The pWZL Blast VEGF expression plasmid was purchased from Addgene (Cambridge, MA). The pEGP-miR-93 was obtained from Cell Biolabs (San Diego, CA). The luciferase reporter vector pGL4.10 (luc2) was from Promega (Madison, WI). The mouse miR-93 antisense morpholino was synthesized by Gene Tools (Philomath, OR) using the sequence 5′-CACTACCTGCACGAACAGCACTTTG-3′. For experiments using 3.1-luc luciferase reporter constructs in vitro, 1.5 × 10⁵ HeLa cells were plated in 12-well plates. 1.5 μg of 3.1-luc luciferase construct, 50 ng of pSV-β-galactosidase control vector (Promega), and 30 nm miRNA mimics (Ambion, Austin, TX) were transfected using Lipofectamine 2000 (Invitrogen). After 48 h of transfections, luciferase and β-galactosidase activity were assayed as reported previously (19).
Tissue Culture
A conditionally immortalized renal microvascular endothelial cell line was a kind gift of Dr. Robert Langley (M.D. Anderson Cancer Center, University of Texas, Houston, TX) (20). Conditionally immortalized mouse podocytes were kindly provided by Dr. Peter Mundel (University of Miami, Miami, FL) and cultured as reported previously (21). Briefly, podocytes were cultured on BD BioCoat collagen I plates (BD Biosciences) at 33 °C in the presence of 20 units/ml mouse recombinant interferon-γ (Invitrogen) to enhance expression of a thermosensitive T antigen. To induce differentiation, podocytes were maintained at 37 °C without interferon-γ for 10–12 days.
Animal Studies
All animal studies were conducted according to the National Institutes of Health Principles of Laboratory Animal Care and the guidelines of the IACUC of Baylor College of Medicine. The diabetic db/db mice and their control littermates db/m mice were obtained from Jackson Laboratories (Bar Harbor, ME). All animals were maintained on a normal chow diet and housed in a room with a 12/12-h light/dark cycle and an ambient temperature of 22 °C. The Vegf-lacZ-KI+/− mice were kindly provided by Dr. Andras Nagy (Samuel Lunenfeld Research Institute, Toronto, ON, Canada) (22). Kidney glomeruli were isolated by perfusion using Dynabeads (Invitrogen) as described previously (23). miR-93 knock-out mice (Mir106b-25tm1.1Tyj/J) were purchased from Jackson Laboratories.
miRNA Extraction and Microarray Analysis
miRNAs were extracted using miRNeasy Mini Kit (Qiagen, Valencia, CA) according to the manufacturer's instructions. miRNA microarray was performed using Micro Paraflo microfluidic chips (LC Sciences, Houston, TX). Data were analyzed by normalizing the signals using a LOWESS filter (locally weighted regression) (24). For two-color experiments, the ratio of the two sets of detected signals (log2 transformed, balanced) and p values of the t test were calculated. Those with p < 0.05 were considered as differentially expressed miRNAs.
Computational Targeted Gene Predictions of miR-93
The full-length mRNAs of mouse vegf (NM_001025250) were obtained from the NCBI database. The miRNA sequence database (miRBase) was obtained from the University of Manchester. Three separate algorithms (miRanda, TargetScan, and PicTar) were used to find potential targets sites for miR-93. The RNA Hybrid program (25) was used to predict the secondary structure of the RNA·miRNA duplex.
Real Time Reverse Transcription-PCR, Northern Blotting, and in Situ Hybridization for miRNAs
The miRCURY locked nucleic acid microRNA PCR System (Exiqon, Woburn, MA) was used in conjunction with qPCR and SYBR Green Supermix (Bio-Rad) for quantification of miRNA transcripts according to the manufacturer's instructions. U6 snRNA was used as an internal control with the following primers: 5′-CGCTTCGGCAGCACATATAC-3′ (forward) and 5′-TTCACGAATTTGCGTGTCAT-3′ (reverse). The reactions were incubated in a 96-well plate at 95 °C for 10 min followed by 40 cycles of 95 °C for 10 s and 60 °C for 1 min. Individual samples were run in triplicate, and each experiment was repeated at least three times. Relative gene expression was calculated using the 2−ΔΔCT method (26). Northern blotting was carried out using [γ-32P]ATP (PerkinElmer Life Sciences) end-labeled miRNA locked nucleic acid probes (Exiqon) (27). Signals were quantitated using software National Institutes of Health Image J version 1.42q. In situ hybridization was performed using a locked nucleic acid miR-93 probe (5′-CTACCTGCACGAACAGCACTTTG-3′ and scramble miRNA control probe (5′-GTGTAACACGTCTATACGCCCA-3′), both of which were digoxigenin-labeled at the 5′-end (Exiqon). Hybridizations were conducted overnight at 58 °C. Sections were digitally imaged and quantitated using an automated program (28). Observable expression strengths were scored into four grades according to the intensity of the staining: cells with no detectable precipitate (−), weakly expressing cells (+), moderately expressing cells (++), and strongly expressing cells filled with dye precipitate (+++).
miRNA Mimics and Inhibitors
Pre-miRNA precursor molecules and anti-miR miRNAs were purchased from Ambion. They were introduced into podocytes using Lipofectamine 2000 at a final concentration of 30 nm. These pre-miRNA mimics are small, double-stranded RNAs that mimic endogenous precursor miRNAs and can be taken up and activated by the miRNA processing pathway. The anti-miR miRNA inhibitors are chemically modified RNAs that can bind to and inhibit the activity of target miRNAs.
Reverse Transcription-qPCR
Total RNA was extracted using TRIzol reagent (Invitrogen). First-strand cDNAs were generated using a Superscript VILO cDNA Synthesis kit (Invitrogen). SYBR Green-based qPCR on a DNAEngine OPTICON (Bio-Rad) was used to analyze the relative expression levels of the following genes with the different primer sets: collagen type IVα3 (COL4A3), 5′-AGAGGGGACGAGGGCGGAAC-3′ (forward) and 5′-TCCCCGGCGGGACACAGATT-3′ (reverse); fibronectin (FN1), 5′-GCGGTTGTCTGACGCTGGCT-3′ (forward) and 5′-TGGGTTCAGCAGCCCCAGGT-3′ (reverse); β-actin, 5′-TGTTACCAACTGGGACGACA-3′ (forward) and 5′-GGGGTGTTGAAGGTCTCAAA-3′ (reverse).
Measurement of VEGF by ELISA and Western Blotting
VEGF concentrations in the supernatant were measured by ELISA using Quantikine Mouse VEGF Immunoassay (R&D Systems, Minneapolis, MN). Protein levels of VEGF-A were analyzed by Western blotting in whole cell lysates using anti-VEGF antibody (Thermo Scientific, Fremont, CA). Signals were quantitated by Odyssey Infrared Imager (Li-CoR Biosciences, Lincoln, NE).
Generation of miR-93 Stable Podocytes
Undifferentiated podocytes were stably transfected with pEGP-miR-93 precursor using Lipofectamine 2000 and selected with 1 μg/ml puromycin (Sigma) in the presence of 20 units/ml interferon-γ at 33 °C.
Immunofluorescence Microscopy
Immunostaining was performed as described previously (29, 30). Briefly, expression of miR-93 and endogenous VEGF in the stable miR-93-GFP podocytes was detected using green fluorescent and anti-VEGF antibodies (Thermo Scientific). Coverslips were imaged on an Applied Precision SoftWoRx Image Restoration Microscope (deconvolution). For immunostaining in the kidneys, goat anti-nephrin (R&D Systems) and mouse anti-VEGF antibodies were used. Sections were incubated at 4 °C overnight. Sections were imaged on a Zeiss LSM 510 inverted laser scanning microscope.
Whole Mount X-Gal Staining of Kidney Organ Culture
Adult kidney organ culture and tissue delivery of antisense morpholino oligomers were carried out as reported previously (31, 32). Briefly, kidneys from VEGF-LacZ mice were harvested under sterile conditions. Kidney capsules were removed and kidney cortices dissected and cut into small pieces (approximately 1 mm). Kidney cortex pieces were cultured using a roller bottle incubator (model 1000; Robbins Scientific, Sunnyvale, CA) at 37°C, 5% CO2, 20% O2, 75% N2 for 72 h in Dulbecco's modified Eagle's medium, containing 10% fetal bovine serum, 1× penicillin and streptomycin, under either normal glucose (5 mm d-glucose) or high glucose conditions (25 mm d-glucose). miR-93 morpholino oligomers (10 μm) were delivered into the cultured kidneys using 4 mm Endo-Porter delivery system (Gene Tools) (32). After 72 h, kidneys were fixed in 2% paraformaldehyde and 0.2% glutaraldehyde. X-gal staining (Millipore) was performed at 37 °C in 0.02% glutaraldehyde, 5 mm K3Fe(CN)6, 5 mm K4Fe(CN)6, and 2 mm MgCl2 as described previously (33). Kidneys were then postfixed in 4% paraformaldehyde followed by paraffin embedding. Paraffin sections were dewaxed and mounted and examined under a Nikon Eclipse 80i microscope.
Promoter Cloning and Luciferase Reporter Assay
Based on the reported human MCM7 promoter sequence (34), the mouse MCM7 promoter spanning 500 bp upstream of the gene was PCR amplified from podocytes genomic DNA using HotMaster Taq polymerase (5PRIME) with the following primer set: 5′-GTAGGTACCGCGGACTAGCCAGGTGGAAAGATAG-3′ (forward) and 5′-GCAGCTAGCTCTGGGGAAGCAGAAAAAACGCG-3′ (reverse). PCR products were cloned into KpnI–NheI sites of pGL4.10 (luc2). The MCM7 promoter construct or the empty pGL4.10 (luc2) vector was cotransfected with pSV-β-galactosidase into podocytes. Luciferase activity was measured using Dual-Glo Luciferase Reporter Assay kit (Promega,) on a FLUOstar Omega luminometer (BMG Labtech, Cary, NC) as reported previously (19), using β-galactosidase as internal control.
Statistical Analysis
All data are shown as mean ± S.E. Statistical significance was assessed by performing analysis of variance followed by the Tukey-Kramer post hoc analysis for multiple comparisons using an α value of 0.05 in GraphPad Prism software (San Diego, CA).
RESULTS
Hyperglycemia Elicits Down-regulation of miR-93 Expression
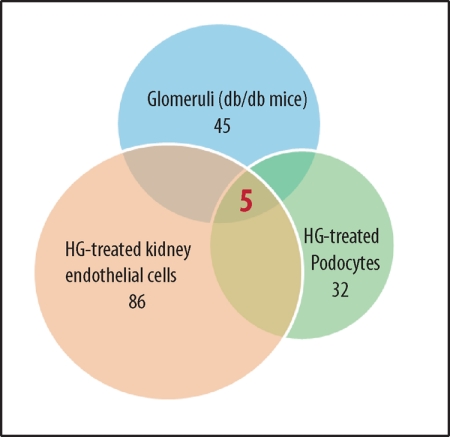
Comparative miRNA arrays from high glucose-exposed (25 mm) podocytes and kidney microvascular endothelial cells, as well as in the kidney glomeruli obtained from diabetic db/db mice revealed that a number of miRNAs were differentially modulated in high glucose conditions (Fig. 1 and supplemental Tables 1–4). Because we were interested in the role of miRNAs on the expression of VEGF-A in the diabetic environment, we initially focused on miRNAs that were preferentially down-regulated under hyperglycemic conditions. Among those individual miRNAs differentially expressed, we focused on miR-93 which was consistently decreased within all samples, and potentially had a highly conserved binding site in the 3′-UTR region of vegfa in several species (Fig. 2A, upper panel). As shown in Fig. 2A (lower panel), the 3′-UTR of the mouse vegfa gene contains a 7-mer that is perfectly complementary to the seed region of miR-93. The minimum free energy predicted for hybridization with the vegfa 3′-UTR and miR-93 at this site was ΔG = −27.4 kcal mol−1, consistent with an authentic miRNA targeting (35). As determined by RNA Hybrid analysis, we also found that miR-93 and its binding site in vegfa could potentially form a very stable secondary structure (Fig. 2B). Thus, we hypothesized that VEGF-A might serve as a target for miR-93 in the diabetic milieu.
FIGURE 1.
Identification of miR-93 as a signature miRNA in high glucose (HG) conditions. Comparative microarray analysis indicated that 5 miRNAs were down-regulated within all samples, whereas 45 miRNAs were down-regulated in db/db glomeruli, 86 in high glucose-treated kidney microvascular endothelial cells, and 32 miRNAs in podocytes treated with high glucose (25 mm) for 24 h compared with normal glucose conditions.
FIGURE 2.
miR-93 is predicted to target vegfa gene. A, upper panel, miR-93 target site resides at nucleotides 162–168 (shown in the blue box) of the vegf 3′-UTR, is highly conserved in several species. Lower panel, sequence alignment of miR-93 with the mouse vegfa 3′-UTR is shown. B, miR-93 can potentially form a strong secondary structure with the target sequence of 3′-UTR of vegfa (predicted by RNA Hybrid).
Validation of miR-93 Expression in Vitro and in Vivo
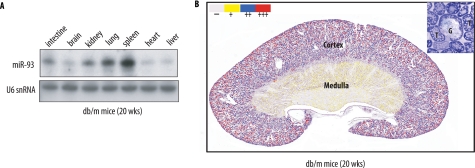
We initially examined miR-93 expression pattern by Northern blot analysis from multiple tissues obtained from control db/m mice (Fig. 3A). Using a locked nucleic acid-labeled miR-93 probe, we found that the expression level of miR-93 was high in spleen, lung, and kidney (Fig. 3A). To examine further the localization of miR-93 expression in the kidney, we carried out in situ hybridization using digoxigenin-labeled locked nucleic acid-miR-93 probe (Fig. 3B). Hybridization with the miR-93-specific probe revealed the presence of miR-93 predominantly in the cortical region of the kidneys. Generalized staining of miR-93 was detected throughout glomeruli and tubular epithelial cells.
FIGURE 3.
Expression pattern of miR-93 in vivo. A, expression of miR-93 in different tissues as detected by Northern blotting. U6 snRNA serves as a loading control. B, expression pattern of miR-93 in a db/m kidney tissue by in situ hybridization. Inset, higher power view. G, glomerulus; T, tubule. Images are representative of three independent experiments.
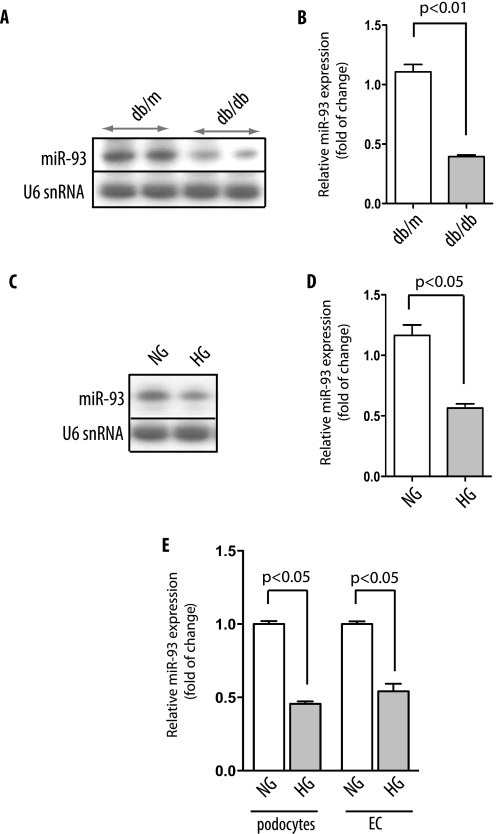
To verify our array analysis and to address whether miR-93 expression is differentially expressed in DN, expression of miR-93 was validated by Northern blot analysis in the glomeruli of db/db and control db/m mice from independent experiments (Fig. 4A). As shown in Fig. 4, A and B, diabetic db/db mice had significantly lower expression levels of miR-93 compared with db/m control mice (p < 0.05; Fig. 4B). These results confirmed that the glomeruli expression of miR-93 is markedly down-regulated in diabetic mice.
FIGURE 4.
miR-93 is down-regulated in high glucose conditions. A, Northern blot analysis of representative results from glomerular miR-93 expression in two control db/m and two diabetic db/db mice. B, quantitative analysis of miR-93 expression. Mean values for miR-93 expression were generated by measuring the pixel intensity in each band using ImageJ version 1.42q. Measured transcript levels were normalized to U6 snRNA expression. Samples were run in triplicate. Data are shown as mean ± S.E. (error bars). C, Northern blot analysis of miR-93 expression in high glucose (HG)-treated podocytes compared with normal glucose (NG). D, quantitative analysis of miR-93 expression in podocytes. Measured transcript levels were normalized to U6 snRNA expression. Samples were run in triplicate. Data are shown as mean ± S.E. (error bars). E, reverse transcription-qPCR analysis of miR-93 in podocytes and kidney microvascular endothelial cells (EC) after exposure to high glucose for 24 h. Measured transcript levels were normalized to U6 snRNA expression. Data represent three independent experiments with three replicates each and are shown as mean ± S.E. (error bars).
Next, we validated the expression profile of miR-93 in podocytes, the main source of VEGF production in the kidneys (4, 18). Differentiated podocytes were cultured under normal glucose (5 mm) or high glucose (25 mm) medium for 24 h. Northern blot analysis in podocytes indicated that miR-93 expression was significantly down-regulated in high glucose compared with normal glucose condition (Fig. 4, C and D). Using qPCR, we also found that the exposure of cultured podocytes to high glucose levels (25 mm) led to a near 2-fold decrease in miR-93 expression levels (Fig. 4E). Taken together, these findings validated our predicted profiling data on miR-93 expression both in vitro and in vivo.
miR-93 Targets vegfa 3′-UTR
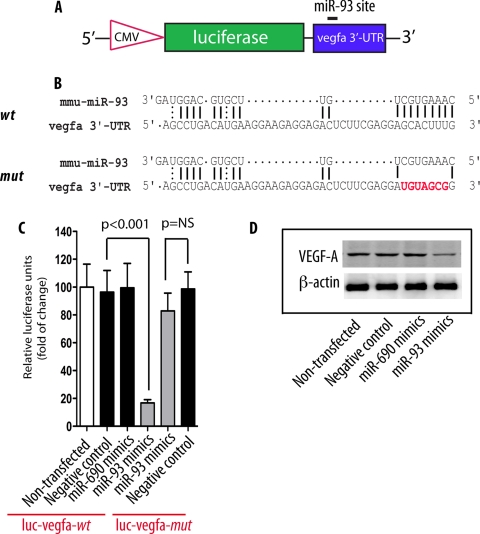
To address whether binding of miR-93 to the vegfa 3′-UTR leads to translational suppression of VEGF, we cloned mouse vegfa 3′-UTR into luciferase reporter vector 3.1-luc (18) (Fig. 5A). We also generated a mutated miR-93 binding site (miR-93 mutant) in which the putative miR-93 binding site (GCACUUU) in the vegfa 3′-UTR was mutated into UGUAGCG (Fig. 5B).
FIGURE 5.
miR-93 targets vegfa. A, schematic diagram of vegfa 3′-UTR reporter construct. B, sequence alignment between miR-93 and mouse vegfa 3′-UTR wild type (wt) and miR-93 mutant (mut). Red color indicates the sequence of the mutated miR-93 binding site. C, HeLa cells transfected with either luc-vegfa-wt or luc-vegfa-mutant, along with miR-93 mimics (30 nm). A nonrelated miRNA (miR-690) was used as control. Luciferase activities were normalized to β-galactosidase activities. Results were obtained from three independent experiments. Data are shown as mean ± S.E. (error bars). NS, nonsignificant. D, Western blot analysis of VEGF-A protein levels in cells transfected with miR-93 mimics.
Transient cotransfection of miR-93 mimics and luciferase expression plasmids in HeLa cells resulted in significant repression of the basal level of the vegfa transcript, whereas transfection of cells with miR-690 mimics, a control microRNA that was not predicted to target VEGF, did not have any effect on the expression of luciferase (Fig. 5C). Importantly, suppression of the vegfa 3′-UTR by miR-93 mimics was abrogated when cells were transfected with miR-93 mutant (Fig. 5C), consistent with the conclusion that miR-93 acts as a negative regulator of vegfa by binding to the vegfa 3′-UTR.
A connection between miR-93 and VEGF-A as its target was further substantiated when we assessed the protein levels of VEGF-A in the luciferase lysates using a monoclonal VEGF-A antibody. Western blot analysis indicated that transfection of cells with miR-93 mimics significantly decreased VEGF protein levels compared with that in control miR-690 transfected cells (Fig. 5D). Taken together, these results indicate that miR-93 down-regulates VEGF expression through binding to the 3′-UTR of the vegfa gene.
Effect of Gain of Function and Silencing of miR-93 on VEGF Protein Levels
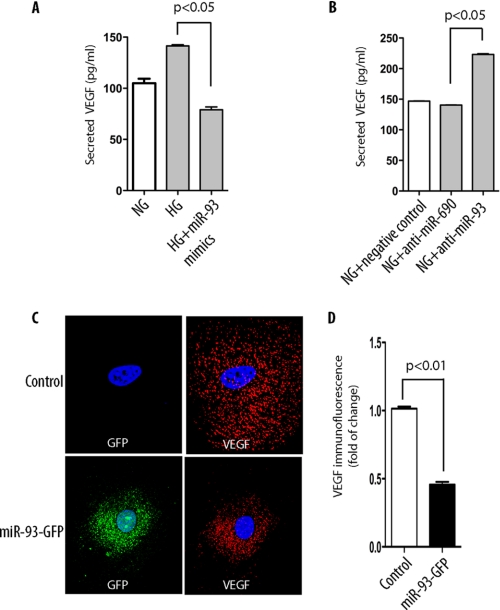
To address whether miR-93 modulates VEGF-A protein levels in podocytes, we transfected miR-93 mimics into podocytes and measured VEGF release in the medium under normal glucose (5 mm) or elevated glucose conditions (25 mm) by using ELISAs. Consistent with several previous reports (36, 37), we found that elevated glucose levels increased VEGF secretion (Fig. 6A). In contrast, transfection of podocytes with miR-93 mimics significantly reduced high glucose-induced VEGF release in the medium. Conversely, inhibition of miR-93 in podocytes with anti-miR-93 increased the secretion of VEGF in the medium, whereas inhibition of miR-690, as a control, did not have any effect (Fig. 6B). Thus, these findings suggest that overexpression or knockdown of miR-93 modulates VEGF production in podocytes.
FIGURE 6.
miR-93 represses VEGF-A production in podocytes. A, VEGF released into the culture medium was measured by ELISA after 24 h of exposure to high glucose (HG). Similar experiments were carried out in cells cultured in normal glucose (NG) medium. B, effect of miR-93 inhibitor on VEGF after 24 h of exposure to high glucose was measured by ELISA. C, podocytes were transfected with pEGP-miR-93 plasmid (green), and expression of VEGF (red) was assessed by deconvolution microscopy. Original magnification, ×400. D, quantitative analysis was based on fluorescence intensity of VEGF.
To support the notion that miR-93 could directly regulate VEGF-A expression in podocytes, we generated a podocyte cell line with stable expression of mouse miR-93 precursor using pEGP-miR-93 construct, which enabled us to monitor miR-93 expression by green fluorescent protein fluorescence. As shown in Fig. 6C, we observed significantly reduced fluorescent immunoreactivity of VEGF in miR-93-GFP-transfected podocytes compared with nontransfected control cells (Fig. 6, C and D). Taken together, these results indicate that miR-93 directly down-regulates VEGF expression.
miR-93 Represses High Glucose-induced Downstream Targets of VEGF in Podocytes
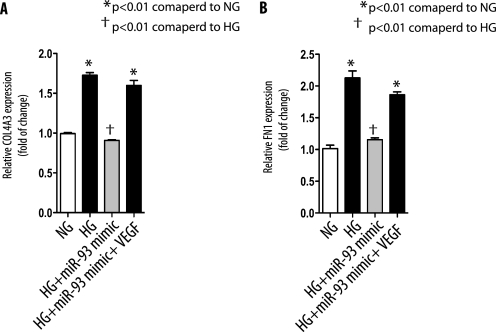
To investigate the biological significance of miR-93 as a regulator of VEGF in the kidneys, we analyzed the effect of miR-93 on the expression of two widely studied VEGF downstream targets, α3 collagen IV (COL4A3) and fibronectin (FN1) genes (3, 38). To this end, we transfected podocytes with miR-93 mimics before culturing them in normal glucose or high glucose medium. As shown in Fig. 7A, high glucose caused a significant increase in the expression of the COL4A3 gene. Transfection of miR-93 mimics in podocytes abrogated high glucose-induced COL4A3 expression. The effect of miR-93 on COL4A3 expression was VEGF-dependent because forced expression of VEGF cDNA lacking 3′-UTR in podocytes rescued the inhibitory effect of miR-93 on COL4A3 expression. Similar results were obtained with miR-93 and FN1 expression in podocytes (Fig. 7B).
FIGURE 7.
miR-93 inhibits high glucose-induced downstream target genes of VEGF. A, podocytes were transfected with miR-93 mimics with or without VEGF cDNA lacking 3′-UTR. Cells were serum-starved and exposed to high glucose (HG) for 24 h, and α3 collagen (IV) (COL4A3) or fibronectin (FN1). B, mRNAs were assessed by reverse transcription-qPCR. Expression levels of mRNAs were normalized as described under “Experimental Procedures.” Data are shown as mean ± S.E. (error bars).
Inhibition of miR-93 Expression by Morpholino Oligomers Mimics the Effect of Hyperglycemia on Glomerular VEGF Expression
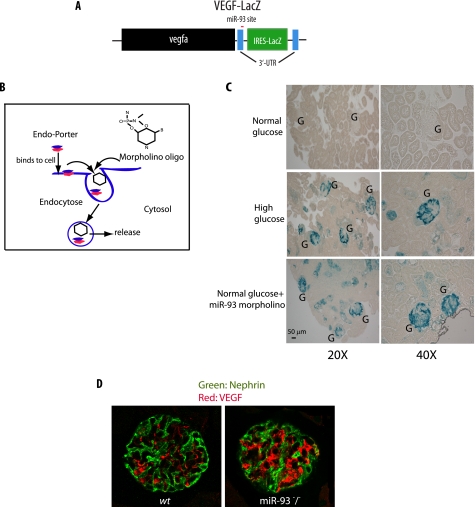
To assess the effect of miR-93 in normal and high glucose conditions on VEGF-A expression in the kidneys, we took advantage of a transgenic mouse line containing a VEGF-LacZ bicistronic transcript (22) (Fig. 8A). Use of these transgenic mice allowed visualization of β-galactosidase activity after increased VEGF-A expression in the kidneys (39). Kidney cortices from VEGF-LacZ mice were removed and cultured under either normal glucose (5 mm) or high glucose conditions (25 mm). After 72 h, kidneys were fixed, and whole mount LacZ staining of samples was performed. In normal glucose conditions, cultured glomeruli and tubular cells were very faintly stained, indicating very low expression of VEGF. In contrast, glomerular VEGF was strongly expressed when kidneys were cultured in high glucose conditions for 72 h (Fig. 8C). Importantly, miR-93 morpholino oligomers exposed to normal glucose conditions also induced β-galactosidase activity in cultured kidneys (Fig. 8C). These results strongly suggest that inhibition of miR-93 with morpholino oligomers leads to up-regulation of VEGF-A expression, mimicking the effect of high glucose conditions on VEGF.
FIGURE 8.
miR-93 regulates VEGF expression in kidneys. A, schematic diagram of the VEGF-LacZ targeting construct. B, mechanism of Endo-Porter system delivery through endocytosis. C, light microscopic images of whole mount X-gal staining demonstrating β-galactosidase activity (blue) in the glomeruli and tubular cells in the kidney sections from adult VEGF-LacZ mice. Kidney cortex pieces were cultured ex vivo in normal glucose, high glucose, or normal glucose in the presence of miR-93 morpholino oligomers. Original magnifications are ×200 and ×400. G, glomerulus. D, immunofluorescence staining of glomerular VEGF with anti-VEGF-A (red) and anti-nephrin (green) antibodies using confocal laser scanning microscopy. Original magnification, ×600.
To provide further experimental evidence for the effect of miR-93 on the expression VEGF in vivo, we explored VEGF-A expression in miR-93 knock-out (miR-93−/−) mice (40). As shown in Fig. 8D, glomerular VEGF immunostaining in miR-93−/− mice was markedly increased compared with that in control mice. This result suggests that miR-93 plays a critical role in regulating VEGF expression in vivo.
Transcriptional Regulation of MCM7 Promoter by High Glucose Is Responsible for miR-93 Repression
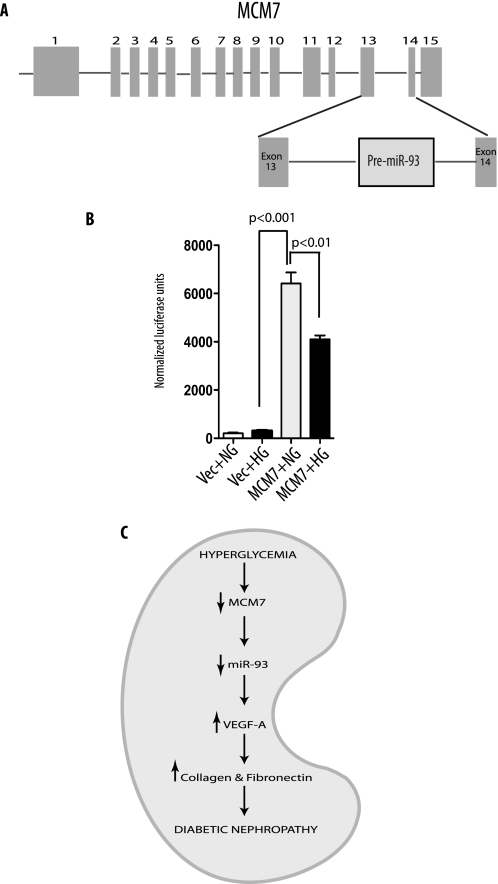
To address the underlying mechanism by which high glucose represses expression of miR-93, we sought to assess the effect of high glucose on miR-93 promoter. miR-93 is encoded by intron 13 of the host MCM7 gene (41), and its abundance is linked to the expression of MCM7 promoter (42) (Fig. 9A). The only reported human MCM7 promoter (34) has several transcription factor binding sites (E2F1, GC box, and E box), some of which have been reported to be glucose-responsive (43–45). Thus, we amplified a 500-bp upstream region of the mouse MCM7 promoter from podocyte genomic DNA by PCR and subcloned it into pGL4 luciferase reporter to create pGL4-miR-93-Luc construct. We then tested the promoter activity of pGL4-miR-93-Luc under normal or high glucose exposure in podocytes. Luciferase assay showed that the cloned 500-bp upstream region of MCM7 gene indeed had strong promoter activity, and hyperglycemia decreased luciferase activity reproducibly over its basal activity in normal glucose environment in podocytes (Fig. 9B), suggesting that the underlying regulatory mechanism by which miR-93 is down-regulated in hyperglycemic conditions is because of the regulatory effect of high glucose on a 500-bp upstream region of the transcriptional start of MCM7 promoter.
FIGURE 9.
High glucose down-regulates MCM7 promoter activity. A, diagram of the genomic organization of the mouse MCM7 gene. miR-93 is localized within the intron 13 of MCM7. B, luciferase activity of the cloned mouse MCM7 promoter in podocytes. Podocytes were transfected with empty vector (Vec) or mouse MCM7 promoter constructs. Luciferase activity in normal glucose (NG) or high glucose (HG) medium was measured and normalized to β-galactosidase internal control. Quantitative analysis of three independent experiments is shown as mean ± S.E. (error bars). C, proposed mechanism for the putative effects of high glucose on miR-93-mediated VEGF downstream signaling leading to diabetic nephropathy.
DISCUSSION
Previous reports have demonstrated the requirement of maintaining appropriate levels of VEGF-A for the proper development and function of kidney glomeruli (2–4). In the current study, we have identified miR-93 as a signature miRNA in the diabetic environment and a critical regulator of VEGF-A expression.
A major finding of this report is the identification of VEGF as a target of miR-93 in hyperglycemic conditions. It has been well established that the regulation of VEGF is tightly controlled at transcription, posttranscription, translation, and differential cellular localization of various isoforms (3, 46). Translational regulation of VEGF-A depends on the presence of internal ribosome entry sites in the 5′-UTR, whereas its transcriptional regulation involves a plethora of transcription factors (3). Identification of miR-93 in this report uncovers an additional layer of control by this class of regulatory molecules on VEGF expression in diabetic environment. Consistent with the conclusion that miR-93 regulates VEGF expression, forced expression of miR-93 repressed the transcription of vegfa 3′-UTR and prevented high glucose-induced increase in VEGF protein secretion. In cultured podocytes, the use of miR-93 mimics led to attenuated VEGF secretion, whereas the use of anti-miR-93 inhibitors caused a significant increase in VEGF production. We further showed that overexpression of miR-93 abrogated VEGF downstream targets such as collagen IV and fibronectin.
Another major finding of this study is that miR-93 can directly modulate VEGF expression in vivo. Indeed, by using a transgenic VEGF-LacZ mouse as our experimental model in vivo, we were able to (i) assess the effects of high glucose on VEGF in vivo and (ii) to investigate the effects of miR-93 inhibition on VEGF expression in kidneys ex vivo by taking advantage of morpholino oligomers. These findings indicate that VEGF is an important target of miR-93 in vivo in an animal model that recapitulates the regulatory events leading to modulation of VEGF expression.
The precise regulation of miRNAs expression is largely unknown. However, it is becoming increasingly evident that the integration of miRNAs into introns of protein coding genes represents a common and convenient mechanism for regulating the expression of miRNAs (47, 48). miR-93 is encoded by intron 13 of the MCM7 gene (41), and although our results suggest the presence of a glucose-responsive element on MCM7 promoter as the underlying regulatory mechanism by which miR-93 is down-regulated in hyperglycemic conditions, a recent report has suggested that miR-93 might also have its own promoter (47). Further studies are needed to validate the presence of a specific miR-93 promoter and examine the potential effect of high glucose on the putative miR-93-specific promoter.
VEGF plays myriad roles in microvascular complications of diabetes, including diabetic retinopathy and nephropathy. Recent publications have clearly established the roles of miR-192 and miR-377 in regulating a number of key genes involved in the pathogenesis of diabetic nephropathy in vitro (30, 49). However, the role of miRNAs on VEGF expression in the diabetic milieu remained unknown. The identification of miR-93 in this study as a novel regulator of VEGF in the diabetic environment could have important implications in further understanding the biology and functions of VEGF as a key mediator of angiogenesis and microvascular complications of diabetes.
In summary, we show that miR-93 has a modulatory effect on VEGF expression and its downstream signaling, which might play important roles in the pathogenesis of diabetic nephropathy (Fig. 9C). Future studies are under way in our laboratory to examine whether forced in vivo expression of miR-93 in an experimental murine model could override the stimulatory effect of hyperglycemia on VEGF expression. Dissecting molecular mechanisms by which miR-93 regulates VEGF both in normal and pathological conditions can lead to insights into preventing microvascular complications of diabetes. Although many obstacles remain to be addressed, miRNA mimics and miRNA antisense constructs could hold promise for the design of a new generation of drugs for the treatment of patients with diabetic kidney disease.
Supplementary Material
Acknowledgments
We thank Drs. R. Nicholas, R. Langley, P. Mundel, and A. Nagy for gifts of constructs or animals. We thank in situ Hybridization and Sequencing Cores at Baylor College of Medicine.
This work was supported, in whole or in part, by National Institutes of Health Grants R01DK067604 and R01DK078900 through the NIDDK.

The on-line version of this article (available at http://www.jbc.org) contains supplemental Tables 1–4.
- VEGF
- vascular endothelial growth factor
- DN
- diabetic nephropathy
- ELISA
- enzyme-linked immunosorbent assay
- miRNA
- microRNA
- miR-93
- microRNA-93
- qPCR
- quantitative PCR
- snRNA
- small nuclear RNA
- UTR
- untranslated region
- X-gal
- 5-bromo-4-chloro-3-indolyl-β-d-galactopyranoside.
REFERENCES
- 1.Eremina V., Baelde H., Quaggin S. (2007) Nephron Physiol. 106, 32–37 [DOI] [PubMed] [Google Scholar]
- 2.Eremina V., Jefferson J. A., Kowalewska J., Hochster H., Haas M., Weisstuch J., Richardson C., Kopp J. B., Kabir M. G., Backx P. H., Gerber H. P., Ferrara N., Barisoni L., Alpers C. E., Quaggin S. E. (2008) N. Engl. J. Med. 358, 1129–1136 [DOI] [PMC free article] [PubMed] [Google Scholar]
- 3.Chen S., Ziyadeh F. N. (2008) Curr. Diab. Rep. 8, 470–476 [DOI] [PubMed] [Google Scholar]
- 4.Eremina V., Sood M., Haigh J., Nagy A., Lajoie G., Ferrara N., Gerber H. P., Kikkawa Y., Miner J. H., Quaggin S. E. (2003) J. Clin. Invest. 111, 707–716 [DOI] [PMC free article] [PubMed] [Google Scholar]
- 5.Sugimoto H., Hamano Y., Charytan D., Cosgrove D., Kieran M., Sudhakar A., Kalluri R. (2003) J. Biol. Chem. 278, 12605–12608 [DOI] [PubMed] [Google Scholar]
- 6.Maynard S. E., Min J. Y., Merchan J., Lim K. H., Li J., Mondal S., Libermann T. A., Morgan J. P., Sellke F. W., Stillman I. E., Epstein F. H., Sukhatme V. P., Karumanchi S. A. (2003) J. Clin. Invest. 111, 649–658 [DOI] [PMC free article] [PubMed] [Google Scholar]
- 7.Aiello L. P., Avery R. L., Arrigg P. G., Keyt B. A., Jampel H. D., Shah S. T., Pasquale L. R., Thieme H., Iwamoto M. A., Park J. E., Nguyen H. V., Aiello L. M., Ferrara N., King G. L. (1994) N. Engl. J. Med. 331, 1480–1487 [DOI] [PubMed] [Google Scholar]
- 8.Brownlee M. (2001) Nature 414, 813–820 [DOI] [PubMed] [Google Scholar]
- 9.Natarajan R., Bai W., Lanting L., Gonzales N., Nadler J. (1997) Am. J. Physiol. Heart Circ. Physiol. 273, H2224–H2231 [DOI] [PubMed] [Google Scholar]
- 10.de Vriese A. S., Tilton R. G., Elger M., Stephan C. C., Kriz W., Lameire N. H. (2001) J. Am. Soc. Nephrol. 12, 993–1000 [DOI] [PubMed] [Google Scholar]
- 11.Flyvbjerg A., Dagnaes-Hansen F., De Vriese A. S., Schrijvers B. F., Tilton R. G., Rasch R. (2002) Diabetes 51, 3090–3094 [DOI] [PubMed] [Google Scholar]
- 12.Ambros V. (2004) Nature 431, 350–355 [DOI] [PubMed] [Google Scholar]
- 13.Farh K. K., Grimson A., Jan C., Lewis B. P., Johnston W. K., Lim L. P., Burge C. B., Bartel D. P. (2005) Science 310, 1817–1821 [DOI] [PubMed] [Google Scholar]
- 14.Asli N. S., Pitulescu M. E., Kessel M. (2008) Curr. Mol. Med. 8, 698–710 [DOI] [PubMed] [Google Scholar]
- 15.Stefani G., Slack F. J. (2008) Nat. Rev. Mol. Cell Biol. 9, 219–230 [DOI] [PubMed] [Google Scholar]
- 16.Suárez Y., Fernández-Hernando C., Pober J. S., Sessa W. C. (2007) Circ. Res. 100, 1164–1173 [DOI] [PubMed] [Google Scholar]
- 17.Yang W. J., Yang D. D., Na S., Sandusky G. E., Zhang Q., Zhao G. (2005) J. Biol. Chem. 280, 9330–9335 [DOI] [PubMed] [Google Scholar]
- 18.Du M., Roy K. M., Zhong L., Shen Z., Meyers H. E., Nichols R. C. (2006) FEBS J. 273, 732–745 [DOI] [PubMed] [Google Scholar]
- 19.Long J., Matsuura I., He D., Wang G., Shuai K., Liu F. (2003) Proc. Natl. Acad. Sci. U.S.A. 100, 9791–9796 [DOI] [PMC free article] [PubMed] [Google Scholar]
- 20.Langley R. R., Ramirez K. M., Tsan R. Z., Van Arsdall M., Nilsson M. B., Fidler I. J. (2003) Cancer Res. 63, 2971–2976 [PubMed] [Google Scholar]
- 21.Mundel P., Reiser J., Zúñiga M., Borja A., Pavenstädt H., Davidson G. R., Kriz W., Zeller R. (1997) Exp. Cell Res. 236, 248–258 [DOI] [PubMed] [Google Scholar]
- 22.Miquerol L., Gertsenstein M., Harpal K., Rossant J., Nagy A. (1999) Dev. Biol. 212, 307–322 [DOI] [PubMed] [Google Scholar]
- 23.Takemoto M., Asker N., Gerhardt H., Lundkvist A., Johansson B. R., Saito Y., Betsholtz C. (2002) Am. J. Pathol. 161, 799–805 [DOI] [PMC free article] [PubMed] [Google Scholar]
- 24.Bolstad B. M., Irizarry R. A., Astrand M., Speed T. P. (2003) Bioinformatics 19, 185–193 [DOI] [PubMed] [Google Scholar]
- 25.Rehmsmeier M., Steffen P., Hochsmann M., Giegerich R. (2004) RNA 10, 1507–1517 [DOI] [PMC free article] [PubMed] [Google Scholar]
- 26.Livak K. J., Schmittgen T. D. (2001) Methods 25, 402–408 [DOI] [PubMed] [Google Scholar]
- 27.Várallyay E., Burgyán J., Havelda Z. (2008) Nat. Protoc. 3, 190–196 [DOI] [PubMed] [Google Scholar]
- 28.Carson J. P., Eichele G., Chiu W. (2005) J. Microsc. 217, 275–281 [DOI] [PubMed] [Google Scholar]
- 29.Zeng L., Xu H., Chew T. L., Eng E., Sadeghi M. M., Adler S., Kanwar Y. S., Danesh F. R. (2005) FASEB J. 19, 1845–1847 [DOI] [PubMed] [Google Scholar]
- 30.Kato M., Zhang J., Wang M., Lanting L., Yuan H., Rossi J. J., Natarajan R. (2007) Proc. Natl. Acad. Sci. U.S.A. 104, 3432–3437 [DOI] [PMC free article] [PubMed] [Google Scholar]
- 31.Giuliani S., Perin L., Sedrakyan S., Kokorowski P., Jin D., De Filippo R. (2008) J. Urol. 179, 365–370 [DOI] [PubMed] [Google Scholar]
- 32.Nikopoulos G. N., Adams T. L., Adams D., Oxburgh L., Prudovsky I., Verdi J. M. (2008) BioTechniques 44, 547–549 [DOI] [PMC free article] [PubMed] [Google Scholar]
- 33.Wang J., Wang Y., Long J., Chang B. H. J., Wilson M. H., Overbeek P., Danesh F. R. (2010) Genesis, in press [DOI] [PMC free article] [PubMed] [Google Scholar]
- 34.Suzuki S., Adachi A., Hiraiwa A., Ohashi M., Ishibashi M., Kiyono T. (1998) Gene 216, 85–91 [DOI] [PubMed] [Google Scholar]
- 35.Doench J. G., Sharp P. A. (2004) Genes Dev. 18, 504–511 [DOI] [PMC free article] [PubMed] [Google Scholar]
- 36.Iglesias-de la Cruz M. C., Ziyadeh F. N., Isono M., Kouahou M., Han D. C., Kalluri R., Mundel P., Chen S. (2002) Kidney Int. 62, 901–913 [DOI] [PubMed] [Google Scholar]
- 37.Hoshi S., Nomoto K., Kuromitsu J., Tomari S., Nagata M. (2002) Biochem. Biophys. Res. Commun. 290, 177–184 [DOI] [PubMed] [Google Scholar]
- 38.Chen S., Kasama Y., Lee J. S., Jim B., Marin M., Ziyadeh F. N. (2004) Diabetes 53, 2939–2949 [DOI] [PubMed] [Google Scholar]
- 39.Enciso J. M., Gratzinger D., Camenisch T. D., Canosa S., Pinter E., Madri J. A. (2003) J. Cell Biol. 160, 605–615 [DOI] [PMC free article] [PubMed] [Google Scholar]
- 40.Ventura A., Young A. G., Winslow M. M., Lintault L., Meissner A., Erkeland S. J., Newman J., Bronson R. T., Crowley D., Stone J. R., Jaenisch R., Sharp P. A., Jacks T. (2008) Cell 132, 875–886 [DOI] [PMC free article] [PubMed] [Google Scholar]
- 41.Forsburg S. L. (2008) Biochem. Soc. Trans. 36, 114–119 [DOI] [PubMed] [Google Scholar]
- 42.Yeung M. L., Yasunaga J., Bennasser Y., Dusetti N., Harris D., Ahmad N., Matsuoka M., Jeang K. T. (2008) Cancer Res. 68, 8976–8985 [DOI] [PMC free article] [PubMed] [Google Scholar]
- 43.Asaumi S., Takemoto M., Yokote K., Ridall A. L., Butler W. T., Fujimoto M., Kobayashi K., Kawamura H., Take A., Saito Y., Mori S. (2003) J. Diabetes Complications 17, 34–38 [DOI] [PubMed] [Google Scholar]
- 44.Li F. X., Zhu J. W., Tessem J. S., Beilke J., Varella-Garcia M., Jensen J., Hogan C. J., DeGregori J. (2003) Proc. Natl. Acad. Sci. U.S.A. 100, 12935–12940 [DOI] [PMC free article] [PubMed] [Google Scholar]
- 45.Yao D., Taguchi T., Matsumura T., Pestell R., Edelstein D., Giardino I., Suske G., Rabbani N., Thornalley P. J., Sarthy V. P., Hammes H. P., Brownlee M. (2007) J. Biol. Chem. 282, 31038–31045 [DOI] [PubMed] [Google Scholar]
- 46.Loureiro R. M., D'Amore P. A. (2005) Cytokine Growth Factor Rev. 16, 77–89 [DOI] [PubMed] [Google Scholar]
- 47.Monteys A. M., Spengler R. M., Wan J., Tecedor L., Lennox K. A., Xing Y., Davidson B. L. (2010) RNA 16, 495–505 [DOI] [PMC free article] [PubMed] [Google Scholar]
- 48.Olena A. F., Patton J. G. (2010) J. Cell. Physiol. 222, 540–545 [DOI] [PMC free article] [PubMed] [Google Scholar]
- 49.Wang Q., Wang Y., Minto A. W., Wang J., Shi Q., Li X., Quigg R. J. (2008) FASEB J. 22, 4126–4135 [DOI] [PMC free article] [PubMed] [Google Scholar]
Associated Data
This section collects any data citations, data availability statements, or supplementary materials included in this article.


