Abstract
Aim
To determine if retinal ganglion cell (RGC) loss influences the loss of surrounding RGCs to generate clustered patterns of cell death in human glaucoma. We hypothesise that retinal ganglion cell loss accelerates the loss of surrounding cells to generate, at a local, cellular scale, clustered patterns of retinal of RGC death. The absence of these interactions would result in a diffuse pattern of RGC loss.
Method
Six glaucomatous retinas (67-83 years old) and six age-matched control retinas (61-89 years old) were prepared as wholemounts and stained by 4′,6-diamidino-2-phenylindole (DAPI) solution (3μg/mL in PBS). An area corresponds to central 14 degree of the visual field was imaged. The nearest neighbour distribution was determined for cells in both normal and glaucomatous RGCL.
Results
We observed clustered RGC loss in human glaucoma on a background of diffuse loss. The mean nearest neighbour distance (NND) of the glaucomatous retinas was significantly higher compared with controls (p<0.001). The distribution of NND in glaucomatous retinas was skewed to the higher values with a higher positive kurtosis relative to controls. The quantitative analysis of the pattern of cell loss is supported by the visual inspection of the patterns of cell loss.
Discussion
Nearest neighbour analysis is consistent with the presence of two patterns of cell loss in the RGCL in glaucoma. While the diffuse of cell loss can account for an overall reduction in the RGC population and additional non random pattern is consistent with the hypothesis that RGC loss has a local influence on the viability of surrounding cells.
Keywords: retina, degeneration
Introduction
The loss of retinal ganglion cells (RGCs) and associated reduction in visual sensitivity is the hallmark event in glaucoma. Clinical patterns of visual loss have been well documented by automated perimetry and reflect the coarse topography of RGC loss secondary to focal or diffuse damage to the optic nerve1. Although RGC loss in human and primate glaucoma has been quantified at a cellular level2, 3, relatively little is known of the spatial pattern of RGC loss in retinal areas corresponding to reduced visual sensitivity. Knowledge of this is important if we are to understand the functional implications of RGC loss and, in particular, whether pre-existing damage predisposes the retina to progressive RGC loss. In glaucoma, RGCs are known to die by apoptosis, which is associated with activation of microglia4 and the possible release of agents that might affect the viability of surrounding cells5. If the dying RGCs do not influence the rate of surrounding cell loss, this should result in a diffuse pattern of cell loss in which individual cells are lost in a stochastic fashion. By contrast, if the loss of cells renders the secondary death of surrounding cells, this should generate a clustered pattern of cell loss. Recent evidence documenting reduced survival of cells adjacent to areas of damage6 suggests that this may be a possibility worth further study.
To test this hypothesis we have used nearest neighbour analysis (NNA) to compare the distribution of the neurons in the retinal ganglion cell layer (RGCL) of normal and glaucomatous human eyes. NNA has been widely used to study the spatial pattern of objects and the topography and mosaic regularity of retinal neurons7, 8. The nearest neighbour distance (NND) is computed in NNA and for the selected cell population; it represents the distance from its centre point to that of the closest adjacent neuron. NNA can be used to quantify the spatial randomness of points by comparing NNDs from representative samples with those from related cases or with theoretically hypothesized models. When applied to the DBA2/J mouse model of glaucoma9, the mean NND increased with cell loss as would be expected. However the distribution of NNDs within the population changed with a tendency to increase the proportion of high NND values within the distribution. These data suggest both a diffuse and focal pattern of cell loss in experimental murine glaucoma. In the present study we determined whether this was the case in human glaucoma.
Materials and Methods
Retina preparation
Storage and research using human tissue samples was carried out according to Human Tissue Authority regulations under the Human Tissue Act 2004, under the HTA license for Cathays Park campus, Cardiff University, UK. Six glaucomatous retinas (67-83 years old) and six age-matched control retinas (61-89 years old) were used in the study. Detailed clinical histories were available for four out of six glaucomatous eyes, all of which had primary open angle glaucoma (POAG) with IOPs prior to treatment being in the range of 16-28 mmHg. None of the control eyes were from patients receiving ophthalmic care. All post-mortem human retinas were fixed in 4% paraformaldehyde within 24 hours of death. The retinas were dissected as wholemount preparations in which retinal segments were stained by 4′,6-diamidino-2-phenylindole (DAPI) solution (1μg/mL in PBS) for 20 min and then flat mounted with hard set mounting medium for fluorescence (VECTASHIELD®, Vector Laboratories, UK).
Image acquisition
The retinal whole mounts were imaged with an epifluorescence microscope (Leica DM6000B, UK) equipped with a digital camera (MBF CX9000, Germany), as previously described. 22 frames were taken for each retina with a ×10 objective (HC PL APO NA 10×/0.40, Leica, UK) to cover 30% of the area corresponding to the central 15 deg of vision (4 mm eccentricity). During image acquisition, the sampling scheme was strictly based on a sampling grid which was modified from Humphrey 32-2 visual field analyser. We selected the sampling grid to provide a reference to clinically derived information. The motorized stage of the microscope was set to sample at the exact position of the grid, the accuracy of which is 1 micron (LUDL electronics encoder, Mac5000, UK). RGCL neurons were imaged by focusing through the RGCL and marking the centres of all cells with a digital marker.
Morphometric data collection
For 2D NNA, neuron nuclei were detected using an established method10, implemented as a plug-in in the public domain of ImageJ (ITCN, ImageJ version 1.34, US National Institutes of Health)11. The minimum width for searching nuclei centres was set to 10 pixels with a threshold level of 0.3 pixels. Endothelial cells (elongated nuclei), astrocytes and glia cells12 were filtered and excluded on the basis of their shape, size and laminar organisation. Images were further processed using a particle counting function in Neurolucida (MicroBrightField, Inc) and the NNDs determined by Neurolucida Explorer (MicroBrightField, Inc). In the central retina where there were several layers of the cells, the results from 2D NNA was validated by 3D NNA based on multiphoton images of DAPI staining acquired by Leica TCS SP2 confocal system equipped with a Leica DMRE microscope (HCX PL Apo 40/1.25 NA oil CS objective lens; Leica, Milton Keynes, UK) (n=6). In the 3D image stacks, the centre of each nuclei was marked by cell counter plug-in of ImageJ and the xyz coordinates were determined; the NNDs were calculated by a macro written in ImageJ , where (x1,y1,z1) and (x2,y2,z2) are the xyz coordinates of the two nearest neighbour cells. This computer program aided method minimised the influence of manual bias. The observer was masked in the calibration of the cell counting algorithms.
Nearest neighbour analysis
The average NND in glaucomatous retinas (n=6) was compared with that from age-matched control retinas (n=6). The regularity index (RI) was calculated to quantify the regularity of the neuronal spatial patterns based on the ratio of average NND to the standard deviation of NNDs within a sample. For a random pattern, RI values significantly above 2 are consistent with a regularly spaced array13. The Nearest neighbour index (NNI) measures the degree of spatial dispersion in the distribution based on NNDs. It is defined as the ratio of the average NND to the expected value of NND in a random pattern of the same mean density14.
Statistical analysis
NND values were not normally distributed comparisons were therefore made using the Mann–Witney U Test (SPSS 14.0. for Windows).
Results
Preliminary work indicated that for samples taken from the macula region 2 dimensional (2D) and 3 dimensional NND calculations were not significantly different (p>0.8). All the values given in this study were therefore based on the computationally simpler 2D NND measurements. In total, 71,276 nuclei were counted in glaucomatous retinas and 120,036 in age-matched control retinas. Our data confirmed that neuron density was highest in the perifoveal region; the greatest density reduction in glaucomatous retinas was between 2-3 mm eccentricity and was approximately 43% ± 4% (mean ± SD).
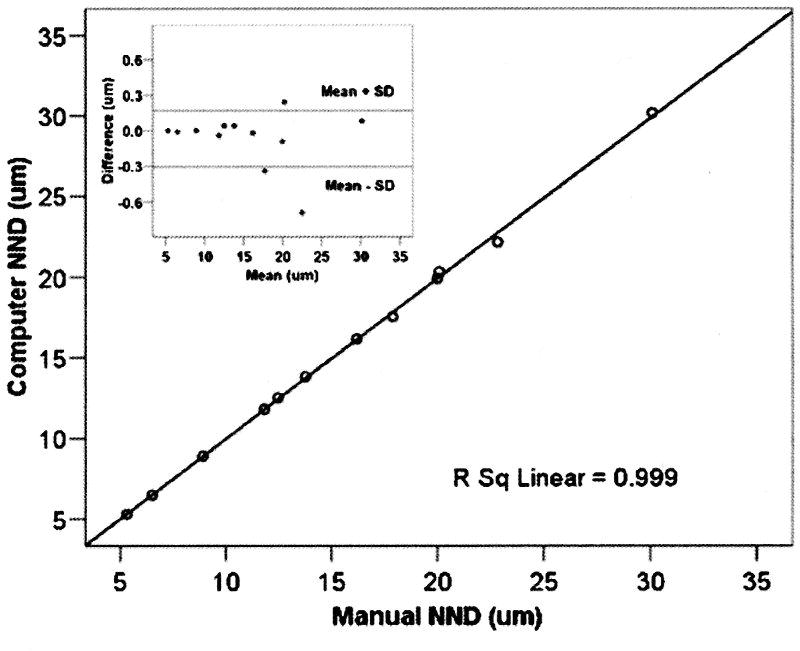
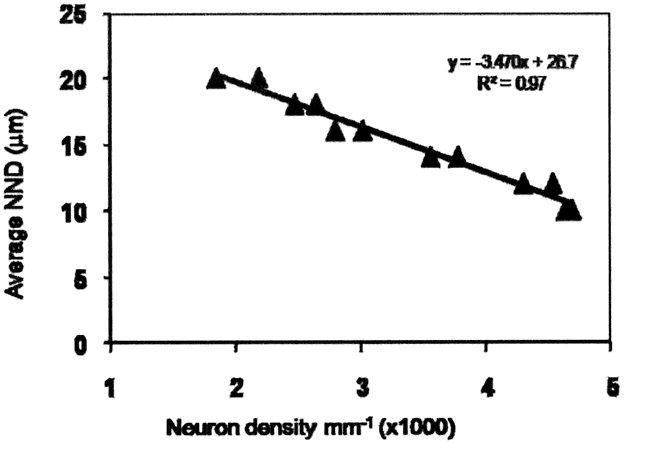
There was close agreement between NNDs measured by manual and computer methods (r2= 0.998, Figure 1). A Bland Altman analysis did not indicate a systematic error in measurements made by automated or manual methods (Figure 1, inset). As expected, the neuron density was inversely correlated with the average NNDs (r2 =0.97, Figure 2).
Figure 1.

Average nearest neighbour distance (NND) of neurons in RGCL determined by manual (n=6) and automated methods (n=6). 20 sample areas (0.96 mm2 each) were selected across the 12 retinas to cover the full density range. Best-fit linear regression equation and corresponding correlation coefficient (R2) are indicated. The Bland-Altman plot (inset) is shown for NND> 20 μm.
Figure 2.

Plot of average NND against neuron density. Density is expressed in mm-1. The best fit linear regression is shown (R2 = 0.96).
The Distribution of nearest neighbour distances
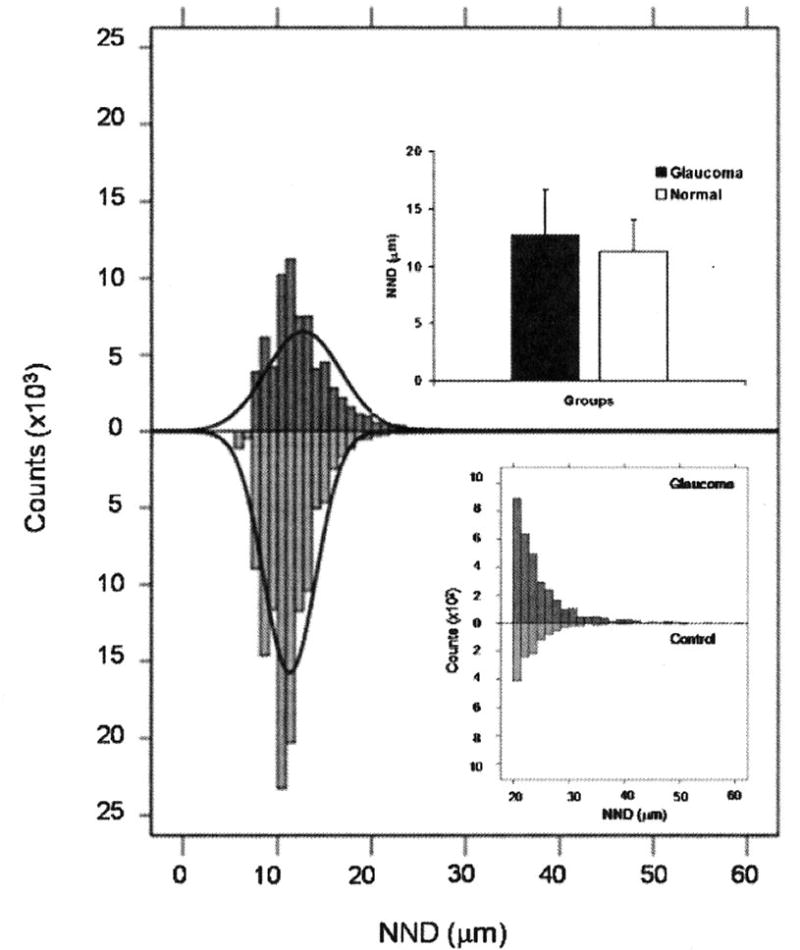
The mean NND of the glaucomatous retinas was significantly higher (8.9%) compared with controls (Mann-Witney U test, p<0.001). The distribution of NNDs in glaucomatous retinas was skewed to the higher values with a higher positive kurtosis relative to controls (Figure 3a). The percentage of NNDs greater than 20 μm in glaucomatous and control retinas was 4.5% and 1.0%, respectively (Mann-Whitney U test, P<0.001). In glaucomatous retinas, the proportion of NNDs greater than 40μm was 8.2 fold greater compared with controls (Figure 3b).
Figure 3.

NND distributions in glaucomatous and age-matched control retinas. Overall, the mean NND value for glaucomatous eyes is significantly higher than normal eyes (p<0.001, upper inset). The NNDs in glaucomatous retinas are shifted to the right compared with controls. The skewnss and kurtosis of the NND distribution in glaucoma group is 2.26 and 16.35 compared with 1.77 and 10.61 in normal group. The lower inset shows the histogram of NND with values from glaucomatous and normal eyes for NND > 20 μm. The greater magnification of the graph illustrates the shift of NND values towards high values in the glaucomatous eyes.
The RI was 3.2 for glaucomatous retinas compared with 4.1 in for age-matched controls, which indicating a shift in glaucomatous retinas towards a less regular arrangement of neurons in the RGCL. The NNI was 1.8 (z-score 13.0) in glaucomatous retinas and 2.1 (z-score 8.8) in controls. The lower z-score of NNI in glaucomatous retinas was consistent with a more dispersed neuronal distribution.
Discussion
The present study was designed to evaluate the topography of neuronal loss in the RGCL at a greater resolution than is possible with clinical methods of assessment. Our methodology for quantifying the spatial distribution is robust and shows a good agreement with manual assessment (Figure 1). An important limitation of the automated counting method was that amacrine cells could not be excluded. However, since amacrine cells are comparatively preserved in glaucoma15, 16 and, in the human the proportions of cells in the RGCL that are displaced amacrine cells is small (3% for central retina17) it is unlikely that this will have had a significant effect on our results. Differences in vascularity are also unlikely to be a confounding factor since these areas were excluded in the sampling process.
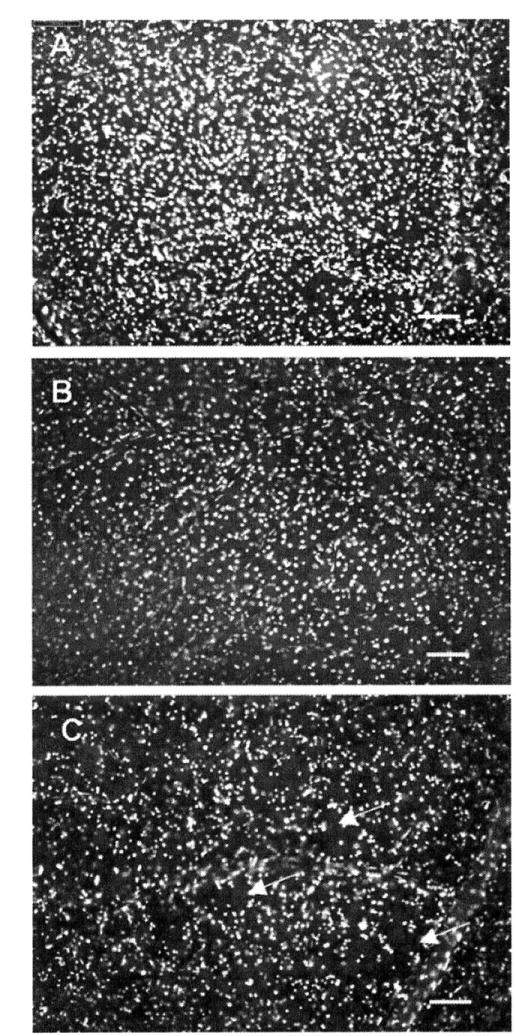
As expected, NNDs in glaucomatous eyes increased compared with control eyes, consistent with the overall reduction in the RGC density (Figure 3a). It is important to note that within the region corresponding to the central 15 degree (radius) of visual field, a substantial component of the pattern of neuron loss in the RGCL was diffuse, as demonstrated by a right shift of the overall NND distribution in glaucomatous retinas relative to controls. However, the skew in this distribution to higher NND values (evident as the increase in the proportion of NNDs greater than 40μm in the mid-peripheral retina, Figure 3b) suggests that a clustered pattern of cell loss is also present on the background of diffuse loss. This quantitative analysis of the pattern of cell death is supported by visual inspection of the patterns of cell loss in glaucomatous eyes (Figure 4). It is important to stress that the clustered loss we refer to here occurs at a much smaller scale than clinical observations of focal damage18. Similar findings have been reported following 2D NND analysis in the murine glaucoma model9.
Figure 4.

Images showing the distribution of neuronal nuclei labelled with DAPI. A: control retina, B: glaucomatous retina with diffuse loss (NNI 1.7 and RI 6.1). C: glaucomatous retina with focal loss (NNI 2.0 and RI 7.3). Image resolution is 1600×1200 pixels, with resolution of 1.98 pixels/mm2. Scale bar 100 μm.
Evidence for both diffuse and clustered cells loss in the RGCL contributes to our understanding of the processes underlying RGC death. RGC loss can be generated by global damage to the RGC population either arising from the focal pattern of optic nerve damage or as a result of retinal damage. However, the marked clustered pattern of RGC loss occurs at too fine a resolution to be explained by events at the optic nerve since the topographic arrangement axons within the optic nerve head is imprecise 19, 20. Furthermore, it was demonstrated that in glaucoma, in addition to RGC loss, there is secondary death of synaptic neurons, e.g. neurons in the inner nucleus layer, the outer nucleus layer 21 and lateral geniculate nucleus 22. Secondary degeneration is a consistent feature of CNS injury in which focal neuronal loss alter the viability of surrounding cells 23, 24. Therefore, we suggest that secondary degeneration is one of the possible mechanisms that might be responsible for the clustered pattern of cell death. Increased level of local glutamate and free radicals, alteration in the ionic concentrations and the depletion of growth factors 25 can cause secondary death of surrounding neurons. Evidence for secondary RGC loss is important, since it suggests that treatments should be developed to mitigate the damaging effects of neuronal loss.
Evidence for both diffuse and clustered cells loss in the RGCL contributes to our understanding of the processes underlying RGC death. Diffuse RGC loss can be generated by global damage to the RGC population either arising from the optic nerve or as a result of diffuse retinal damage. By contrast, the clustered pattern of loss occurs at too fine a resolution to be explained by events at the optic nerve since the topographic arrangement axons within the optic nerve head is imprecise20. An appealing explanation is that it results from secondary degeneration possibly in response to injurious effects of surrounding degenerating cells. It has been suggested that secondary degeneration is a consistent feature of CNS injury in which focal neuronal loss alter the viability of surrounding cells24. A number of mechanisms have been suggested, including local glutamate induced excitotoxicity, alterations in the ionic concentrations, increased amounts of free radicals or the depletion of growth factors25. Evidence for secondary RGC loss is important, since it suggests that treatments should be developed to mitigate the damaging effects of neuronal loss.
Acknowledgments
This project is sponsored by Research Into Ageing, UK. The glaucoma eyes came from grants NIH EY 15736 (MPF), NIH EY 07065 (MPF, DHJ). The statistical support from Mr P McGeoghan is much appreciated.
Funding: Grants: Research Into Ageing (Grant No. 127), NIH EY 15736 (MPF), NIH EY 07065 (MPF, DHJ).
Footnotes
Competing Interest: Please list Competing Interests if they exist if not please include the following statement; Competing Interest: None declared. For further information please see; http://bjo.bmj.com/ifora/licence.dtl
Publisher's Disclaimer: The Corresponding Author has the right to grant on behalf of all authors and does grant on behalf of all authors, an exclusive licence (or non exclusive for government employees) on a worldwide basis to the BMJ Publishing Group Ltd to permit this article (if accepted) to be published in BJO and any other BMJPGL products and sublicences such use and exploit all subsidiary rights, as set out in our licence (http://bjo.bmj.com/ifora/licence.pdf).
References
- 1.Caprioli J. Clinical evaluation of the optic nerve in glaucoma. Trans Am Ophth Soc. 1994;XCII:590–641. [PMC free article] [PubMed] [Google Scholar]
- 2.Quigley HA, Dunkelberger GR, Green WR. Retinal ganglion cell atrophy correlated with automated perimetry in human eyes with glaucoma. Am J Ophthalmol. 1989;107:453–464. doi: 10.1016/0002-9394(89)90488-1. [DOI] [PubMed] [Google Scholar]
- 3.Quigley HA. Neuronal death in glaucoma. Prog Retin Eye Res. 1999;18:39–57. doi: 10.1016/s1350-9462(98)00014-7. [DOI] [PubMed] [Google Scholar]
- 4.Yuan L, Neufeld AH. Activated microglia in the human glaucomatous optic nerve head. J Neurosci Res. 2001;64:523–532. doi: 10.1002/jnr.1104. [DOI] [PubMed] [Google Scholar]
- 5.Neufeld AH. Nitric oxide: a potential mediator of retinal ganglion cell damage in glaucoma. Surv Ophthalmol. 1999;43 1:S129–135. doi: 10.1016/s0039-6257(99)00010-7. [DOI] [PubMed] [Google Scholar]
- 6.Levkovitch-Verbin H, Quigley HA, Martin KR, Zack DJ, Pease ME, Valenta DF. A model to study differences between primary and secondary degeneration of retinal ganglion cells in rats by partial optic nerve transection. Invest Ophthalmol Vis Sci. 2003;44:3388–3393. doi: 10.1167/iovs.02-0646. [DOI] [PubMed] [Google Scholar]
- 7.Eglen SJ. Development of regular cellular spacing in the retina: theoretical models. Math Med Biol. 2006;23:79–99. doi: 10.1093/imammb/dql003. [DOI] [PubMed] [Google Scholar]
- 8.Rossi C, Strettoi E, Galli-Resta L. The spatial order of horizontal cells is not affected by massive alterations in the organization of other retinal cells. J Neurosci. 2003;23:9924–9928. doi: 10.1523/JNEUROSCI.23-30-09924.2003. [DOI] [PMC free article] [PubMed] [Google Scholar]
- 9.Filippopoulos T, Danias J, Chen B, Podos SM, Mittag TW. Topographic and morphologic analyses of retinal ganglion cell loss in old DBA/2NNia mice. Invest Ophthalmol Vis Sci. 2006;47:1968–1974. doi: 10.1167/iovs.05-0955. [DOI] [PubMed] [Google Scholar]
- 10.Byun J, Verardo MR, Sumengen B, Lewis GP, Manjunath BS, Fisher SK. Automated tool for the detection of cell nuclei in digital microscopic images: application to retinal images. Mol Vis. 2006;12:949–960. [PubMed] [Google Scholar]
- 11.Collins TJ. ImageJ for microscopy. Biotechniques. 2007;43:25–30. doi: 10.2144/000112517. [DOI] [PubMed] [Google Scholar]
- 12.Ramirez J, Trivino A, Ramirez A, Salazar J, Garcia-Sanchez J. Structural specializations of human retinal glial cells. Vis Res. 1996;36:2029–2036. doi: 10.1016/0042-6989(95)00322-3. [DOI] [PubMed] [Google Scholar]
- 13.Cook JE. Spatial properties of retinal mosaics: an empirical evaluation of some existing measures. Vis Neurosci. 1996;13:15–30. doi: 10.1017/s0952523800007094. [DOI] [PubMed] [Google Scholar]
- 14.Donnelly K. Simulation Methods in Archeology. Cambridge: Cambridge University Press; 1978. Simulations to determine the variance and edge effect of total nearest neighbour distance; pp. 91–95. [Google Scholar]
- 15.Kielczewski JL, Pease ME, Quigley HA. The effect of experimental glaucoma and optic nerve transection on amacrine cells in the rat retina. Invest Ophthalmol Vis Sci. 2005;46:3188–3196. doi: 10.1167/iovs.05-0321. [DOI] [PMC free article] [PubMed] [Google Scholar]
- 16.Moon JI, Kim IB, Gwon JS, et al. Changes in retinal neuronal populations in the DBA/2J mouse. Cell Tissue Res. 2005;320:51–59. doi: 10.1007/s00441-004-1062-8. [DOI] [PubMed] [Google Scholar]
- 17.Curcio CA, Allen KA. Topography of ganglion cells in human retina. J Comp Neurol. 1990;300:5–25. doi: 10.1002/cne.903000103. [DOI] [PubMed] [Google Scholar]
- 18.Caprioli J, Sears M, Miller J. Patterns of early visual field loss in glaucoma. Am J Ophthalmol. 1987;103:512–517. doi: 10.1016/s0002-9394(14)74273-4. [DOI] [PubMed] [Google Scholar]
- 19.Ogden T. Nerve fiber layer of the macaque retina: retinotopic organization. Invest Ophthalmol Vis Sci. 1983;24:85–98. [PubMed] [Google Scholar]
- 20.Fitzgibbon T, Taylor S. Retinotopy of the human retinal nerve fibre layer and optic nerve head. J Comp Neurol. 1996;375:238–251. doi: 10.1002/(SICI)1096-9861(19961111)375:2<238::AID-CNE5>3.0.CO;2-3. [DOI] [PubMed] [Google Scholar]
- 21.Lei Y, Garrahan N, Hermann B, et al. Quantification of retinal transneuronal degeneration in human glaucoma: a novel multiphoton-DAPI approach. Investigative ophthalmology & visual science. 2008;49:1940–1945. doi: 10.1167/iovs.07-0735. [DOI] [PubMed] [Google Scholar]
- 22.Gupta N, Yucel YH. Should we treat the brain in glaucoma? Canadian journal of ophthalmology. 2007;42:409–413. [PubMed] [Google Scholar]
- 23.Crowe MJ, Bresnahan JC, Shuman SL, Masters JN, Beattie MS. Apoptosis and delayed degeneration after spinal cord injury in rats and monkeys. Nat Med. 1997;3:73–76. doi: 10.1038/nm0197-73. [DOI] [PubMed] [Google Scholar]
- 24.Farkas O, Povlishock JT. Cellular and subcellular change evoked by diffuse traumatic brain injury: a complex web of change extending far beyond focal damage. Prog Brain Res. 2007;161:43–59. doi: 10.1016/S0079-6123(06)61004-2. [DOI] [PubMed] [Google Scholar]
- 25.Nickells RW. From ocular hypertension to ganglion cell death: a theoretical sequence of events leading to glaucoma. Can J Ophthalmol. 2007;42:278–287. [PubMed] [Google Scholar]


