

Abstract
PURPOSE Chronically ill older patients with multiple conditions are challenging to care for, and new models of care for this population are needed. This study evaluates the effect of the Guided Care model on primary care physicians’ impressions of processes of care for chronically ill older patients.
METHODS In Guided Care a specially educated registered nurse works at the practice with 2 to 5 primary care physicians, performing 8 clinical activities for 50 to 60 chronically ill older patients. The care model was tested in a cluster-randomized controlled trial between 2006 and 2009. All eligible primary care physicians in 14 pods (teams of physicians and their chronically ill older patients) agreed to participate (n = 49). Pods were randomly assigned to provide either Guided Care or usual care. Physicians were surveyed at baseline and 1 year later. We assessed the effects of Guided Care using responses from 38 physicians who completed both survey questionnaires. We measured physicians’ satisfaction with chronic care processes, time spent on chronic care, knowledge of their chronically ill older patients, and care coordination provided by physicians and office staff.
RESULTS Compared with the physicians in the control group, those in the Guided Care group rated their satisfaction with patient/family communication and their knowledge of the clinical characteristics of their chronically ill older patients significantly higher (ρ<0.05 in linear regression models). Other differences did not reach statistical significance.
CONCLUSIONS Based on physician report, Guided Care provides important benefits to physicians by improving communication with chronically ill older patients and their families and in physicians’ knowledge of their patients’ clinical conditions.
Keywords: Chronic care, randomized controlled trial, physician satisfaction, Guided Care
INTRODUCTION
Little is known about primary care physicians’ satisfaction with the care they provide to chronically ill older patients, a group that is rapidly growing as the baby boom generation ages. Many such patients are challenging to manage because they have multiple chronic conditions and heterogeneous, complex needs and because they see many physicians and other clinicians.1 Physicians receive little specific training in providing chronic care,2,3 yet insurers are placing increasing pressure on them to provide higher quality care more efficiently, to report measures of care quality (such as tests and treatments for specific conditions),4 and to accept adjustments in payment based on these quality measures. Value-based purchasing demonstrations sponsored by the Centers for Medicare & Medicaid Services (CMS) (eg, the Physician Group Practice and Medicare Medical Home projects) posit that new models of practice can improve quality and efficiency by better coordinating and managing patient care. Such models require new roles and work processes for physicians, however, and these models may affect primary care physicians’ satisfaction with their work, an increasingly important consideration in attracting physicians to and retaining them in primary care.
Guided Care is a new model of comprehensive care that was developed to improve the quality and outcomes of health care and to reduce the health care costs of chronically ill older patients. In Guided Care, a specially educated registered nurse joins a primary care practice team to enhance care for its chronically ill older patients. The Guided Care model, summarized in the next section, is described in detail elsewhere.5 Its early effects on the quality and efficiency of care were reported recently.6,7 Knowledge of the effects of Guided Care on physicians’ satisfaction with chronic care may help inform physicians’ and organizations’ decisions regarding the adoption of Guided Care. We report the effects of Guided Care on physicians’ satisfaction with several processes included in the chronic care they provide. We also report physicians’ ratings of the time they spend on chronic care, their knowledge of their chronically ill older patients, and the care coordination provided by their practices.
Background
To our knowledge, physicians’ satisfaction with specific processes of the care they provide to chronically ill older patients has not been reported previously. What is known, with respect to similar but broader groups, is that physicians tend to engage in less social or mutual conversation and more disagreement with sicker patients, as measured by patient and physician report of health status,8 and tend to like them less than healthier patients.9,10 The extent to which physicians report liking patients is positively associated with physicians’ and patients’ satisfaction with care.10,11
The literature suggests that physicians often have less productive communication with older patients, who tend to be less participatory, ask fewer questions, and provide less information to their physicians.12,13 The complexity of their older patients’ medical conditions often impedes physicians’ ability to elicit the patients’ full agenda for the visit14 and to engage them in mutual decision making.15 The quality of such patient-physician communication affects patients’ knowledge of their illnesses, their adherence to treatment recommendations, and their health-related outcomes.16–18
The Guided Care Model
Guided Care integrates several successful recent innovations in attempting to improve the quality, efficiency, and outcomes of health care for chronically ill older patients and their family caregivers. As described in detail elsewhere,5 Guided Care is provided by a practice-based team that includes a registered nurse, 2 to 5 physicians, and the other members of the office staff. For each patient in a case load of 50 to 60 chronically ill older patients, the Guided Care nurse supplements the care provided by other team members by conducting 8 processes: (1) assessing the patient comprehensively at home, (2) creating an evidence-based Care Guide and an Action Plan, (3) monitoring and coaching the patient monthly, (4) coordinating the efforts of all of the clinicians who provide the patient’s health care, (5) smoothing the patient’s transitions between sites of care, (6) promoting the patient’s self-management, (7) educating and supporting family caregivers, and (8) facilitating access to appropriate community resources.
Guided Care was recently evaluated in a cluster-randomized-controlled trial involving 49 physicians at 8 primary care practices and 904 of their chronically ill older patients who were insured by 1 of 3 insurance plans.6 Other analyses from this study have shown that Guided Care improves self-reported quality of chronic health care as measured by the Patient Assessment of Chronic Illness Care.6,19 Family caregivers’ perceptions of the quality of the chronic illness care received were also improved.20 Preliminary results indicated that Guided Care may be associated with less use of expensive health services (ie, hospital, skilled nursing facility, and home care services) and an annual net savings in health care costs of $1,364 per patient.7 The randomized-controlled trial was powered on differences between the groups’ patient outcomes, not on differences between the groups’ physician satisfaction ratings.
We hypothesized that, compared with usual care, Guided Care would be associated with greater physician satisfaction with several processes included in chronic care, as well as with greater knowledge of chronically ill patients’ clinical characteristics and better coordination of their care. We did not hypothesize an effect of Guided Care on the amount of time physicians devote to managing their chronically ill older patients, because a Guided Care nurse might pick up on previously unrecognized patient needs (thus requiring more physician time) while simultaneously relieving physicians of the need to perform some tasks (thus requiring less physician time).
METHODS
Recruitment
Participation in the Guided Care trial was offered to practices in 3 health care delivery systems in the Baltimore-Washington, DC, area. Practices were eligible if they cared for panels of at least 650 patients aged 65 years or older and could provide an on-site office for a Guided Care nurse. Eight practices were eligible, and all chose to participate. Three practices were operated by Kaiser Permanente Mid-Atlantic States, a group-model health maintenance organization (HMO); 4 were operated by Johns Hopkins Community Physicians, a statewide network of community-based practices; and 1 was operated by Medstar Physician Partners, a multisite group practice. Individual primary care physicians were eligible if they worked at least 70% time at these practices. All were briefed on the requirements of the study, and all gave written informed consent to be randomized and to participate. The study was approved by the institutional review boards of the Johns Hopkins Bloomberg School of Public Health, Kaiser-Permanente Mid-Atlantic States, and the Medstar Research Institute.
Randomization
Fourteen pods, comprised of 49 physicians caring for 904 chronically ill older patients within the 8 practices participating in the study, were randomly assigned to either Guided Care or usual care. Within the 6 practice sites that housed 2 pods each, 1 pod was randomly assigned to Guided Care and 1 to usual care. In the 2 remaining smaller practices (which were similar to each other in size, location, and ownership), physicians in 1 were randomized to provide Guided Care while those in the other continued to provide usual care.
Survey Development and Data Collection
Physicians participating in the study were requested to complete a questionnaire anonymously at the baseline and 1 year later, after Guided Care nurses had been working with their complete case-loads of patients for approximately 6 months. The questionnaires elicited information about the physicians’ characteristics and included 11 questions about the physicians’ satisfaction with specific processes in their care of chronically ill older patients (each with 6 response options, ranging from “very dissatisfied” to “very satisfied”). Five additional questions inquired about the time physicians spent managing these patients (each with 5 response options, ranging from “very little” to “just right” to “excessive”). All of these questions were used previously in the 1-year Guided Care pilot study.5 Also, 10 validated questions from the Primary Care Assessment Tool (PCAT)21 inquired about physicians’ knowledge of their chronically ill older patients (6 aspects) and the practice’s care coordination activities (4 types). Each of these 10 questions offered 4 response options, ranging from “definitely not” to “definitely.” Table 1▶ lists the questions in the questionnaire. A survey of practice characteristics, which included questions about physician panel size, was completed by practice administrators.
Table 1.
Items and Scales Used by Physicians to Rate Chronic Care Processes
| Item and Scale | Factor Loading | Cronbach α |
|---|---|---|
| Physician satisfaction with aspects of chronic care | ||
| Regarding your chronically ill older patients, how satisfied are you with the following aspects of care that you and your staff provide (with 6 response options, ranging from “very dissatisfied” to “very satisfied”)? | ||
| Satisfaction with patient/family communication scale | ||
| Communicating with patients | 0.62 | 0.90 |
| Communicating with family caregivers | 0.84 | |
| Educating family caregivers | 0.84 | |
| Motivating patients to participate in maximizing their health | 0.61 | |
| Referrals to community resources | 0.64 | |
| Satisfaction with management of chronic care | ||
| Coordinating the care received from all providers | 0.77 | 0.93 |
| Monitoring patients’ chronic conditions | 0.82 | |
| Efficiency of office visits | 0.72 | |
| Access to evidence-based guidelines for chronic conditions | 0.59 | |
| Efficiency of practice team | 0.67 | |
| Availability of clinical information about your patients | 0.63 | |
| Time spent managing chronically ill patients | ||
| Regarding your chronically ill older patients, please rate the amount of time that you need to spend (with 5 response options, ranging from “very little” to “just right” to “excessive”). | ||
| Talking on the telephone with the patients | 0.75 | |
| Talking on the telephone with family caregivers | 0.84 | 0.73 |
| Communicating with physicians and other healthcare providers | 0.51 | |
| Knowledge of patients | ||
| Regarding your chronically ill older patients, please check the one best answer (with 4 response options, ranging from “definitely not” to “definitely”). | ||
| Knowledge of patients’ personal circumstances | ||
| Do you know who lives with each of your patients? | 0.79 | 0.58 |
| Would you know if patients had trouble getting or paying for a prescribed medication? | 0.52 | |
| Knowledge of patients’ clinical characteristics | ||
| Do you think you understand what problems are most important to the patients you see? | 0.82 | 0.82 |
| Do you think you know each patient’s complete medical history? | 0.67 | |
| Do you know all the medications that your patients are taking? | 0.77 | |
Item nonresponse (missing data) was less than 1% in all reports from the physicians who completed the questionnaire at baseline and 1 year later (after 6 months of experience with the Guided Care nurse). To maximize the data available for multivariate analyses, we used chained equations to impute values for these missing responses (MICE program in Stata 10.0),22 creating 5 imputed data sets and computing estimates and confidence intervals using Rubin’s combining rules.23 Each missing value was predicted as a function of the other variables in the same subset of questions, physician characteristics (age, sex, race, panel size, and percentage of panel aged 65 years and older), and practice characteristics (Guided Care vs control group, HMO-owned or not, and insurance coverage types of patients served).
To summarize information on similar items efficiently, we created scales using exploratory factor analysis (principal axis factoring with varimax rotation) to examine how we might consolidate the 11 satisfaction items, the 5 questions about the amount of time spent managing chronically ill older patients, and the 6 knowledge of patients items. The 4 care coordination items were not converted to a scale. Scree plots and factor loadings determined the number and configuration of the underlying factors in each scale: 2 scales for satisfaction, 1 for time spent, and 2 for knowledge (Table 1▶). The internal consistency for each scale was evaluated using Cronbach’s α, which ranged from 0.58 to 0.93.
Statistical Analysis
To compare the baseline characteristics of the Guided Care physicians and the control physicians, we computed Fisher’s exact tests for categorical variables and Wilcoxon rank-sum tests for continuous variables. To assess the effects of the intervention on satisfaction with chronic care processes, time spent, knowledge of patients scales (and on the 4 care coordination items), we constructed multiple linear regression models that regressed the values reported 1 year after baseline on the values reported at baseline, group assignment (Guided Care or usual care), and practice ownership (HMO or another organization). The small size of the physician sample limited our ability to account fully for clustering within practice types, so we entered the practice ownership variable into the models, rather than a practice-level variable or other method of accounting for clustering (such as robust clustering or GEE). We calculated the multivariate intraclass correlation for each of the models. Finally, we calculated effect sizes using Hedges’ d, which accounts for the multivariate context and corrects bias due to small sample size.24 All analyses were conducted using Stata statistical software, Version 10.0 (Stata Corp, College Station, Texas).
RESULTS
As shown in Figure 1▶, 91.8% of the participating physicians completed the baseline survey, and 84.4% of these also completed the 1-year follow-up survey. Overall, 11 of the 49 physicians did not complete both survey questionnaires. The respondents (n = 38) and nonrespondents (n = 11) did not differ significantly in group assignment, age, sex, or percentage of effort in patient care. In this study, all primary care physicians were board-certified family physicians (n = 2) or general internists (n = 47). None of the physicians self-identified as geriatricians.
Figure 1.

Participant flowchart.
Table 2▶ shows that the individual and practice characteristics of the Guided Care and usual care physicians who completed both survey questionnaires were similar at baseline. Comparing the characteristics of 38 physicians who completed the follow-up questionnaire with the 7 physicians who did not, there were no statistically significant differences between these 2 groups at baseline except that noncompleters agreed more strongly that help was available with making referrals (Table 3▶). Noncompletion of the follow-up questionnaires resulted from physicians leaving their practices (n = 2) or being too busy (n = 5).
Table 2.
Baseline Characteristics of Physicians Who Completed Both Surveys
| Characteristic | Usual Care (n=20) | Guided Care (n=18) | ρa |
|---|---|---|---|
| Physician characteristics | |||
| Age, mean years (SD) | 45.8 (8.2) | 45.9 (9.8) | 0.976 |
| Female, No. (%) | 5 (25) | 9 (50) | 0.179 |
| Race, No. (%) | 0.840 | ||
| White | 12 (60) | 12 (67) | |
| Black | 4 (20) | 2 (11) | |
| Asian | 4 (20) | 3 (17) | |
| Other | 0 (0) | 1 (6) | |
| Panel size, mean (SD), No. | 1,430 (440) | 1,584 (570) | 0.533 |
| Panel aged ≥65 y, mean (SD), No. | 23 (12) | 23 (11) | 0.784 |
| Practice characteristics | |||
| Insurance types accepted, No. (%) | 0.899 | ||
| Fee for service | 2 (10) | 2 (11) | |
| Mixed | 9 (45) | 7 (39) | |
| Health maintenance organization | 9 (45) | 9 (50) | |
| Ownership, No. (%) | 1.000 | ||
| Not-for-profit | 18 (90) | 16 (89) | |
| For-profit | 2 (10) | 2 (11) | |
| Location, No. (%) | 0.193 | ||
| Urban | 13 (65) | 7 (39) | |
| Suburban | 7 (35) | 11 (61) | |
| Age of practice, mean (SD), y | 20.3 (7.4) | 18.8 (7.9) | 0.731 |
| Annual patient visits, No. (%) | 0.963 | ||
| <40,000 | 9 (45) | 7 (39) | |
| 40,000–80,000 | 2 (10) | 2 (11) | |
| 80,000–120,000 | 6 (30) | 5 (28) | |
| ≥120,000 | 3 (15) | 4 (22) | |
| Full-time equivalent personnel in practice, No. (%) | 1.000 | ||
| <30 | 3 (15) | 3 (17) | |
| 30–40 | 9 (45) | 7 (39) | |
| 40–50 | 6 (30) | 6 (33) | |
| ≥50 | 2 (10) | 2 (11) | |
| Full-time physicians, mean (SD), No. | 9.8 (4.2) | 10.8 (3.9) | 0.507 |
| Registered nurse-to-physician ratio, mean (SD) | 0.6 (0.2) | 0.5 (0.3) | 0.079 |
| Nurse-to-physician ratio, mean (SD) | 0.8 (0.4) | 0.6 (0.4) | 0.090 |
| Physician assistant-to-physician ratio, mean (SD) | 0.1 (0.1) | 0.1 (0.1) | 0.346 |
| Administrative staff-to-physician ratio, mean (SD) | 1.5 (1.4) | 1.2 (1.2) | 0.792 |
| Use of electronic medical record, No. (%) | 18 (90) | 16 (89) | 0.656 |
| Use of patient registries, No. (%) | 11 (55) | 14 (78) | 0.128 |
| Use of reminders for patients, No. (%) | 20 (100) | 18 (100) | – |
| Use of reminders for physicians, No. (%) | 18 (90) | 16 (89) | 1.000 |
| Use of electronic communication among clinicians, No. (%) | 20 (100) | 18 (100) | – |
| Provision of readily available evidence-based guidelines, No. (%) | 18 (90) | 16 (89) | 1.000 |
| Encouragement of continuing medical education, No. (%) | 11 (55) | 11 (61) | 0.752 |
| Access to on-site social worker, No. (%) | 6 (30) | 4 (22) | 0.719 |
| Access to a case manager, No. (%) | 18 (90) | 16 (89) | 1.000 |
| Patient/caregiver support group, No. (%) | 7 (35) | 2 (11) | 0.130 |
| Financial performance, No. (%) | 1.000 | ||
| Profit/margin | 15 (75) | 13 (72) | |
| Balanced | 2 (10) | 2 (11) | |
| Deficit | 3 (15) | 3 (17) | |
| Proportion of capitated patients, No. (%) | 0.576 | ||
| <30% | 9 (45) | 9 (50) | |
| 30%–45% | 5 (25) | 2 (11) | |
| 100% | 6 (30) | 7 (39) | |
| Use of practice productivity incentives, No. (%) | 11 (55) | 9 (50) | 1.000 |
a Significance of Fisher’s exact test for categorical variables, Wilcoxon rank-sum test for continuous variables.
Table 3.
Characteristics of Physicians Who Did and Did Not Complete the Follow-Up Survey
| Characteristics | Completed Baseline Survey and 1-Year Follow-Up Survey (n=38) | Completed Baseline Survey Only (n=7) | ρa |
|---|---|---|---|
| Intervention arm, No. (%) | |||
| Guided Care group | 18 (47) | 5 (71) | 0.414 |
| Control group | 20 (53) | 2 (29) | |
| Physician characteristics | |||
| Age, mean (SD), y | 45.9 (8.9) | 45.4 (8.1) | 0.974 |
| Female, No. (%) | 14 (37) | 4 (57) | 0.412 |
| Race, No. (%) | |||
| White | 24 (63) | 2 (29) | 0.166 |
| Black | 6 (16) | 1 (14) | |
| Asian | 7 (18) | 4 (57) | |
| Other | 1 (3) | 0 (0) | |
| Panel size, mean (SD), No. | 1,505 (506) | 1,233 (231) | 0.163 |
| Percentage of panel 65 y and older, mean (SD), % | 23 (11) | 22 (8) | 0.748 |
| Outcomes, mean (SD) | |||
| Satisfaction with patient/family communication | 4.15 (0.73) | 3.97 (1.38) | 0.813 |
| Satisfaction with management of chronic care | 4.37 (0.81) | 3.79 (1.45) | 0.346 |
| Time spent managing chronically ill patients | 3.89 (0.93) | 3.67 (0.86) | 0.435 |
| Personal knowledge of patients | 2.64 (0.63) | 2.50 (0.45) | 0.413 |
| Clinical knowledge of patients | 2.77 (0.61) | 2.89 (0.72) | 0.861 |
| Knowledge about all the special visits | 2.76 (0.75) | 2.43 (0.53) | 0.246 |
| Helped appointment for referral visit | 2.24 (1.05) | 3.14 (0.69) | 0.031b |
| Written information to patients’ specialists | 3.34 (0.99) | 3.42 (0.79) | 0.957 |
| Useful information received from specialists | 3.37 (0.67) | 3.29 (0.49) | 0.557 |
aSignificance of Fisher’s exact test for categorical variables, Wilcoxon rank-sum test for continuous variables.
bρ >0.05.
Table 4▶ compares the Guided Care and usual care groups’ mean scores at baseline and 1 year later (after 6 months with the Guided Care nurse’s assistance) on the 5 scales (satisfaction with communication, satisfaction with care management, time spent on chronic care, knowledge of patients’ personal circumstances, and knowledge of patients’ clinical characteristics) and the 4 individual coordination of care items. Each ρ value indicates the statistical significance of the regression coefficient for assignment to the Guided Care group in a multiple linear regression model of a scale or item score at 1 year, adjusting for the physician’s baseline score on that scale or item and the ownership of the physician’s practice (HMO or other).
Table 4.
Physicians’ Average Ratings of Chronic Care Processes at Baseline and 1 Year Later
|
Usual Care Group |
Guided Care Group |
||||
|---|---|---|---|---|---|
| Variable | Baseline Mean (CI) | 1 Year Mean (CI) | Baseline Mean (CI) | 1 Year Mean (CI) | ρa |
| Satisfaction with patient/family communication | 4.25 (3.86–4.64) | 3.94 (3.58–4.30) | 4.03 (3.72–4.34) | 4.40 (3.99–4.81) | 0.014 |
| Satisfaction with management of chronic care | 4.29 (3.86–4.72) | 4.08 (3.70–4.45) | 4.46 (4.11–4.81) | 4.42 (3.99–4.85) | 0.285 |
| Time spent managing chronically ill patients | 3.93 (3.55–4.31) | 2.85 (2.49–3.21) | 3.85 (3.31–4.39) | 2.94 (2.58–3.31) | 0.601 |
| Knowledge of patients’ personal circumstances | 2.60 (2.29 2.92) | 2.67 (2.44–2.90) | 2.72 (2.39–3.06) | 2.78 (2.49–3.07) | 0.727 |
| Knowledge of patients’ clinical characteristics | 2.70 (2.38–3.02) | 2.77 (2.50–3.03) | 2.85 (2.59–3.11) | 3.17 (2.88–3.46) | 0.042 |
| Physician knows about all specialist visits | 2.65 (2.24–3.06) | 2.65 (2.21–3.09) | 2.89 (2.60–3.18) | 2.89 (2.44–3.34) | 0.732 |
| Someone in office helps patient make appointment for referral visit | 2.25 (1.70–2.80) | 1.89 (1.3–2.45) | 2.22 (1.75–2.70) | 2.43 (1.90–2.96) | 0.079 |
| Written information is sent to patients’ specialists | 3.55 (3.23–3.87) | 3.00 (2.40–3.61) | 3.11 (2.49–.73) | 3.33 (2.85–3.82) | 0.148 |
| Useful information is received from specialists | 3.35 (3.00–3.70) | 3.20 (2.87–3.53) | 3.39 (3.08–3.69) | 3.50 (3.19–3.81) | 0.182 |
aSignificance of regression coefficient for Guided Care in linear regression models of 1-year scores, adjusting for baseline scores and practice ownership.
After 1 year, Guided Care had positive effects on physicians’ satisfaction with patient/family communication (ρ = 0.014) and on physicians’ knowledge of their patients’ clinical characteristics (ρ = 0.042). Guided Care physicians also tended to report stronger beliefs that someone in their offices helped patients make appointments for referral visits (ρ = 0.079), although the effect did not reach traditional significance levels. There were no statistically significant differences between the intervention and control groups in the other variables at 1-year follow-up. The multivariate intraclass correlation for each of the models ranged from 0.064 to 0.372 (data not shown).
Table 5▶ displays the regression coefficients and the effect sizes that are associated with Guided Care in these regression models. The effects of Guided Care on the physician satisfaction with patient/family communication scale (d = 0.87) and on the physician knowledge of patients’ clinical characteristics scale (d = 0.71) are fairly large. Cohen describes effect sizes of 0.2 as “small” and 0.8 as “grossly perceptible and therefore large.”26 Although these data do not describe clinical effects on patients, they do indicate substantial increases in physicians’ assessments of these aspects of their care of chronically ill older patients.
Table 5.
Effect of Guided Care on Physicians’ Ratings of Chronic Care Processes: Regression Coefficients and Effect Sizes in Linear Regression Models
| Variable | ICCa | Coefficientb (95% CI) | Effect Sizec (95% CI) |
|---|---|---|---|
| Satisfaction with patient/family communication | 0.06 | 0.59 (0.13 to 1.06)d | 0.87 (0.21 to 1.54) |
| Satisfaction with management of chronic care | 0.25 | 0.23 (−0.20 to 0.66) | 0.37 (−0.28 to 1.01) |
| Time spent managing chronically ill patients | – | 0.12 (−0.35 to 0.60) | 0.18 (−0.46 to 0.82) |
| Knowledge of patients’ personal circumstances | – | 0.05 (−0.22 to 0.31) | 0.12 (−0.52 to 0.76) |
| Knowledge of patients clinical characteristics | 0.33 | 0.32 (0.01 to 0.63)* | 0.71 (0.05 to 1.37) |
| Knowledge about all the special visits | 0.37 | 0.07 (−0.37 to 0.52) | 0.12 (−0.52 to 0.76) |
| Helped appointment for referral visit | – | 0.57 (−0.07 to 1.20) | 0.61 (−0.04 to 1.26) |
| Written information to patients’ specialists | 0.14 | 0.54 (−0.20 to 1.29) | 0.50 (−0.15 to 1.15) |
| Useful information received from specialists | 0.20 | 0.27 (−0.13 to 0.68) | 0.46 (−0.19 to 1.10) |
CI=confidence interval, ICC = intraclass correlation.
aICCs are not shown if the variance within sites is larger than the variance between sites and the values of ICC become artificially low or negative.25
bRegression coefficient of Guided Care in linear regression models of 1-year scores, adjusting for baseline scores and practice ownership.
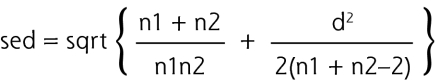
cCalculated using Hedges’ d as follows:
 .
where n1 and n2 are sample sizes of 2 comparison groups, and
.
where n1 and n2 are sample sizes of 2 comparison groups, and
 where n1 and n2 are the numbers of sample size in 2 groups and df is the degrees of freedom used for a corresponding t value in a linear model.
95% CI = ES− 1:96se to ES+1:96se; where ES stands for effect size and se is the asymptotic standard error for the effect size:
where n1 and n2 are the numbers of sample size in 2 groups and df is the degrees of freedom used for a corresponding t value in a linear model.
95% CI = ES− 1:96se to ES+1:96se; where ES stands for effect size and se is the asymptotic standard error for the effect size:
d ρ <0.05.
DISCUSSION
This study examined effects of Guided Care on physicians’ experiences, particularly primary care physicians’ satisfaction with specific processes of caring for their chronically ill older patients. We anticipated that overall physician satisfaction with chronic care was too distal an outcome to have changed by the 1-year follow-up survey (only 6 months after Guided Care nurses completed building their caseloads), especially given the small number of Guided Care patients per panel. We believed that focusing on specific processes of chronic care was more appropriate and more likely to detect early effects. (As mentioned above, the important experiences of nurses and patients are considered in other articles.) Consistent with our hypotheses, Guided Care physicians were significantly more satisfied than their usual care peers with their communications with their chronically ill older patients and their families, and they reported significantly better knowledge of their patients’ clinical characteristics. These findings are plausible, considering the Guided Care nurses’ clinical activities that align with the items these scales comprise: communication, education, motivation, and referral to agencies, as well as discussing patients’ histories, medications, and problems with their primary care physicians. These significant effects were observed despite 2 factors that biased the study against finding statistically significant differences between the 2 groups. First, the survey questionnaire asked physicians about their care of all their chronically ill older patients, although the Guided Care nurse worked with an average of only 16 patients in each physician’s panel at any given time. In addition, the Guided Care nurses had only been working with full caseloads in these practices for about 6 months at the time of this follow-up survey.
Contrary to our hypotheses, we detected no statistically significant effects of Guided Care on physicians’ satisfaction with management of chronic care, knowledge of patients’ personal circumstances, or on their ratings of the practice’s care coordination activities. These findings also seem plausible. Although the Guided Care nurses managed aspects of their patients’ care, amassed great knowledge of their patients’ personal circumstances, and coordinated their care, we do not have concrete information regarding how often or consistently information about these specific activities were communicated to their physician-partners. Although the Guided Care nurse learns more about the patient than the physician might otherwise know, how much of that additional information is shared with the physician depends on the teamwork between the nurse and physician and the number and efficiency of their meetings or other communications (such as e-mails and in-person discussions); these specifics could not feasibly be measured. The physicians, however, would never have less information under Guided Care than under usual care, because they maintain regular appointments with the patients. Finally, the limited sample size and the short time frame may have impeded our ability to detect weaker effects of Guided Care.
We were unsure, a priori, about the effects of Guided Care on physician time spent managing their chronically ill older patients. No significant differences were noted.
Limitations
Interpretation of the findings reported here is subject to several limitations. The physicians were not blinded to their group assignment, which could have biased their responses in either direction. The sample of participating physicians was small, having been determined, not by the power needed for physician-level analyses, but by the power needed for patient-level analyses. This relatively small sample size constrained the robustness of our factor analysis, limited the use of our constructed scales by others, limited our ability to control completely for the clustering of physicians within practices, and weakened our power to detect modest differences with statistical significance. The scales identified in factor analysis should be retested in larger studies.
Nonresponse does not appear to have biased the results reported here. Although 7 physicians who provided baseline information did not complete the follow-up survey, comparison of the baseline data from those who completed the follow-up survey with those who did not indicated that there were no statistically significant differences between these 2 groups at baseline except that noncompleters agreed more strongly that help was available with making referrals.
Within the context of concerns regarding declines in primary care physicians and rising numbers of older adults, identifying new models for providing high-quality, patient-centered care to vulnerable patients is more important than ever. Guided Care is one model that addresses chronically ill older adults’ needs and improves physicians’ satisfaction with some processes of care and knowledge of their patients, effects that could ultimately help stem the recent declines in physicians’ interest in choosing and practicing primary care.27
Acknowledgments
We acknowledge the invaluable contributions made by the Johns Hopkins Community Physicians, Medstar Physician Partners, and all the participating patients, caregivers, chronic disease self-management leaders, physicians, and Guided Care nurses.
Funding support: This work was funded by the John A. Hartford Foundation and the Roger C. Lipitz Center for Integrated Health Care of the Johns Hopkins Bloomberg School of Public Health. The main study, of which this is a part, was also supported by the Agency for Healthcare Research and Quality, the National Institute on Aging, the Jacob and Valeria Langeloth Foundation, Kaiser-Permanente Mid-Atlantic, and Johns Hopkins Health Care.
Conflicts of interest: none reported
REFERENCES
- 1.Anderson G, Knickman J. Changing the chronic care system to meet people’s needs. Health Aff (Millwood). 2001;20(6):146–160. [DOI] [PubMed] [Google Scholar]
- 2.Darer JD, Hwang W, Pham HH, Bass EB, Anderson G. More training needed in chronic care: a survey of US physicians. Acad Med. 2004;79(6):541–548. [DOI] [PubMed] [Google Scholar]
- 3.Boult C, Christmas C, Durso SC, Leff B, Boult LB, Fried LP. Perspective: transforming chronic care for older persons. Acad Med. 2008;83(7):627–631. [DOI] [PubMed] [Google Scholar]
- 4.Agency for Healthcare Research and Quality (AHRQ). Cliinical performance measures for ambulatory care. http://www.ahrq.gov/qual/aqastart.htm. Accessed Jan 13, 2009.
- 5.Boyd CM, Boult CE, Shadmi E, et al. Guided care for multimorbid older adults. Gerontologist. 2007;47(5):697–704. [DOI] [PubMed] [Google Scholar]
- 6.Boult C, Reider L, Frey K, et al. Early effects of “Guided Care” on the quality of health care for multimorbid older persons: a cluster-randomized controlled trial. J Gerontol A Biol Sci Med Sci. 2008;63(3):321–327. [DOI] [PubMed] [Google Scholar]
- 7.Leff B, Reider L, Frick KD, et al. Guided care and the cost of complex healthcare: a preliminary report. Am J Manag Care. 2009; 15(8):555–559. [PubMed] [Google Scholar]
- 8.Hall JA, Roter DL, Milburn MA, Daltroy LH. Patients’ health as a predictor of physician and patient behavior in medical visits. A synthesis of four studies. Med Care. 1996;34(12):1205–1218. [DOI] [PubMed] [Google Scholar]
- 9.Hall JA, Epstein AM, DeCiantis ML, McNeil BJ. Physicians’ liking for their patients: more evidence for the role of affect in medical care. Health Psychol. 1993;12(2):140–146. [DOI] [PubMed] [Google Scholar]
- 10.Hall JA, Horgan TG, Stein TS, Roter DL. Liking in the physician—patient relationship. Patient Educ Couns. 2002;48(1):69–77. [DOI] [PubMed] [Google Scholar]
- 11.Like R, Zyzanski SJ. Patient satisfaction with the clinical encounter: social psychological determinants. Soc Sci Med. 1987;24(4):351–357. [DOI] [PubMed] [Google Scholar]
- 12.Adelman RD, Greene MG, Charon R. Issues in physician-elderly patient interaction. Ageing Soc. 1991;11(2):127–148. [Google Scholar]
- 13.Greene MG, Adelman RD, Charon R, Friedmann E. Concordance between physicians and their older and younger patients in the primary care medical encounter. Gerontologist. 1989;29(6):808–813. [DOI] [PubMed] [Google Scholar]
- 14.Marvel MK, Epstein RM, Flowers K, Beckman HB. Soliciting the patient’s agenda: have we improved? JAMA. 1999;281(3):283–287. [DOI] [PubMed] [Google Scholar]
- 15.Braddock CH III, Edwards KA, Hasenberg NM, Laidley TL, Levinson W. Informed decision making in outpatient practice: time to get back to basics. JAMA. 1999;282(24):2313–2320. [DOI] [PubMed] [Google Scholar]
- 16.Griffin SJ, Kinmonth AL, Veltman MW, Gillard S, Grant J, Stewart M. Effect on health-related outcomes of interventions to alter the interaction between patients and practitioners: a systematic review of trials. Ann Fam Med. 2004;2(6):595–608. [DOI] [PMC free article] [PubMed] [Google Scholar]
- 17.Roter D, Hall J. Doctors Talking With Patients/Patients Talking with Doctors: Improving Communication in Medical Visits. 2nd ed. West-port, CT: Praeger Paperback; 2006:143–164.
- 18.Stewart MA. Effective physician-patient communication and health outcomes: a review. CMAJ. 1995;152(9):1423–1433. [PMC free article] [PubMed] [Google Scholar]
- 19.Boyd CM, Reider L, Frey K, et al. The effects of guided care on the perceived quality of health care for multi-morbid older persons: 18 month outcomes from a cluster-randomized controlled trial. J Gen Intern Med.2010;25(3):235–242. [DOI] [PMC free article] [PubMed] [Google Scholar]
- 20.Wolff JL, Giovannetti ER, Boyd CM, et al. Effects of guided care on family caregivers. Gerontologist. 2009; Aug 26. [DOI] [PMC free article] [PubMed]
- 21.Shi L, Starfield B, Xu J. Validating the Adult Primary Care Assessment Tool. J Fam Pract. 2001;50(2):161W–175W. [Google Scholar]
- 22.Royston P. Multiple imputation of missing values: update. Stata. 2005;5(2):1–14. [Google Scholar]
- 23.Rubin DB. Multiple Imputation for Nonresponse in Surveys. New York, NY: J. Wiley & Sons; 1987.
- 24.Nakagawa S, Cuthill IC. Effect size, confidence interval and statistical significance: a practical guide for biologists. Biol Rev Camb Philos Soc. 2007;82(4):591–605. [DOI] [PubMed] [Google Scholar]
- 25.Lahey MA, Downey RG, Saal FE. Intraclass correlations: there’s more there than meets the eye. Psychol Bull. 1983;93(3):586–595. [Google Scholar]
- 26.Cohen J. Statistical Power Analysis for the Behavioral Sciences. 2nd ed. Hillsdale NJ: Lawrence Earlbaum Associates; 1988.
- 27.Landon BE, Reschovsky JD, Pham HH, Blumenthal D. Leaving medicine: the consequences of physician dissatisfaction. Med Care. 2006;44(3):234–242. [DOI] [PubMed] [Google Scholar]