

Abstract
The perforant path (PP) undergoes synaptic changes in the course of aging and dementia. Previous studies attempting to assess the integrity of the PP in humans using diffusion tensor imaging (DTI) were limited by low resolution and the inability to identify PP fibers specifically. Here we present an application of DTI at ultrahigh submillimeter resolution that has allowed us to successfully identify diffusion signals unique to the PP and compare the intensity of these signals in a sample of young adults and older adults. We report direct evidence of age-related PP degradation in humans in vivo. We find no evidence of such loss in a control pathway, the alveus, suggesting that these findings are not evidence for a global decline. We also find no evidence for specific entorhinal gray matter atrophy. The extent of PP degradation correlated with performance on a word-list learning task sensitive to hippocampal deficits. We also show evidence for gray matter diffusion signals consistent with pyramidal dendrite orientation in the hippocampus and cerebral cortex. Ultrahigh-resolution microstructural DTI is a unique biomarker that can be used in combination with traditional structural and functional neuroimaging methods to enhance detection of Alzheimer disease in its earliest stages, test the effectiveness of new therapies, and monitor disease progression.
Keywords: aging, hippocampus, DTI, entorhinal, dentate
There is converging evidence that one of the earliest locations in the brain to undergo age-related change is the medial temporal lobe (MTL) region (1, 2), which plays an important role in learning new facts and remembering events (3, 4). Selective structural and functional changes in the MTL are evident with aging and specifically target white matter connectivity and cellular function (1). One MTL pathway that is particularly vulnerable to age-related changes is the perforant path (PP) (5–7). This pathway perforates the subiculum carrying input from the entorhinal cortex to the hippocampal formation (Fig. 1 A and B). The integrity of this pathway is essential for normal hippocampal function (8). Studies in rodents have shown that the PP input to the hippocampus is reduced by approximately one third in aged rats compared with young rats (9, 10) and that stimulation of the PP in aged rats results in less excitation than in young rats (1). Histological studies have observed reduced myelin staining in the PP in Alzheimer disease (AD) (8), and more recently, synaptic loss in this region in individuals with mild cognitive impairment (11). Thus, numerous studies have suggested that the PP undergoes changes with aging and in the course of dementia. However, observing evidence of this degradation in humans in vivo, a key requirement of any viable biomarker, has remained elusive.
Fig. 1.

(A) Circuit figure of hippocampal connectivity showing the PP. EC2, entorhinal cortex layer II; EC3, entorhinal cortex layer III; EC deep, entorhinal cortex deep layers; DG, dentate gyrus; Sub, subiculum. The broken red line emphasizes that this pathway is degraded with aging. (B) A retrograde tracer diagram of the PP [Reproduced with permission from ref. 6 (Copyright John Wiley and Sons, 1991)]. (C) Schematized illustration of PP connectivity in the hippocampus [Adapted with permission from ref. 8 (Copyright 1986, John Wiley and Sons)]. (D) Single hippocampal DTI slice clearly showing the tensor orientation of the PP fibers (the slice used here for tensor visualization is approximately twice as thick as the slices used in the main quantification analyses). (Inset) Structural MRI scan showing the position of this slice and the magnified location. The tensor map is overlaid on an FA map that is modulated by the grayscale anatomical image.
Diffusion tensor imaging (DTI) is used to investigate the microstructural features of white matter (12), and has recently been applied to the study of aging and dementia (13). DTI is based on the principle that water will diffuse more readily along the principal axis of an axon than perpendicular to it. This anisotropy of diffusion is increased in regions of high axonal integrity, robust myelination, and tight packing and decreased in areas where white matter is not as organized (14, 15). Few studies to date have attempted to investigate the PP in humans in vivo using DTI in patients with mild cognitive impairment (MCI) or AD. Two studies reported changes in the PP region in patients with MCI. One study reported reduced intervoxel coherence (i.e., the degree of similarity of adjacent voxel orientation) (16), whereas another reported an increase in mean diffusivity (a measure of isotropic diffusion, which increases with tissue degradation) (17). Decreased fractional anisotropy (FA; a measure of the anisotropy of diffusion) in parahippocampal white matter has also been shown in studies of patients with AD (18). Across studies, quantification of small deviations in the direction of the diffusion signal at the resolution used was not possible. Further, as the parahippocampal region assessed also contains many other fibers (e.g., the angular bundle), it was difficult to assess whether any of these changes could be ascribed to the PP per se. To do so, one would need sufficiently high (i.e., submillimeter) resolution to assess the PP's integrity. However, increasing the resolution also decreases signal-to-noise ratio (SNR) dramatically.
Recently, advances in neuroimaging technology have been able to overcome this hurdle by using parallel imaging techniques, such as sensitivity encoding (SENSE) (19–21), which significantly reduce acquisition time. For example, Jaermann and colleagues used high-resolution DTI to reveal terminal afferents in cortical gray matter (21), which cannot be achieved using conventional DTI resolutions. Others have also shown that high-resolution DTI in the rodent can reveal microstructural details in hippocampal gray matter based on anisotropy (22–24). However, no study to date has attempted to quantify specific pathways using high-resolution DTI in humans in vivo.
In the current work, we introduce an ultrahigh-resolution (664 μm × 664 μm in-plane) microstructural DTI (msDTI) protocol and analytic technique that is capable of picking up subtle intracortical diffusion signatures such as that of the PP. We further use this method to detect reductions in the PP's integrity with aging.
Results
We were able to visualize the PP using our submillimeter DTI protocol. The PP's diffusion signature was consistent with that identified by tracing studies in the primate (Fig. 1B) and anatomical atlases. Moreover, we observed a readily identifiable diffusion profile consistent with a white matter band penetrating the angular bundle, connecting the subiculum to the entorhinal cortex (Fig. 1D). Although observing the PP alone is a necessary precondition, it is not sufficient for its use as a biomarker. In addition, we must be able to quantify its integrity.
We quantified the integrity of the PP using a simple metric (Eq. 1; Materials and Methods) that calculated the amount of diffusion in the canonical direction of the PP as it originates from the entorhinal cortex (Fig. 1 B and C) (5–7). This was perpendicular to the entorhinal cortical sheet, which is decidedly flat in this region. We used this metric to create a simple one-dimensional plot of the pathway spanning the length of the entorhinal cortical sheet (Fig. 2). This was done to capture the PP from its most medial aspect to its most lateral. We also used the same metric to construct 2D plots for visualization of the entire volume of the PP in the same location (Fig. 2D). On these plots, the PP appeared as a “hot spot” that is several pixels wide. Each pixel was color-coded for the amount of diffusion along the direction specified in each individual based on the visualized anatomy in each slice. This signature was consistently identifiable across slices and across all participants.
Fig. 2.

Sample measurements from two young (s1, s2) and two old (s3, s4) subjects (two from each hemisphere). (A) Coronal slice anatomical location where the measurement was conducted. Red boxes indicate the approximate location of the zoomed-in view in B. This view is a close-up of the anatomy with the blue dots defining a line parallel to the entorhinal cortex sheet (green dots are 1 voxel in each direction) and the red line is the direction perpendicular to it (the actual PP direction). The hippocampus (HIPP) and the entorhinal cortex (EC) are labeled on each slice. (C) One-dimensional plots of the PPproj value clearly show a peak consistent with the position of the PP. (D) The 2D plots of the PPproj value in the entire volume shown in B are color-coded so “hot” colors (red/yellow) are greater PPproj values (i.e., larger diffusion signal along the PP direction) and “cold” colors (blue/purple) are lower PPproj values (i.e., smaller diffusion signal along the PP direction). The hot spots in the middle of each spot represent the PP on that particular slice.
When we compared the average plots of the PP in young and old participants to determine whether aging affected our metric of PP integrity, we found a significant group difference in the area under the curve (AUC) consistent with such a reduction (t = 2.53, P = 0.01; Fig. 3A). To determine if this change was specific to the PP or evidence for more global changes with aging, we selected an a priori control region. The alvear pathway (a.k.a. the alveus) is a thin white matter band that extends into the fimbria/fornix output pathway. In the posterior portion of the hippocampus, this pathway consists principally of fibers that connect layer III entorhinal neurons directly to CA1 (25). This temporoalvear pathway, to the best of our knowledge, is not thought to undergo many changes with aging and thus could serve as a control pathway (2). Similar group comparisons (Fig. 3B) found no significant difference with age in AUC (t = 0.83, P = 0.49). This suggests that the PP aging effect is likely not driven by global changes in our metric or even changes in our metric tied to overall age-related hippocampal connectivity effects, but is specific to the PP itself. We also did not observe group differences in entorhinal cortical volume (t = 0.8197, P = 0.42; Fig. S1).
Fig. 3.

(A) Average PP signal curves from young and old subjects show a significant group difference between young and old subjects in AUC. (B) Average alveus signal curves from young and old subjects show no significant difference between groups in AUC.
To better understand the functional implications of PP degradation in older adults, we investigated the relationship between PP diffusion signals and performance on a test of hippocampus-dependent memory function. The Rey Auditory Verbal Learning Test (RAVLT) (26) is a test of word-list learning frequently used to assess memory function. Specifically, delayed free recall performance can be used to assess hippocampal function (27). We found a significant correlation between performance on the RAVLT delayed recall scores and PP AUC in older adults (R2 = 0.28, P = 0.01, Fig. 4). The same relationship was not found in young adults, and no relationships with any other neuropsychological measures were found in either group.
Fig. 4.

Significant correlation between PP AUC and delayed recall performance on the RAVLT in older adults.
Discussion
In this study, we introduced an optimized high-resolution DTI acquisition method and analytical technique that is capable of detecting diffusion signals from the PP and is sensitive to age-related changes in this region. We showed that the PP signal could be quantified by using prior knowledge of its orientation. We tested the validity of this approach in young and older adults, and found that the PP diffusion signal was significantly reduced with age. We also ascertained the specificity of this effect by testing the alveus as a control region. Past research suggests the alveus is not impaired in the course of aging [although there is evidence that it deteriorates in AD (28)]. In this region, we could not detect any significant group differences. We also did not detect any volumetric differences in the entorhinal cortex across groups, suggesting that this change in pathway integrity is not a direct consequence of primary changes in the entorhinal cortex (Fig. S1). Our findings are consistent with a large body of literature suggesting structural and functional changes in the PP with aging (1, 8–11).
We found that the extent of PP degradation in older adults predicted their performance on a test of hippocampus-dependent memory function, the RAVLT. In particular, it predicted their performance on the delayed recall portion of the test, which is the portion most sensitive to hippocampal deficits (27) (Fig. 4). This relationship suggests that our measures of the PP are a valid indicator of circuitry integrity in the hippocampus and are capturing real pathological changes that affect performance and that msDTI can potentially be used as a biomarker to isolate early preclinical dysfunction that may predict memory performance.
One important caveat is that we cannot directly infer the exact nature of the structural changes that lead to a reduced diffusion signal from diffusion imaging. Although it is well established that diffusion signals are sensitive to white matter integrity, the extent to which changes such as degeneration, gliosis, and demyelination contribute to DTI signal changes is unclear. It is likely that signal changes are the result of some combination of these; however, at this time, evidence for this is currently lacking. One important future direction is the rigorous comparison of these methods with rodent microimaging and postmortem investigations using histological techniques (e.g., neuron counts, myelin staining, synaptophysin immunoreactivity, intracellular and extracellular in vitro recordings) to better understand the microstructural features that lead to deviations in diffusion signals. It is also important to note that we make the explicit assumption, based on the neuroanatomical tracing studies, that the PP at the plane of assessment is a linear projection and that this does not change with age. For instance, if the PP were to become more convoluted with age, our quantification method would overestimate age-related reductions.
We used readily available acquisition parameters and a simple analytic technique to illustrate that high-resolution DTI in humans is feasible and provides important and valid structural information. It is important to note, however, that several methodological advances are possible. First, our DTI technique could only resolve a single fiber orientation per voxel as a result of limitations of the tensor model. Acquisition sequences, such as Q-ball imaging (29), that allow for resolving multiple orientations per voxel can accommodate fiber crossing, bending, and twisting within voxels. Additionally, the use of probabilistic tractography techniques such as bedpostX (part of the FSL software suite) (30) may also afford us the ability to model crossing fibers. In the current study, we chose not to perform tractography analyses, as they involve a separate procedure that is independent of tensor solving and involves an additional set of assumptions (e.g., minimum anisotropy and maximum turn angle). Also, PP tractography would have been especially difficult given the low SNR in high-resolution scans and the relatively small number of voxels that would contribute to its signal.
It is important to note that the analysis conducted would not have been possible without the use of directionally unique information. In other words, if we had simply used FA or any other directionless scalar value, as is typical in DTI studies, we would not be able to isolate the diffusion signature of the PP, as many other fiber bundles could contribute to this signal in the same region. In this study, we were sensitive to the PP's diffusion signal in the white matter before it perforates the subiculum because its signal was directionally unique and thus could be teased apart easily using tensor mathematics. This approach was not possible in the subiculum itself, however, because the PP's signal is along the same direction as the principal orientation of pyramidal dendrites and our images readily pick up gray matter anisotropy as well (Fig. S2). Because the signal inside the subiculum is not uniquely associated with the PP, we chose not to use it for quantification and group comparison, although it is worth noting that the PP itself remained visible inside the subiculum in most if not all participants.
The methods used in this study can also be extended to study the detailed microstructure of hippocampal gray matter. Although we see evidence for gray matter diffusion signals in the hippocampus and cortical sheet that is consistent with the orientation of pyramidal cell projections (Fig. S2), we did not quantify these signals in the current investigation. There is some evidence from rodent DTI studies that the best correlate of gray matter FA in the hippocampus is dendritic density (24). Others have also shown that DTI can be used to investigate gray matter architecture by modeling the isotropic and anisotropic components of the diffusion tensor separately (31). Our methods extend these investigations into the human and will hopefully translate into a powerful tool to further query gray matter microstructure.
An important potential application of the proposed technique is as an outcome measure for clinical or therapeutic trials, as well as a tool to gain a better understanding of mechanisms for brain plasticity. White matter connectivity is dynamic, as elegantly demonstrated by a recent study that observed training-induced white matter changes in FA (32). Using high-resolution DTI, we can perhaps conduct these investigations at the level of specific pathways and gain a better understanding of the plasticity-related changes.
In summary, we propose a msDTI method for investigating the PP in humans in vivo. We were able to provide direct evidence of reduced PP integrity in aged humans. Further, we showed that the PP changes detected were not secondary to global white matter changes, but rather indicate specific degradation in this region. The extent of PP degradation also predicted performance on a neuropsychological test of hippocampal function, suggesting that PP integrity is critical for intact hippocampal memory, consistent with previous work in the rodent. Further work will be needed to assess the relationship of this biomarker to other neuroimaging standards, such as structural MRI volumes and functional MRI activity. We hope that this tool can be used more generally to investigate thin white matter fibers or intracortical fibers, the study of which has been quite elusive in the past. The ability to conduct such fine-level structural investigations in humans in vivo should contribute to rapid progress in the neuroimaging of aging, dementia, and neurological disorders, as well as testing the efficacy of therapies and treatments.
Materials and Methods
Participants.
Seventeen right-handed healthy young adults (six female; mean age, 21 y; SD, 3 y) and 19 right-handed healthy older adults (eight female; mean age, 70 y; SD, 6 y) participated in the study. Table 1 shows detailed demographic and neuropsychological test data for the study subjects. All participants underwent DTI scanning in this study. Written informed consent was obtained from all participants. They were screened for any health conditions that may interact with their neurological status, as well as contraindications for MRI scanning. Young adults were recruited from the University of California, Irvine, undergraduate student population. Older subjects were recruited by word-of-mouth and direct referral from a longitudinal study of “successful aging” at our local AD research center. Exclusion criteria included any major medical conditions (e.g., diabetes, heart disease), any neurologically active medication use, any history of mental or psychiatric disorder, as well as any MRI contraindications including any metal in the body and claustrophobia. All participants scored in the normal range on the Mini-Mental State Examination (33). Participants were administered a large neuropsychological test battery (Table 1 and SI Materials and Methods), and all performed within age-matched norms.
Table 1.
Demographic and neuropsychological variables
| Variable | Young adults | Older adults |
| No. of patients | 17 | 19 |
| Sex, M:F | 6:11 | 8:11 |
| Age (y) | 21 ± 3 | 70 ± 6 |
| Years of education | 15 ± 3 | 17 ± 2 |
| MMSE | 29 ± 1 | 29 ± 1 |
| RAVLT 5-trial total | 58 ± 6 | 54 ± 9 |
| RAVLT immediate recall | 12 ± 3 | 12 ± 2 |
| RAVLT delayed recall | 12 ± 3 | 11 ± 3 |
| Digit span | 20 ± 4 | 19 ± 5 |
| WAIS full-scale IQ | 109 ± 6 | 121 ± 6 |
| Trails A | 20 ± 9 | 27 ± 8 |
| Trails B | 52 ± 24 | 60 ± 14 |
| Verbal fluency | 43 ± 12 | 50 ± 11 |
| Category fluency | 25 ± 5 | 21 ± 4 |
| Letter-number sequencing | 13 ± 2 | 11 ± 2 |
Scores are shown as mean ± SD. MMSE, Mini-Mental State Examination; WAIS, Wechsler Adult Intelligence Scale (see SI Materials and Methods for details on individuals tests and cutoff scores). All scores were within age-matched norms.
Image Acquisition.
Diffusion-weighted scans were acquired on a 3.0-T Intera system (Philips Medical Systems). We used a parallel imaging technique using SENSE (19), and an eight-channel head coil to acquire 15-slice coronal single shot echoplanar imaging scans with a 256 × 256 matrix, a field of view of 170, voxel size of 0.664 mm × 0.664 mm in the plane of acquisition, a slice thickness of 3 mm (1 mm gap), a repetition time of 2,717 ms and an echo time of 67 ms, a flip angle of 90°, and a SENSE reduction factor of 2.5. Diffusion weighting was applied with a b value of 1,200 s/mm2 along 32 independent, noncollinear orientations. One additional image with no diffusion weighting (b = 0) was also acquired. We collected 12 runs of 4.5 min and coregistered them to enhance SNR. In addition to the diffusion-weighted scans, we also collected an ultrahigh-resolution fast spin-echo scan centered on the MTL with identical geometry and resolution (field of view, 230; repetition time/echo time, 3,000/80 ms; flip angle, 90°). These scans were used because they provide detailed anatomical information inside hippocampal subfields.
Data Processing and Analysis.
Diffusion-weighted images were corrected for head motion and eddy current distortions using FMRIB Diffusion Toolbox version 2.0 (34). Motion and distortion-corrected volumes were merged into a single volume, and tensor solving was accomplished by calculating the six elements at each pixel using multivariate linear fitting. After diagonalization, three eigenvalues and three eigenvectors were obtained. The eigenvector associated with the largest eigenvalue (i.e., principal eigenvector) was assumed to represent the average fiber orientation of the pixel leading then to the resultant FA maps (15, 35). The resulting images included the three eigenvectors (V1, V2, V3) and eigenvalues (L1, L2, L3), as well as FA maps, mean diffusivity maps, and an average no-diffusion map (average of the b0 images).
PP Visualization and Quantification.
We designed a toolbox in the MATLAB (version R2009a) programming environment (Mathworks) for the purpose of visualizing and quantifying the PP. First, the predicted location of the PP was identified on the high-resolution T2-weighted structural scans using the boundary between gray matter and white matter in the entorhinal cortex as a guide. It is important to note that the PP is a small white matter fiber pathway that is buried inside other white matter, rendering it invisible on structural MRI scans, even at this resolution. For each participant, we used the toolbox to simultaneously load and display the high-resolution T2-weighted scan, the eigenvectors/eigenvalues that contain tensor information, as well as the FA map.
We selected three slices in each hemisphere in the anterior portion of the hippocampus where the PP was assessed. In each slice, we positioned a line perpendicular to the predicted orientation of the PP ( ; Fig. 2). The line was drawn parallel and adjacent to the edge of the entorhinal cortex in the white matter between the entorhinal cortex and the subiculum. To quantify the PP signal, we needed a metric that could quantify how well this signal pointed along the canonical direction. This metric needed to account for (i) how well the tensor points along the canonical direction (i.e., angular component – principal eigenvector) (ii), the magnitude of the tensor (i.e., length component – principal eigenvalue), and (iii) the general directionality of the signal (i.e., FA). We calculated a simple metric, the PP projection (PPproj), that captured all of these criteria. PProj was calculated for every point in the line with the following formula:
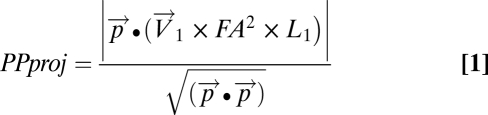 |
Where  is the PP direction,
  the principal eigenvector, L1 the principal eigenvalue and FA the fractional anisotropy.
This value is a reflection of how much of the tensor is pointing in the direction of the PP orientation, i.e., how anisotropic is that particular directional projection. The projection value is scaled by the eigenvalue and the FA, so it accounts for the direction, magnitude, and anisotropy of the tensor. This is a superior method to the use of FA alone, which is a directionless value, and could just as easily reflect anisotropy in other fibers contained in the angular bundle. It is important to note that, although there are many fibers in this region, the only fibers in the specified orientation are the PP fibers (Fig. 1B), and thus the PProj directional diffusion signal will principally reflect the PP. The PPproj should start at a low value at the beginning of the line in the white matter that does not include PP fibers, should increase over the extent of a few pixels as PP fibers predominantly make up the pixels, and then decrease again after PP fibers disappear. This is consistent with anatomical retrograde tracer studies in the nonhuman primate (e.g., Fig. 1 B and C). On a one-dimensional plot, this line resembles a tent, as shown in Fig. 2. To quantify this signal for each participant, we averaged the measurements from three slices (Fig. S3) from each hemisphere so that we get more stable quantification. For PP measurements, contiguous slices were selected based on the presence of a clear PP signal. This was consistently within 5 mm of the hippocampal head across all participants. For the alvear measurements, contiguous slices were selected based on the presence of a clear and linear alvear projection. This was consistently within 5 mm of the hippocampal tail's posterior edge across all participants.
We also used a simple fine-tuning procedure, which moved the line's control points 1 pixel in each direction and selected the best orientation (i.e., the one that yielded the best peak by fitting to a sliding tent function). To ensure that fine-tuning was unbiased and did not induce any spurious results, we also assessed a subset of participants (n = 18; nine young and nine old) without the fine-tuning step. Fig. S4 shows the raw data (without fine-tuning) and the fine-tuned data as well as the correspondence between the two (R2 = 0.76). This can be used as an implicit lower bound on intrarater reliability, which will exceed the aforementioned correlation.
We calculated AUC for each participant using the trapezoid rule implemented in Prism 5b software (GraphPad) after setting each curve's baseline value to zero to account for global differences in signal amplitude across participants. We also calculated AUC without using this baseline normalization procedure, and found largely similar results (Fig. S4 shows plots that did not use this procedure).
In addition to the one-dimensional plot, we also created a 2D plot of this metric for every pixel within a small box around the hippocampus that includes the PP region. For each participant, on each slice, the PP signature was easily identifiable as a hot spot (i.e., “blob”). Samples from four different participants (two young and two old) are shown in Fig. 2. Quantification of the alvear pathway proceeded in the exact same manner with the exception of the location in which the line was placed. In this case, the line was placed perpendicular to the dorsal hippocampus, directly bisecting the alveus, where it was most visible. Quantification was conducted on three slices in the posterior portion of the hippocampus (Fig. S3), where the alveus consists mostly of entorhinal fibers that project to CA1. Although the alveus is a curved white-matter band, the dorsal portion extends linearly for approximately 7 to 8 mm (10–12 voxels) and thus this surface was used to assess its integrity. Once again, we averaged the measurements over all slices per hemisphere.
Volumetric Assessment.
The entorhinal cortex was manually segmented bilaterally in individual subjects using a previously published protocol (36). Total intracranial volume was calculated per subject using the Brain Extraction Tool (37) implemented in 3DSkullStrip (AFNI; National Institutes of Health). This value was used to normalize entorhinal cortical volumes to account for global differences in brain volume. Group comparison using independent-samples t tests was subsequently conducted on normalized entorhinal volumes.
Supplementary Material
Acknowledgments
We thank Menno Witter and Pierre Lavenex for their expert neuroanatomical advice and feedback on our PP identification methods. We thank Ms. Shauna Stark, Ms. Samantha Rutledge, and Mr. Gregory Sanchez for help with data collection and analysis. We also acknowledge the Research Imaging Center at the University of California, Irvine, for providing resources for use in this project and the Institute for Memory Impairments and Neurological Disorders and AD Research Center at the University of California, Irvine, for help with participant recruitment. This study was supported by National Science Foundation Grant BCS-0544959 and National Institute on Aging Grant R03-AG-032015.
Footnotes
The authors declare no conflict of interest.
*This Direct Submission article had a prearranged editor.
This article contains supporting information online at www.pnas.org/lookup/suppl/doi:10.1073/pnas.1002113107/-/DCSupplemental.
References
- 1.Burke SN, Barnes CA. Neural plasticity in the ageing brain. Nat Rev Neurosci. 2006;7:30–40. doi: 10.1038/nrn1809. [DOI] [PubMed] [Google Scholar]
- 2.Wilson IA, Gallagher M, Eichenbaum H, Tanila H. Neurocognitive aging: prior memories hinder new hippocampal encoding. Trends Neurosci. 2006;29:662–670. doi: 10.1016/j.tins.2006.10.002. [DOI] [PMC free article] [PubMed] [Google Scholar]
- 3.Milner B, Squire LR, Kandel ER. Cognitive neuroscience and the study of memory. Neuron. 1998;20:445–468. doi: 10.1016/s0896-6273(00)80987-3. [DOI] [PubMed] [Google Scholar]
- 4.Squire LR, Stark CEL, Clark RE. The medial temporal lobe. Annu Rev Neurosci. 2004;27:279–306. doi: 10.1146/annurev.neuro.27.070203.144130. [DOI] [PubMed] [Google Scholar]
- 5.Witter MP, Van Hoesen GW, Amaral DG. Topographical organization of the entorhinal projection to the dentate gyrus of the monkey. J Neurosci. 1989;9:216–228. doi: 10.1523/JNEUROSCI.09-01-00216.1989. [DOI] [PMC free article] [PubMed] [Google Scholar]
- 6.Witter MP, Amaral DG. Entorhinal cortex of the monkey: V. Projections to the dentate gyrus, hippocampus, and subicular complex. J Comp Neurol. 1991;307:437–459. doi: 10.1002/cne.903070308. [DOI] [PubMed] [Google Scholar]
- 7.Witter MP. The perforant path: Projections from the entorhinal cortex to the dentate gyrus. Prog Brain Res. 2007;163:43–61. doi: 10.1016/S0079-6123(07)63003-9. [DOI] [PubMed] [Google Scholar]
- 8.Hyman BT, Van Hoesen GW, Kromer LJ, Damasio AR. Perforant pathway changes and the memory impairment of Alzheimer's disease. Ann Neurol. 1986;20:472–481. doi: 10.1002/ana.410200406. [DOI] [PubMed] [Google Scholar]
- 9.Geinisman Y, deToledo-Morrell L, Morrell F, Persina IS, Rossi M. Age-related loss of axospinous synapses formed by two afferent systems in the rat dentate gyrus as revealed by the unbiased stereological dissector technique. Hippocampus. 1992;2:437–444. doi: 10.1002/hipo.450020411. [DOI] [PubMed] [Google Scholar]
- 10.Smith TD, Adams MM, Gallagher M, Morrison JH, Rapp PR. Circuit-specific alterations in hippocampal synaptophysin immunoreactivity predict spatial learning impairment in aged rats. J Neurosci. 2000;20:6587–6593. doi: 10.1523/JNEUROSCI.20-17-06587.2000. [DOI] [PMC free article] [PubMed] [Google Scholar]
- 11.Scheff SW, Price DA, Schmitt FA, Mufson EJ. Hippocampal synaptic loss in early Alzheimer's disease and mild cognitive impairment. Neurobiol Aging. 2006;27:1372–1384. doi: 10.1016/j.neurobiolaging.2005.09.012. [DOI] [PubMed] [Google Scholar]
- 12.Taylor WD, Hsu E, Krishnan KR, MacFall JR. Diffusion tensor imaging: Background, potential, and utility in psychiatric research. Biol Psychiatry. 2004;55:201–207. doi: 10.1016/j.biopsych.2003.07.001. [DOI] [PubMed] [Google Scholar]
- 13.Chua TC, Wen W, Slavin MJ, Sachdev PS. Diffusion tensor imaging in mild cognitive impairment and Alzheimer's disease: A review. Curr Opin Neurol. 2008;21:83–92. doi: 10.1097/WCO.0b013e3282f4594b. [DOI] [PubMed] [Google Scholar]
- 14.Basser PJ. Inferring microstructural features and the physiological state of tissues from diffusion-weighted images. NMR Biomed. 1995;8:333–344. doi: 10.1002/nbm.1940080707. [DOI] [PubMed] [Google Scholar]
- 15.Pierpaoli C, Basser PJ. Toward a quantitative assessment of diffusion anisotropy. Magn Reson Med. 1996;36:893–906. doi: 10.1002/mrm.1910360612. [DOI] [PubMed] [Google Scholar]
- 16.Kalus P, et al. Examining the gateway to the limbic system with diffusion tensor imaging: The perforant pathway in dementia. Neuroimage. 2006;30:713–720. doi: 10.1016/j.neuroimage.2005.10.035. [DOI] [PubMed] [Google Scholar]
- 17.Rogalski EJ, et al. Changes in parahippocampal white matter integrity in amnestic mild cognitive impairment: A diffusion tensor imaging study. Behav Neurol. 2009;21:51–61. doi: 10.3233/BEN-2009-0235. [DOI] [PMC free article] [PubMed] [Google Scholar]
- 18.Salat DH, et al. White matter pathology isolates the hippocampal formation in Alzheimer's disease. Neurobiol Aging. 2010;31:244–256. doi: 10.1016/j.neurobiolaging.2008.03.013. [DOI] [PMC free article] [PubMed] [Google Scholar]
- 19.Pruessmann KP, Weiger M, Scheidegger MB, Boesiger P. SENSE: Sensitivity encoding for fast MRI. Magn Reson Med. 1999;42:952–962. [PubMed] [Google Scholar]
- 20.Jaermann T, et al. SENSE-DTI at 3 T. Magn Reson Med. 2004;51:230–236. doi: 10.1002/mrm.10707. [DOI] [PubMed] [Google Scholar]
- 21.Jaermann T, et al. Preliminary experience with visualization of intracortical fibers by focused high-resolution diffusion tensor imaging. AJNR Am J Neuroradiol. 2008;29:146–150. doi: 10.3174/ajnr.A0742. [DOI] [PMC free article] [PubMed] [Google Scholar]
- 22.Zhang J, van Zijl PC, Mori S. Three-dimensional diffusion tensor magnetic resonance microimaging of adult mouse brain and hippocampus. Neuroimage. 2002;15:892–901. doi: 10.1006/nimg.2001.1012. [DOI] [PubMed] [Google Scholar]
- 23.Shepherd TM, Ozarslan E, King MA, Mareci TH, Blackband SJ. Structural insights from high-resolution diffusion tensor imaging and tractography of the isolated rat hippocampus. Neuroimage. 2006;32:1499–1509. doi: 10.1016/j.neuroimage.2006.04.210. [DOI] [PubMed] [Google Scholar]
- 24.Pych JC, Venkatasubramanian PN, Faulkner J, Wyrwicz A. Decreased hippocampal fractional anisotropy in Tg2576 Alzheimer's disease–model mice may reflect a reduction in dendrites. Alzheimers Dement. 2008;4:T71–T72. [Google Scholar]
- 25.Deller T, Adelmann G, Nitsch R, Frotscher M. The alvear pathway of the rat hippocampus. Cell Tissue Res. 1996;286:293–303. doi: 10.1007/s004410050699. [DOI] [PubMed] [Google Scholar]
- 26.Rey A. L'examen psychologique dans les cas d'encephalopathie traumatique. Arch Psychol. 1941;28:286–340. [Google Scholar]
- 27.Stark CEL. Functional Role of the Human Hippocampus. In: Andersen P, Morris R, Amaral D, Bliss T, O'Keefe J, editors. The Hippocampus Book. New York: Oxford University Press; 2007. pp. 549–579. [Google Scholar]
- 28.Mizutani T, Kashara M. Degeneration of the intrahippocampal routes of the perforant and alvear pathways in senile dementia of Alzheimer type. Neurosci Lett. 1995;184:141–144. doi: 10.1016/0304-3940(94)11190-t. [DOI] [PubMed] [Google Scholar]
- 29.Tuch DS. Q-ball imaging. Magn Reson Med. 2004;52:1358–1372. doi: 10.1002/mrm.20279. [DOI] [PubMed] [Google Scholar]
- 30.Behrens TE, Berg HJ, Jbabdi S, Rushworth MF, Woolrich MW. Probabilistic diffusion tractography with multiple fibre orientations: What can we gain? Neuroimage. 2007;34:144–155. doi: 10.1016/j.neuroimage.2006.09.018. [DOI] [PMC free article] [PubMed] [Google Scholar]
- 31.Jespersen SN, Kroenke CD, Østergaard L, Ackerman JJ, Yablonskiy DA. Modeling dendrite density from magnetic resonance diffusion measurements. Neuroimage. 2007;34:1473–1486. doi: 10.1016/j.neuroimage.2006.10.037. [DOI] [PubMed] [Google Scholar]
- 32.Scholz J, Klein MC, Behrens TE, Johansen-Berg H. Training induces changes in white-matter architecture. Nat Neurosci. 2009;12:1370–1371. doi: 10.1038/nn.2412. [DOI] [PMC free article] [PubMed] [Google Scholar]
- 33.Folstein MF, Folstein SE, McHugh PR. “Mini-mental state”. A practical method for grading the cognitive state of patients for the clinician. J Psychiatr Res. 1975;12:189–198. doi: 10.1016/0022-3956(75)90026-6. [DOI] [PubMed] [Google Scholar]
- 34.Behrens TE, et al. Characterization and propagation of uncertainty in diffusion-weighted MR imaging. Magn Reson Med. 2003;50:1077–1088. doi: 10.1002/mrm.10609. [DOI] [PubMed] [Google Scholar]
- 35.Pajevic S, Pierpaoli C. Color schemes to represent the orientation of anisotropic tissues from diffusion tensor data: Application to white matter fiber tract mapping in the human brain. Magn Reson Med. 1999;42:526–540. [PubMed] [Google Scholar]
- 36.Yassa MA, Stark CEL. A quantitative evaluation of cross-participant registration techniques for MRI studies of the medial temporal lobe. Neuroimage. 2009;44:319–327. doi: 10.1016/j.neuroimage.2008.09.016. [DOI] [PubMed] [Google Scholar]
- 37.Smith SM. Fast robust automated brain extraction. Hum Brain Mapp. 2002;17:143–155. doi: 10.1002/hbm.10062. [DOI] [PMC free article] [PubMed] [Google Scholar]
Associated Data
This section collects any data citations, data availability statements, or supplementary materials included in this article.