

Abstract
Dual-energy X-ray absorptiometry (DXA) is widely used for bone mineral density and body composition assessments. However, DXA is known to overestimate muscle mass in obese adults. We used single-slice CT (ssCT) to derive a correction factor to enhance accuracy of DXA estimation of specific strength (strength per unit muscle). One hundred and sixty-two adults (age: 55.0 ± 2.7 yr, range: 50–59) were enrolled in this cross-sectional study and divided into groups based on body mass index (BMI: < 30, 30–35, and ≥35). BMI groups did not differ in age, knee extensor strength (KES), thigh lean mass by DXA, or quadriceps cross-sectional area (CSA) by ssCT. Specific strength (KES/CSA) correlated with an uncorrected estimate of DXA–specific strength (r = 0.82, 0.53, 0.84 and 0.74, 0.59, 0.57, p < 0.001) in the lowest to highest BMI groups in men and women, respectively. Stronger correlations were achieved through correcting for BMI, age, and sex in estimating DXA—specific strength (r = 0.81, 0.79, and 0.96 in the lowest to highest BMI groups in men and 0.94, 0.81, 0.85 in women, p < 0.0001). Quantification of knee extensor—specific strength by DXA in men with BMI >30 and all BMI groups in women greatly improved using a correction factor for DXA estimates of thigh lean mass.
Keywords: CT, dual-energy X-ray absorptiometry, fat-free mass, knee extensor strength, obesity, specific strength
Introduction
The loss of muscle mass and quality with age and a resulting decrease in strength and function have been well documented (1–4). A means to accurately characterize thigh muscle is especially important because of the associations between leg muscle mass and quality, reduced functional performance, and loss of mobility (5,6). Specific strength (strength per unit muscle) is a useful measure of muscle quality because it adjusts for the amount of contractile tissue contributing to the measurement of strength. Currently, thigh muscle mass, which is used for determining lower limb—specific strength, can be accurately estimated using computed tomography (CT) (7,8). However, the expense and radiation exposure limits its routine application in research and clinical settings.
Dual-energy X-ray absorptiometry (DXA) is widely used for measuring bone mineral density and body composition based on tissue attenuation factors. Although this is a quick and inexpensive test requiring minimal radiation exposure, there are important limitations to the accuracy of muscle mass estimations using DXA (9–12). Error in estimates of muscle mass may result from an inability to discriminate between the different components of lean mass including mostly skeletal muscle, skin, and connective tissue, and especially the lean component of adipose tissue (9,10). Such error is greater in the context of obesity and age-related changes in body composition that alter the ratio of adipose tissue to skeletal muscle. Both of these circumstances may result in error in DXA muscle mass estimations (13). As 66% of adults in the United States are either overweight or obese (14) and there is a need to identify sarcopenia in a rapidly expanding population of older adults, it would be useful to be able to use a widely available test, such as DXA, to determine specific strength in these groups. Therefore, our objective was to derive a correction factor to improve the accuracy of DXA for estimating specific strength of the knee extensors in obese, older adults using specific strength by ssCT as a gold standard.
Materials and Methods
Subjects
Subjects were recruited primarily from the Iowa clinical center of the Multicenter Osteoarthritis (MOST) Study, a longitudinal study of 3026 men and women with risk factors for knee osteoarthritis (OA) or existing knee OA. Recruitment and screening procedures for MOST have been previously described (15). MOST subjects aged 50–59 yr were pre-screened for eligibility for the present study then were approached consecutively at the time of their MOST clinic visit (baseline, 15- or 30-mo follow-up). Additional subjects were recruited using an Institutional Review Board (IRB)–approved letter mailed to individuals aged 50–59 yr who had been diagnosed with knee OA at the University of Iowa. All subjects gave written, informed consent using an IRB–approved consent document for this study.
Exclusion Criteria
To avoid potentially confounding effects on the relationship between muscle bulk and strength, lower limbs with a history of knee injury that required use of a brace or gait aid for more than 2 d, total knee arthroplasty, knee surgery within the previous 6 mo, periarticular fracture, neuromuscular disease, or joint infection were excluded from the study. In addition, subjects weighing 300 lb or greater were excluded due to DXA scanner weight limitations.
Measures
Anthropometric Measurements
Heights were obtained by stadiometer (Holtain Ltd., Crosswell, Crymych, Pembrokeshire, UK) to the nearest 1 mm. Weights were assessed using a balance beam scale to the nearest 0.1 kg, and body mass index (BMI) was calculated as weight divided by height squared.
Dual-energy X-ray Absorptiometry
Whole body DXA scans were obtained using Hologic QDR 4500 W densitometers (Software version 12.0, Hologic Inc, Bedford, MA). Densitometers were calibrated daily by certified technicians. Subjects changed into hospital gowns and removed all external metal artifacts before scans. Scans were completed according to manufacturer’s guidelines. Thigh fat and fat-free mass were analyzed by one technician and determined by redefining the region of interest using the manufacturer’s body composition analysis software. Lines through the femoral neck parallel to and just proximal to the greater trochanter and through the knee joint line, respectively, defined the superior and inferior borders of the region of interest. The lateral border was bounded outside of the thigh adipose shadow and the medial border was defined by a line between the right and left thighs for separate determinations of fat and fat-free mass in each thigh (Fig. 1). Bone mineral content was subtracted from fat-free mass to obtain lean mass measurements.
Fig. 1.
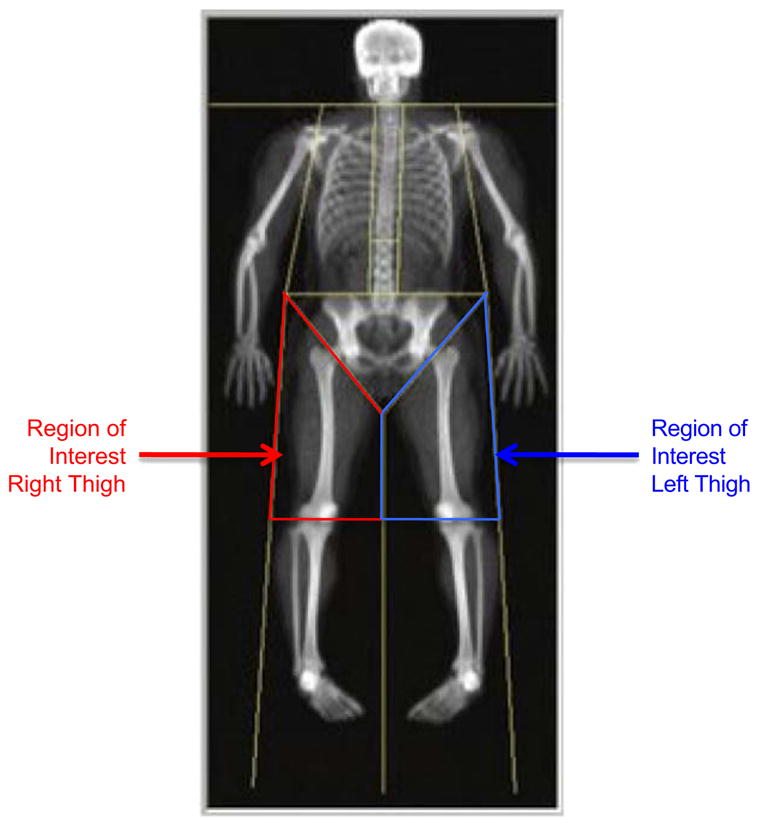
DXA thigh lean mass region of interest.
Single-slice CT of the Mid-thigh
An ssCT at the mid-thigh level was obtained using a Somatom Sensation 16-slice scanner (Siemans USA, Malvern, PA). A scout image was completed to determine the mid-thigh site, defined at half the linear distance between the anterior superior iliac spine and the upper border of the patella. A 500 ms, 5 mm, single-slice image was collected at 120 kVp and 100 mAs. Images were systematically examined for Hounsfield units characteristic of muscle and fat. The cross-sectional area (CSA) of the quadriceps muscle and intramuscular fat were measured using SliceOMatic software version 4.3 (Tomovision, Montreal, Canada) (16). Test-retest correlation for the ssCT measurements of muscle CSA was 0.985.
Isokinetic Strength
Isokinetic strength testing of the quadriceps was performed on a Cybex 350 dynamometer (Cybex International, Inc., Medway, Massachusetts) at 60°/s. A standardized protocol for measuring quadriceps strength was followed (15) and the isokinetic dynamometer was calibrated monthly by the manufacturer’s protocol.
Specific Strength
Specific strength was defined as peak knee extensor strength (KES) divided by a unit of thigh muscle bulk measured as (1) CSA by ssCT (ssCT–specific strength), (2) thigh lean mass by DXA (DXA—specific strength), or (3) corrected DXA thigh lean mass (corrected DXA—specific strength).
Statistical Analyses
Analyses were performed using SAS Version 9.1 (SAS Institute, Cary, NC) with an alpha level set at p = 0.05 for statistical significance. Sex strata were divided into the following BMI groups: < 30 kg/m2, between 30–35 kg/m2, and ≥35 kg/m2. Regression models used linear mixed models to control for covariance between thighs within subjects. The initial model for correction of DXA thigh lean mass—evaluated DXA thigh lean mass, DXA thigh fat mass, BMI, age, sex, and interactions between these variables and sex. Interactions between sex and BMI and between sex and age were not significant and were dropped from the final model. Therefore, using the beta coefficients from this final model, separate equations were used to derive corrected DXA thigh lean mass in men {DXA thigh lean mass*0.004542 + B-MI*0.5158 + age*(−0.5651) + thigh fat mass*(−0.00733) + 67.6871} and women {DXA thigh lean mass*0.002685 + B-MI*0.5158 + age*(−0.5651) + thigh fat mass *(−0.00347) + 61.1642}. Descriptive statistics were summarized as means ± standard deviations with BMI and sex groups analyzed separately. Tukey-Kramer pairwise comparisons were used for evaluating differences between BMI groups. Relationships between ssCT quadriceps CSA, DXA thigh lean mass, and corrected DXA thigh lean mass as well as between ssCT specific strength, DXA—specific strength, and corrected DXA—specific strength were evaluated with Pearson correlation coefficients.
Results
Subjects
A total of 156 subjects (298 lower limbs), including 76 men (142 limbs) and 80 women (156 limbs) met eligibility criteria and were included in the study. Excluded were 6 participants (8 limbs) due to pain during the strength measurement that led to inability to obtain an accurate measure of strength. BMI groups did not significantly differ in age, height, or KES (Table 1). The < 30 BMI group ranged from BMI = 20.52 to 29.92 and from 20.16 to 29.81 in men and women, respectively. The 30 to 35 BMI group ranged from 30.42 to 34.97 in men and from 31.20 to 34.93 in women. The ≥35 BMI group range for men was 35.01–63.76 and 35.11–60.72 for women.
Table 1.
Mean ± SD Anthropometric Measures and Strength in BMI Groups
| BMI group (kg/m2) |
BMI (kg/m2) |
Age (yr) |
Height (cm) |
Knee extensor torque (N·m) |
||||
|---|---|---|---|---|---|---|---|---|
| Men | Women | Men | Women | Men | Women | Men | Women | |
| <30 | 25.0 ± 2.5 | 23.6 ± 1.8 | 55.3 ± 2.5 | 55.2 ± 2.8 | 178.4 ± 7.7 | 164.8 ± 6.1 | 148.8 ± 30.9 | 85.4 ± 24.0 |
| 30–35 | 32.5 ± 1.3 | 33.4 ± 1.1 | 55.0 ± 2.8 | 55.5 ± 2.5 | 177.9 ± 7.3 | 162.8 ± 5.4 | 151.3 ± 38.3 | 95.6 ± 21.0 |
| ≥35 | 41.3 ± 7.4 | 40.9 ± 6.3 | 54.6 ± 3.1 | 55.5 ± 2.3 | 179.2 ± 6.8 | 162.3 ± 5.8 | 159.1 ± 42.8 | 86.2 ± 27.5 |
Abbrev: BMI, body mass index; SD, standard deviation.
No statistically significant differences in means comparing BMI groups within men and women.
ssCT Quadriceps CSA and DXA Thigh Lean Mass
ssCT quadriceps CSAs did not significantly differ between BMI groups (Table 2). However, DXA thigh lean mass was greater in men with a BMI >30 compared with the lowest BMI group in men. DXA thigh lean mass differed among all BMI groups in women with the lowest mass in the BMI < 30 group and highest in the ≥35 BMI group (p < 0.001), as expected. Correlations between ssCT quadriceps CSA and DXA thigh lean mass in each BMI group are presented in Table 2a.
Table 2a.
Means and Correlations Between ssCT Quadriceps CSA and DXA Thigh Lean Mass
| BMI group (kg/m2) | ssCT quadriceps CSA (mean ± SD, cm2)a |
DXA thigh lean mass (mean ± SD, g) |
r, (p Value) |
|||
|---|---|---|---|---|---|---|
| Men | Women | Menb | Womenc | Men | Women | |
| < 30 | 65.8 ± 10.7 | 45.0 ± 5.7 | 6409.8 ± 1017.1 | 5028.3 ± 1469.0 | 0.62 (<0.01) | 0.43 (<0.01) |
| 30–35 | 67.0 ± 12.2 | 44.7 ± 7.1 | 8055.7 ± 1961.3 | 6331.4 ± 1351.4 | 0.06 (0.67) | 0.38 (0.02) |
| ≥35 | 66.0 ± 9.6 | 45.8 ± 7.3 | 8601.2 ± 960.0 | 7354.5 ± 1694.4 | 0.37 (0.16) | −0.04 (0.80) |
Abbrev: CSA, cross-sectional area; ssCT, single-slice computed tomography; DXA, dual-energy X-ray absorptiometry; BMI, body mass index.
All analyses comparing BMI groups stratified by sex.
No significant differences between BMI groups in men or women.
Significant difference in men with BMI <30 and BMI ≥30 (p < 0.001).
Significant difference between all BMI groups (p < 0.001).
There were no significant differences in corrected DXA thigh lean mass among BMI groups in men. The lowest DXA thigh lean mass still occurred in the BMI <30 group (p = 0.014), but women with a BMI 30–35 and BMI ≥35 Kg/M2 no longer differed. Correlations between ssCT quadriceps CSA and corrected DXA thigh lean mass were higher than the correlations with uncorrected DXA thigh lean mass (Table 2b).
Table 2b.
Correlations Between ssCT Quadriceps Cross-sectional Area (CSA) and DXA Corrected Thigh Lean Mass
| BMI Group (kg/m2) | ssCT quadriceps CSA (mean ± SD, cm2) |
Corrected DXA thigh lean mass (mean ± SD, cm2) |
rc |
|||
|---|---|---|---|---|---|---|
| Mena | Womena | Mena | Womenb | Men | Women | |
| < 30 | 65.8 ± 10.7 | 45.0 ± 5.7 | 65.2 ± 5.3 | 44.3 ± 3.6 | 0.56 | 0.63 |
| 30–35 | 67.0 ± 12.2 | 44.7 ± 7.1 | 66.1 ± 7.5 | 45.9 ± 4.5 | 0.62 | 0.63 |
| ≥35 | 66.0 ± 9.6 | 45.8 ± 7.3 | 64.3 ± 8.4 | 46.0 ± 3.7 | 0.78 | 0.46 |
Abbrev: ssCT, single-slice computed tomography; DXA, dual-energy X-ray absorptiometry; BMI, body mass index; CSA, cross-sectional area; SD, standard deviation.
No significant differences in sex-stratified analyses between BMI groups.
Significant differences between BMI <30 and BMI 30–35 and between BMI 30–35 and ≥35 (p = 0.014).
All p values <0.001 for sex-stratified analyses comparing ssCT quadriceps CSA and corrected DXA thigh lean mass.
Specific Strength Measurements
Means and standard deviations for specific strength measurements are presented in Table 3. There were no significant differences among BMI groups in ssCT specific strength in men while women in the highest and lowest BMI groups had significantly lower ssCT—specific strength than women in the middle BMI group (p = 0.027). Separate analyses in men and women showed positive correlations between specific strength measurements determined by DXA (uncorrected) and ssCT in men and women. As shown in Table 4 and Figs. 2 and 3, there was a statistically significant improvement in correlation coefficients between corrected DXA—specific strength and ssCT—specific strength measurements in all groups.
Table 3.
Mean ± SD Specific Strength by ssCT, DXA, and Corrected DXA
| BMI group (kg/m2) | ssCT–specific strength (mean ± SD, N·m/cm2) |
DXA–specific strength (mean ± SD, N·m/g) |
Corrected DXA–specific strength (mean ± SD, N·m/cm2) |
|||
|---|---|---|---|---|---|---|
| Men | Women | Men | Women | Men | Women | |
| <30 | 2.27 ± 0.49 | 1.91 ± 0.50 | 0.023 ± 0.005 | 0.018 ± 0.006 | 2.27 ± 0.46 | 1.93 ± 0.51 |
| 30–35 | 2.29 ± 0.47 | 2.17 ± 0.51 | 0.019 ± 0.006 | 0.016 ± 0.004 | 2.29 ± 0.53 | 2.09 ± 0.42 |
| ≥35 | 2.51 ± 0.67 | 1.90 ± 0.56 | 0.020 ± 0.006 | 0.013 ± 0.004 | 2.75 ± 0.80 | 1.95 ± 0.55 |
Abbrev: ssCT, single-slice computed tomography; DXA, dual-energy X-ray absorptiometry; BMI, body mass index.
Table 4.
Correlations Between ssCT—Specific Strength and DXA Uncorrected and Corrected Specific Strength
| BMI group (kg/m2) | Uncorrected (R) men |
Corrected (r) women |
||
|---|---|---|---|---|
| Uncorrected | Corrected | Uncorrected | Corrected | |
| <30 | 0.82 | 0.81 | 0.74 | 0.94 |
| 30–35 | 0.53 | 0.79 | 0.59 | 0.81 |
| ≥35 | 0.84 | 0.96 | 0.57 | 0.85 |
Abbrev: ssCT, single-slice computed tomography; DXA, dual-energy X-ray absorptiometry; BMI, body mass index.
All p values <0.001.
Fig. 2.

(A) Correlations between ssCT–specific strength and DXA–specific strength in men. (B) Correlations between ssCT–specific strength and corrected DXA–specific strength in men.
Fig. 3.

(A) Correlations between ssCT–specific strength and DXA–specific strength in women. (B) Correlations between ssCT–specific strength and corrected DXA–specific strength in women.
Discussion
Accurate quantification of muscle mass for specific strength determinations is an important consideration in quantifying sarcopenia of aging. DXA has been widely used for body composition studies despite known error in estimates of muscle mass with obesity. The correction factor used in this study was found to significantly improve the ability of DXA to estimate specific strength in comparison with specific strength using ssCT.
The present study is the first of which we are aware to propose a method for improving thigh lean mass estimations by DXA for specific strength determinations in an obese population. We found quadriceps CSA by ssCT positively correlated with thigh lean mass by DXA in men with a BMI <30 and women with a BMI <35 and these correlations were greatly improved and became significant in all BMI groups with our model. This is consistent with a study of sarcopenia conducted by Newman et al., which used DXA to compare 2 methods for identifying individuals with sarcopenia (17). Using the lowest 20th percentile as the cut-off for sarcopenia, the first method involved dividing DXA appendicular lean mass by the square of height, whereas the second one involved adjusting DXA appendicular lean mass for height and total fat mass. This study of elderly men and women, aged 70–79 yr, found the proportion of women with lower limb functional limitation was higher using the second method and concluded that lean mass by DXA correlates better with strength in women and in overweight or obese individuals when interpreted using a method considering body composition (17). However, these methods were not evaluated against a reference method. In the present study, a correction of DXA thigh lean mass was derived using a reference measure of muscle through accounting for fat mass, age, sex, and BMI.
Other models for improving estimates of muscle mass by DXA have been proposed. Fuller et al. evaluated a model, which decreased DXA overestimation of skeletal muscle mass by applying constants for fat and fat-free tissue in bone and skin and subtracted these from total limb mass (18,19). However, the model suited lean individuals better than obese individuals.
Levine et al. found positive correlations between DXA measurement of fat-free mass and skeletal muscle area measured by ssCT (R2 = 0.74) and muscle volume by multi-slice CT (R2 = 0.96) despite an overestimation of fat-free mass by DXA (9). The correlation between ssCT quadriceps muscle CSA and DXA thigh lean mass in our study (R2 = 0.14) was much lower than that found in Levine’s study (R2 = 0.74). This difference was likely because of the older (55.0 ± 2.7 vs. 39 ± 13 yr) and more obese (BMI = 32.0 ± 7.9 vs. 25.5 ± 6.6) individuals in our study and the concurrent greater variation in thigh fat mass. For example, the fact that BMI was fairly homogenous (25.5 ± 6.6) in Levine’s study may explain why a consistent percentage of lean mass measured by DXA could be attributed to “non-muscle lean mass” and remain significantly correlated with CT muscle area. If there had been greater variance in the amount of fat mass, one would expect that the contribution of adipose tissue to the fat-free mass would represent a varying percentage of the estimated fat-free mass, thereby reducing the correlation with muscle volume by CT. However, this effect might be ameliorated by considering the known error in lean mass estimation by DXA in subjects with increased fat mass and introducing a correction factor, such as the one proposed in our study.
Our data demonstrate limitations to the accuracy of unaltered estimates of thigh lean mass by DXA. Although we found no differences in ssCT quadriceps muscle CSA among BMI groups, DXA measured thigh lean mass significantly differed among all BMI groups in women and in men with a BMI <30 compared with those ≥30. Similarly, Visser et al. found DXA significantly overestimated total thigh muscle mass compared with total thigh muscle mass measured by CT despite 75% of subjects in the study having a BMI <30 (10). In the present study, the higher value for thigh lean mass measured by DXA in the higher BMI groups likely represents inclusion of an increased proportion of noncontractile lean components of adipose tissue. This may indicate the insensitivity of DXA for discriminating between muscle mass and noncontractile lean mass, particularly in obese adults. Specific strength, which adjusts for the amount of contractile tissue contributing to strength measurement, provides a clinically meaningful indication of strength. Therefore, the increased accuracy of DXA for this measurement in obese older adults, using the correction factor tested in this study, may improve the ability to use DXA for clinical measurement of specific strength in this group.
Conclusion
The correction factor for DXA estimates of thigh-specific strength, developed and tested in this study, may enable use of DXA to estimate quadriceps-specific strength in obese adults while avoiding the need for ssCT. Future research should assess the validity of this correction factor in different populations and associations with functional status.
Acknowledgments
Funding: This work was funded by NICHD through the Association of Academic Physiatrists (Neil Segal, MD—5K12HD001097-08).
Footnotes
Disclaimers: The authors have no professional relationships with companies or manufacturers who will benefit from the results of the present study.
References
- 1.Newman AB, Haggerty CL, Goodpaster B, et al. Strength and muscle quality in a well-functioning cohort of older adults: the health, aging and body composition study. J Am Geriatr Soc. 2003;51:323–330. doi: 10.1046/j.1532-5415.2003.51105.x. [DOI] [PubMed] [Google Scholar]
- 2.Baumgartner RN, Koehler KM, Gallagher D, et al. Epidemiology of sarcopenia among the elderly in new Mexico. Am J Epidemiol. 1998;147:755–763. doi: 10.1093/oxfordjournals.aje.a009520. [DOI] [PubMed] [Google Scholar]
- 3.Lauretani F, Russo CR, Bandinelli S, et al. Age-associated changes in skeletal muscles and their effect on mobility: an operational diagnosis of sarcopenia. J Appl Physiol. 2003;95:1851–1860. doi: 10.1152/japplphysiol.00246.2003. [DOI] [PubMed] [Google Scholar]
- 4.Melton LJ, 3rd, Khosla S, Crowson CS, et al. Epidemiology of sarcopenia. J Am Geriatr Soc. 2000;48:625–630. [PubMed] [Google Scholar]
- 5.Visser M, Kritchevsky SB, Goodpaster BH, et al. Leg muscle mass and composition in relation to lower extremity performance in men and women aged 70 to 79: the health, aging and body composition study. J Am Geriatr Soc. 2002;50:897–904. doi: 10.1046/j.1532-5415.2002.50217.x. [DOI] [PubMed] [Google Scholar]
- 6.Visser M, Goodpaster BH, Kritchevsky SB, et al. Muscle mass, muscle strength, and muscle fat infiltration as predictors of incident mobility limitations in well-functioning older persons. J Gerontol A Biol Sci Med Sci. 2005;60:324–333. doi: 10.1093/gerona/60.3.324. [DOI] [PubMed] [Google Scholar]
- 7.Mitsiopoulos N, Baumgartner RN, Heymsfield SB, et al. Cadaver validation of skeletal muscle measurement by magnetic resonance imaging and computerized tomography. J Appl Physiol. 1998;85:115–122. doi: 10.1152/jappl.1998.85.1.115. [DOI] [PubMed] [Google Scholar]
- 8.Goodpaster BH, Thaete FL, Kelley DE. Composition of skeletal muscle evaluated with computed tomography. Ann N Y Acad Sci. 2000;904:18–24. doi: 10.1111/j.1749-6632.2000.tb06416.x. [DOI] [PubMed] [Google Scholar]
- 9.Levine JA, Abboud L, Barry M, et al. Measuring leg muscle and fat mass in humans: comparison of ct and dual-energy X-ray absorptiometry. J Appl Physiol. 2000;88:452–456. doi: 10.1152/jappl.2000.88.2.452. [DOI] [PubMed] [Google Scholar]
- 10.Visser M, Fuerst T, Lang T, et al. Validity of fan-beam dual-energy X-ray absorptiometry for measuring fat-free mass and leg muscle mass. Health, aging, and body composition study—Dual-energy X-ray Absorptiometry and Body Composition Working Group. J Appl Physiol. 1999;87:1513–1520. doi: 10.1152/jappl.1999.87.4.1513. [DOI] [PubMed] [Google Scholar]
- 11.Wang ZM, Visser M, Ma R, et al. Skeletal muscle mass: evaluation of neutron activation and dual-energy X-ray absorptiometry methods. J Appl Physiol. 1996;80:824–831. doi: 10.1152/jappl.1996.80.3.824. [DOI] [PubMed] [Google Scholar]
- 12.Proctor DN, O’Brien PC, Atkinson EJ, Nair KS. Comparison of techniques to estimate total body skeletal muscle mass in people of different age groups. Am J Physiol. 1999;277:E489–495. doi: 10.1152/ajpendo.1999.277.3.E489. [DOI] [PubMed] [Google Scholar]
- 13.Kim J, Wang Z, Heymsfield SB, et al. Total-body skeletal muscle mass: estimation by a new dual-energy X-ray absorptiometry method. Am J Clin Nutr. 2002;76:378–383. doi: 10.1093/ajcn/76.2.378. [DOI] [PubMed] [Google Scholar]
- 14.National Center for Health Statistics. Health, United States with chartbook on trends in the health of Americans. U.S. Government Printing Office; Maryland: 2005. [Google Scholar]
- 15.Segal NA, Torner JC, Yang M. Muscle mass is more strongly related to hip bone mineral density than is quadriceps strength or lower activity level in adults over age 50 years. J Clin Densitom. 2008;11:1–8. doi: 10.1016/j.jocd.2008.03.001. [DOI] [PMC free article] [PubMed] [Google Scholar]
- 16.Goodpaster BH, Carlson CL, Visser M, et al. Attenuation of skeletal muscle and strength in the elderly: the health ABC study. J Appl Physiol. 2001;90:2157–2165. doi: 10.1152/jappl.2001.90.6.2157. [DOI] [PubMed] [Google Scholar]
- 17.Newman AB, Kupelian V, Visser M, et al. Sarcopenia: Alternative definitions and associations with lower extremity function. J Am Geriatr Soc. 2003;51:1602–1609. doi: 10.1046/j.1532-5415.2003.51534.x. [DOI] [PubMed] [Google Scholar]
- 18.Fuller NJ, Laskey MA, Elia M. Assessment of the composition of major body regions by dual-energy X-ray absorptiometry (DEXA), with special reference to limb muscle mass. Clin Physiol. 1992;12:253–266. doi: 10.1111/j.1475-097x.1992.tb00831.x. [DOI] [PubMed] [Google Scholar]
- 19.Fuller NJ, Hardingham CR, Graves M, et al. Assessment of limb muscle and adipose tissue by dual-energy X-ray absorptiometry using magnetic resonance imaging for comparison. Int J Obes Relat Metab Disord. 1999;23:1295–1302. doi: 10.1038/sj.ijo.0801070. [DOI] [PubMed] [Google Scholar]