

Abstract
Phenylketonuria (PKU) requires a lifelong low-phenylalanine (phe) diet where protein needs are met by consumption of a phe-free amino acid (AA) formula; complaints of persistent hunger are common. Foods made with glycomacropeptide (GMP), an intact protein that contains minimal phe and may promote satiety, provide an alternative to AA formula. The objective was to assess the ability of a GMP breakfast to promote satiety and affect plasma concentrations of AAs, insulin, and the appetite stimulating hormone ghrelin in those with PKU, when compared to an AA-based breakfast. Eleven PKU subjects (8 adults and 3 boys ages 11–14) served as their own controls in an inpatient metabolic study with two 4-day treatments: an AA-based diet followed by a diet replacing all AA formula with GMP foods. Plasma concentrations of AAs, insulin and ghrelin were obtained before and/or 180 minutes after breakfast. Satiety was assessed using a visual analog scale before, immediately after and 180 minutes after breakfast. Postprandial ghrelin concentration was significantly lower (p=0.03) with GMP compared to an AA-based breakfast, with no difference in fasting ghrelin. Lower postprandial ghrelin concentrations were associated with greater feelings of fullness 180 minutes after breakfast suggesting greater satiety with GMP compared to AAs. Postprandial concentrations of insulin and total plasma AAs were higher after a GMP breakfast compared to an AA-based breakfast consistent with slower absorption of AAs from GMP. These results show sustained ghrelin suppression, and suggest greater satiety with ingestion of a meal containing GMP compared with AAs.
Keywords: satiety, hunger, insulin, PKU, GMP
1.1 INTRODUCTION
Phenylketonuria (PKU) is an inborn error of amino acid (AA) metabolism caused by mutations in phenylalanine (phe) hydroxylase (EC 1.14.16.1) resulting in a decreased ability or inability to convert the essential AA phe to tyrosine. A diet low in phe and supplemented with an AA-based formula to meet protein requirements must be initiated soon after birth to prevent irreversible cognitive impairment [1] and is recommended throughout life [2, 3]. Dietary compliance however, is often poor, particularly in adolescence and adulthood [2, 4]. The difficulty of the PKU diet is due not only to its highly restrictive nature, restricting high protein foods as well as bread, rice and some vegetables; but also to the required intake of a phe free AA-based formula (24–32 oz per day). The taste and smell of these AA-based formulas can be offensive and individuals with PKU frequently drink the formula in one sitting, despite evidence that taking formula 3 or more times a day improves protein utilization and metabolic control [5, 6]. Moreover, consumption of the AA-based formula in one sitting, often at breakfast, results in hunger throughout the day when food intake consists of predominantly low-protein foods high in refined carbohydrates.
Protein is the most satiating macronutrient [7–9] and whey protein in particular has been shown to induce satiety to a greater extent when compared to casein, soy and egg albumin [10–12]. Whey’s satiating effect is attributed to its rapid digestion and absorption, resulting in rapid increases in plasma AA, insulin, glucagon-like peptide-1 and cholecystokinin [10, 11]. Glycomacropeptide (GMP), the third most abundant protein in whey, has a unique advantage for PKU because pure GMP contains no phe or other aromatic AAs and is naturally enriched in the large neutral AAs threonine, isoleucine and valine [13], shown to reduce phe concentration in plasma and brain [14]. Moreover, GMP may promote satiety [15, 16], although studies in humans have shown mixed results [17–21]. A recent well controlled study by Veldhorst et al [21] found GMP to have no effect on hormone levels or subjective satiety, however subjects ate approximately 10% less at lunch following a breakfast with whey that included GMP compared to a breakfast with whey from which GMP was removed. These data support GMPs potential effect to decrease food intake.
Satiety is regulated by a complex system of both anorexigenic (appetite suppressing) and orexigenic (appetite stimulating) hormones [22]. Ghrelin, which can promote protein synthesis through its stimulation of growth hormone [23], is the only known orexigenic hormone. Ghrelin levels increase during fasting to stimulate appetite and decrease following a meal in proportion to energy intake [24, 25]. Plasma ghrelin concentrations are decreased in obesity and increased following weight loss [26]. In addition, young children with PKU show decreased fasting plasma ghrelin concentrations when metabolic control is poor [27].
Foods made with the intact protein GMP supplemented with limiting AAs, improve protein utilization [28] and are more acceptable than commercially available AA-based formulas and low protein products [29, 30]. Thus, GMP foods provide an alternative source of protein for individuals with PKU [29]. Given GMPs potential to promote satiety, our objective was to assess satiety using a visual analog scale (VAS) and compare plasma concentrations of total AAs, insulin and ghrelin in individuals with PKU fed a GMP breakfast compared to an AA-based breakfast.
2. MATERIALS AND METHODS
2.1 Subjects
Eleven individuals with PKU (four females, seven males) followed at the Waisman Center, Biochemical Genetics Program, University of Wisconsin-Madison were recruited for an inpatient metabolic study at the Clinical and Translational Research Core, University of Wisconsin Hospital and Clinics (UW-CTRC) [28]. All subjects were diagnosed with classical PKU in infancy, based on phe concentrations of ≥1200 μmol/L before dietary treatment. At study initiation all subjects were following a low-phe diet and consuming phe-free AA formula(s) with varying degrees of metabolic control. Three subjects were children (age range: 11–14 y; all males) and eight subjects were adults (mean age 27 y; range 20–31 y; 4 males and 4 females). The three children were in the normal range of body mass index (BMI) for age; however, five of the eight adult subjects were overweight based on a BMI of 25–28. Prior to initiation of this study, the University of Wisconsin-Madison Health Sciences Institutional Review Board approved all project protocols and informed consent was obtained.
2.2 Study Protocol
Each subject served as his or her own control by consuming both diet treatments in the 8 day protocol: the AA diet (days 1–4) and the GMP diet (days 5–8). One 24-hr menu was designed for the AA diet and another for the GMP diet; the same menu was repeated on all days of each diet treatment. The AA diet included the subject’s usual AA formula, which was different for each subject. For the GMP diet, low-phe GMP foods were substituted for the subject’s entire daily intake of AA formula; supplementation of GMP with limiting AAs and sample menus have been published previously [28, 31]. Menus were individualized for energy needs using appropriate equations to estimate energy requirements. The menus for each diet treatment were controlled for energy, protein, phe, and fat; AA or GMP products were divided into 3 equal quantities throughout the day.
Each subject was provided with all food and formula to consume at home for 2 days before initiation of the study and for days 1 and 2 of the AA diet. Before dinner on day 2, each subject was admitted to the UW-CTRC for continuation of the AA diet (days 3 and 4) and for 4 days of the GMP diet (days 5–8). Timing of meals and snacks as well as exercise was similar to each subject’s reported usual routine.
2.3 Plasma Amino Acids and Hormone Measurements
During the UW-CTRC admission, blood was drawn daily. All postprandial blood samples were drawn 180 minutes after the start (150 minutes after completion) of breakfast. For the last six subjects (Subject 6–11) fasting blood samples were also obtained before breakfast on the last two days of the AA diet (days 3 and 4) and on the last 2 days of the GMP diet (days 7 and 8).
An AA profile was completed on all fasting and postprandial plasma samples collected on days 3–8 by using a Beckman 6300 amino acid analyzer (Beckman-Coulter Inc, Fullerton, CA) equipped with an ion chromatography system that uses postcolumn ninhydrin derivatization [32]. Total plasma ghrelin was measured in fasting (n=6) and postprandial (n=11) samples by radioimmunoassay (Linco Research, St Charles, MO); for each subject equal volumes of plasma were combined for days 3 + 4 (AA diet) and days 7 + 8 (GMP diet) as supported by observed stability of the plasma AA profile on these days [28]. Total ghrelin for subject 2 was removed from analysis because the interpolated value was a clear statistical outlier that greatly exceeded the highest concentration on the standard curve. The pooled samples were also used to measure plasma insulin in postprandial samples using a radioimmunoassay specific for human insulin (Linco Research, St Charles, MO).
2.4 Motivation-to-eat VAS questionnaires
Each subject completed a four-question motivation-to-eat VAS questionnaire three times: before breakfast, immediately following breakfast, and 2 hours after finishing breakfast to assess subjective measures of appetite and satiety [33]. Each question consisted of a 100 mm line with opposing statements on either end. Subjects were asked to indicate with a vertical mark where on the line best described their feelings at the time with regards to the following questions: 1) How strong is your desire to eat?, 2) How hungry do you feel?, 3) How full do you feel? and 4) How much food do you think you can eat? (prospective food consumption, PFC). An appetite score to reflect the four questions on the motivation-to-eat VAS questionnaire was calculated for each questionnaire using the formula [34]:
2.5 Statistical analysis
All statistical analysis was conducted with the statistical program R for Mac OS X version 2.9 (R Project for Statistical Computing, Wirtschaftsuniversität, Vienna, Austria; http://www.r-project.org). Primary analyses were performed using two-tailed paired t-tests, pairing on subject. Tests were considered significant at p<0.05; values are means ± SEM. Fasting and postprandial plasma ghrelin values were compared within each diet treatment (e.g., fasting AA vs. postprandial AA) and between the diet treatments (e.g., fasting AA vs. fasting GMP) using a paired t-test, pairing on subject. Plasma insulin and the plasma concentration of AAs were also compared between the AA and GMP diets using this same method. Motivation-to-eat VAS questionnaires on the last day of the AA diet and the last day of the GMP diet were compared within diets (e.g., fasting AA vs. postprandial AA) and between diets (e.g., fasting AA vs. fasting GMP). Secondary analysis used a linear mixed effects model to examine the effect of: BMI, diet treatment, age, macronutrient intake at breakfast, plasma phe and plasma values (ghrelin, insulin and/or total AAs) on answers to daily VAS questionnaires and each plasma value (ghrelin, insulin or total AAs), controlling for a random subject effect. If there was no subject effect, a fixed effects linear model was used. The best model was found using backward elimination, eliminating insignificant variables.
3. RESULTS
3.1 Macronutrient intake and motivation-to-eat VAS profiles
Both the AA and GMP diets provided 10% calories from protein, 24% from fat, 66% from carbohydrates, with 13 mg phe per kg bodyweight [28]. Composition of breakfast is outlined in Table 1. The grams of protein intake was significantly higher in the AA compared to the GMP breakfast (based on conversion of AA to protein equivalents using 16% nitrogen), although the percent of calories from protein was not significantly different. The amount of fat, phe and total energy consumed at breakfast were not significantly different between the two diets; the percent of calories from carbohydrate (calculated by difference) was significantly higher by 7.8% in the GMP breakfast in association with its lower protein content.
Table 1.
Nutrient composition of GMP or AA-based breakfasta
| AA Breakfast | GMP Breakfast | |
|---|---|---|
| Kcal | 544 ± 46 | 560 ± 51 |
| Phe (mg) | 218 ± 50 | 219 ± 50 |
| Protein (g) | 20.7 ± 1.4 | 18.4 ± 1.6* |
| Fat (g) | 12.9 ± 2.0 | 12.9 ± 1.7 |
| % kcal Protein | 15.5 ± 0.8 | 13.6 ± 1.0 |
| % kcal Fat | 20.8 ± 2.1 | 20.1 ± 1.4 |
| % kcal Carbohydrateb | 58.5 ± 2.9 | 66.3 ± 1.0* |
Data are means ± SEM, n=11. Each breakfast was individualized for the subject based on preferences, phe tolerance and energy requirements. Means with a * indicate GMP values are significantly different from AA values using paired t-test, pairing on subject.
Percent of calories from carbohydrate determined by subtraction.
The motivation-to-eat VAS profiles were not significantly different at any time point between the AA diet (Day 4) and the GMP diet (Day 8). However as expected, the appetite profile significantly changed before, immediately after and 2 hours after consuming either the AA or GMP breakfast (data not shown).
Protein intake was identified as the most common significant variable for the VAS questionnaires using the mixed effects statistical model. The protein content of breakfast showed a significant negative association with the appetite score immediately after breakfast (p=0.01) such that the appetite score decreased with greater protein intake at breakfast. In the final model for the appetite score immediately after breakfast, other significant factors in addition to protein content included BMI, age and the interaction between diet treatment and the day of the study. BMI significantly affected VAS answers at all time points in the mixed effects model analysis. A higher BMI was associated with a greater desire to eat, hunger, and appetite score and lower feelings of fullness.
3.2 Plasma AAs, insulin and ghrelin
The concentration of ghrelin in plasma obtained after an overnight fast was not significantly different between the AA and GMP diets (Figure 1) and there were no significant associations between fasting plasma ghrelin concentrations and a variety of variables. In particular, there was no direct association found between fasting ghrelin and BMI in this diverse sample population. The total concentration of AAs in fasting plasma was also not significantly different between the two diets (data not shown).
Figure 1.

Significant changes in plasma concentrations of ghrelin, insulin and amino acids were apparent with the GMP diet. Ghrelin and insulin values represent equal volumes of plasma combined for each subject from days 3+4 for the AA breakfast, days 7+8 for the GMP breakfast. Sum of postprandial (PP) plasma AA values on the last day of the AA diet (day 4) and last day of the GMP diet (day 8). All values are means ± SEM; n=6 for ghrelin fasting values.
* Indicates significantly different from postprandial ghrelin with AA breakfast (p=0.03, paired t-test, pairing on subject; n=10)
** Indicates moderately significant difference from insulin with the AA breakfast (p=0.053, paired t-test, pairing on subject; n=10)
*** Indicates significantly different from sum of plasma AAs with the AA breakfast (p=0.049, paired t-test, pairing on subject; n=11)
Postprandial plasma ghrelin concentration, taken 180 minutes following the start of the AA breakfast, was not different from fasting ghrelin prior to eating the AA breakfast (Figure 1). In contrast, the GMP breakfast induced significantly lower postprandial plasma ghrelin concentration, an expected response following a meal. In addition, postprandial ghrelin following the GMP breakfast was significantly lower than postprandial ghrelin following the AA breakfast. There were no significant associations between postprandial ghrelin concentrations and BMI. Using backward elimination with a linear mixed effects model, the only factor predicting postprandial ghrelin was diet treatment, in that postprandial plasma ghrelin was lower with the GMP breakfast. Postprandial plasma ghrelin concentration was a significant factor in the prediction of fullness 2 hr after breakfast (Figure 2). Higher fullness scores were significantly associated with lower postprandial ghrelin concentrations, diet treatment, and the interaction between ghrelin and diet.
Figure 2.
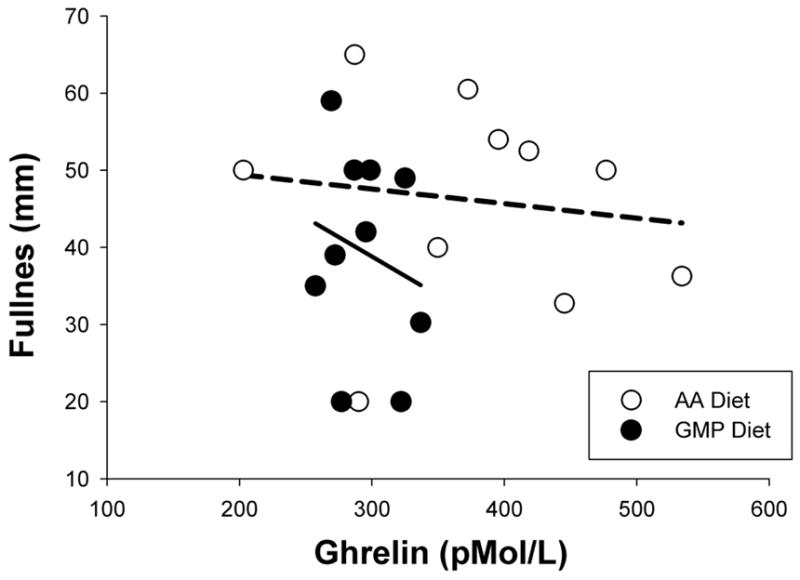
Relationship between plasma ghrelin concentrations 180 minutes after the start of breakfast and feeling of fullness 2 hr after breakfast. Lower postprandial ghrelin was associated with greater feeling of fullness. Lines represent least squares regression lines fitted to individual diet treatment data; AA breakfast is dashed line and GMP breakfast is solid line. Lines are significantly different. Using backward elimination with a mixed effects model, the best model predicting postprandial fullness scores included diet treatment, postprandial ghrelin and the interaction between ghrelin and diet treatment.
The postprandial plasma concentration of total AAs was significantly higher (p=0.049) and postprandial insulin concentration was higher and moderately significant with the GMP diet compared to the AA diet (p=0.053) (Figure 1). Complete plasma AA profiles have been reported previously [28] and Table 2 shows postprandial plasma concentrations of the essential AAs. Consistent with the composition of the GMP protein, postprandial concentrations of isoleucine and threonine were significantly higher following a GMP compared with an AA breakfast, and above the normal range. Fasting plasma concentration of isoleucine was within the normal range although the nontoxic AA threonine remained elevated approximately 20% above the normal range [28, 35].
Table 2.
Postprandial plasma concentrations of essential AAsa
| AA | AA Diet | GMP Diet | p-valueb |
|---|---|---|---|
| μMol/L ± SEM | |||
| Histidine | 82 ± 5 | 80 ± 6 | 0.64 |
| Isoleucine | 64 ± 8 | 144 ± 16 | 4.3E-05 |
| Leucine | 127 ± 17 | 97 ± 13 | 0.04 |
| Lysine | 189 ± 14 | 180 ± 15 | 0.31 |
| Methionine | 21 ± 2 | 29 ± 3 | 0.02 |
| Phenylalanine | 619 ± 82 | 676 ± 92 | 0.17 |
| Threonine | 135 ± 14 | 333 ± 27 | 8.6E-06 |
| Tryptophan | 47 ± 4 | 37 ± 2 | 0.03 |
| Tyrosine | 82 ± 7 | 66 ± 10 | 0.27 |
| Valine | 262 ± 18 | 295 ± 27 | 0.13 |
Values are means ± SEM; n=11. All values, with the exception of threonine and isoleucine on the GMP diet, are within the normal range
Difference between the last day of the AA diet (day 4) and the GMP diet (day 8) by paired t test, pairing on subject)
4. DISCUSSION
Individuals with PKU are advised to follow the low-phe PKU diet throughout the lifespan to achieve recommended plasma phe concentrations, metabolic control and improve long-term cognitive outcomes [3]. However, the PKU diet, with synthetic AAs as the primary source of protein, may have physiological impacts including persistent hunger, decreased bone mass [36], and increased risk of micronutrient deficiencies [1]. Furthermore, compliance with the PKU diet is a continual challenge [2, 4]; particularly the consumption of an AA-based formula and distribution of formula throughout the day. The absence of a protein source in a meal may result in increased feelings of hunger throughout the day. The improved taste and preference combined with the ability to make a variety of good tasting foods with GMP [29] supports the notion that GMP may improve the dietary management of PKU by providing a protein source that can be more easily spaced throughout the day. Moreover, we report for the first time that ingestion of intact protein from GMP compared with synthetic AAs results in sustained suppression of ghrelin following a meal in those with PKU.
Ghrelin is the only known orexigenic hormone, with highest concentrations in the fasted state and in anticipation of a meal, whereas concentrations are suppressed following a meal [24]. Schulpis et al [27] found that children (mean age 6–7 years) with PKU in poor metabolic control had lower fasting ghrelin and decreased plasma catecholamine concentration when compared to children with PKU with strict dietary control and low plasma phe; the physiologic response of ghrelin to ingestion of a meal was not assessed. We found no difference in fasting ghrelin concentration when comparing the AA and GMP breakfasts in 3 children (ages 11–14) and 8 adults with PKU who served as their own control. Although the findings of Schulpis et al in young children with PKU are interesting [27], our data provide novel information about the response of ghrelin to a meal.
We demonstrate that isocaloric breakfast treatments containing the intact protein GMP compared with synthetic AAs induce a different ghrelin response. Ghrelin levels decrease after a meal in proportion to caloric content [25] and protein and carbohydrate suppress ghrelin to a similar extent in studies with isocaloric substitution of 20% energy or greater from protein or carbohydrate [37–40]. Thus, the higher proportion of energy provided by carbohydrate in the GMP breakfast (7.8%) is unlikely to account for the differential ghrelin response observed in this study. Ghrelin concentration was only measured at two time points, fasting and 180 minutes after the start of breakfast, therefore the nadir was likely missed [24]. However, the observed significant decline in ghrelin concentrations between these two time points with the GMP breakfast, but not the AA, shows that the intake of an AA breakfast does not allow sustained suppression of ghrelin 180 minutes after breakfast. In fact, the ghrelin hunger signal 3 hours after the AA meal was no different than after a 12 hr fast.
Greater ghrelin suppression following a meal with intact protein compared to AAs may be due to variations in the rate of absorption of synthetic AAs compared with GMP. The appearance of AAs in plasma occurs within one hour following consumption of AAs and approximately 2 hours with consumption of a comparable intact protein [41, 42]. Fast absorption of AAs has been shown to negatively affect protein retention and utilization in rats and humans [42, 43]. Although the most significant consequence of long-term AA consumption may be reduced protein retention, the sharp rise of plasma AAs concentration also affects physiological signals of satiety. The aminostatic hypothesis proposes that an increase in plasma AA concentrations is accompanied by a greater stimulation of GI hormones [44] and decreased appetite followed by a return of appetite when plasma AA concentrations fall [45]. Thus, whey proteins, such as GMP, may decrease appetite due to rapid absorption and sustained levels of plasma AAs [11], whereas synthetic AAs cause an acute rise in plasma AAs which disappear from plasma faster and to a greater extent compared to intact protein, resulting in increased appetite shortly after a meal [41, 42]. Supportive of this hypothesis, a breakfast containing GMP induced higher total postprandial plasma AA and lower ghrelin concentrations compared with synthetic AAs. Moreover, our data show an association between lower postprandial ghrelin concentration and greater feelings of fullness suggesting that a GMP meal sustains satiety when compared with AAs.
Ghrelin suppression is regulated by postgastric feedback [46], requiring luminal nutrients in the distal intestine, not in the stomach or duodenum [37, 40]. The rapid rise of plasma AAs following consumption of an AA based formula suggests that luminal nutrients are present for a shorter time, therefore limiting their ability to suppress ghrelin. In addition, ghrelin works in a reciprocal manner with insulin [24]. Similarly, our results show that postprandial plasma insulin concentration is higher and ghrelin lower after a breakfast containing GMP compared with an AA-based breakfast. Weigel et al [47] found oral AAs given with macronutrients increased insulin concentration to a greater degree and gave a more stable ghrelin concentration than pure AAs in individuals with PKU. Moreover, whey proteins have been shown to be insulinotrophic [48]. Thus, GMP, an abundant whey protein, may improve insulin and ghrelin regulation, satiety signaling, and protein retention in individuals with PKU.
5. CONCLUSION
The nutritional management of PKU is in need of new dietary options besides synthetic AAs to facilitate ingestion of a low-phe source of protein throughout the day in order to improve metabolic control and control hunger. Our results confirm the importance of protein consumption in a meal to improve satiety, and provide novel evidence that a GMP breakfast suppresses plasma levels of the satiety hormone ghrelin for a longer period of time compared with an AA breakfast. Food products made with the intact, low-phe protein GMP are a first step to providing a more physiologically complete diet that improves dietary options, and facilitates protein distribution and metabolic control of PKU.
Acknowledgments
All funding for this research was provided by NIH grants R03-DK-071534 and P30-HD-03352; the USDA Cooperative State Research, Education and Extension Service, project WISO 1084, College of Agriculture and Life Sciences, University of Wisconsin-Madison; and grant 1UL1RR025011 from the Clinical and Translational Science Award Program of the National Center for Research Resources, the National Institutes of Health. The authors would like to thank Sally Gleason, MS RD for her assistance developing menus for subjects during the study, Dr. Gregory Rice for providing medical care to the subjects; Michael J Grahn for expert technical assistance; and finally, clients with PKU from the UW Biochemical Genetics Program who participated in this study.
List of abbreviations
- AA
amino acid
- BMI
body mass index
- GMP
glycomacropeptide
- PFC
prospective food consumption
- PKU
phenylketonuria
- phe
phenylalanine
- UW-CTRC
Clinical and Translational Research Core, University of Wisconsin Hospital and Clinics
- VAS
visual analog scale
Footnotes
Disclosure statement
All funding for this research was provided by NIH, the PKU community and the University of Wisconsin-Madison. A provisional patent application was filed 6/12/09, serial # 61/186690, title Glycomacropeptide (GMP) medical foods for nutritional management of phenylketonuria (PKU), and a license was executed by Cambrooke Foods, LLC on 3/8/10. A percentage of all royalty payments will be awarded to the inventors based on the license.
Publisher's Disclaimer: This is a PDF file of an unedited manuscript that has been accepted for publication. As a service to our customers we are providing this early version of the manuscript. The manuscript will undergo copyediting, typesetting, and review of the resulting proof before it is published in its final citable form. Please note that during the production process errors may be discovered which could affect the content, and all legal disclaimers that apply to the journal pertain.
Literature Cited
- 1.Donlon J, Levy H, Scriver C. Chapter 77: Hyperphenylalaninemia: Phenylalanine Hydroxylase Deficiency. In: Scriver C, Beaudet A, Sly W, Valle D, editors. Metabolic and Molecular Basis of Inherited Disease. McGraw-Hill; 2007. [Google Scholar]
- 2.Koch R, Burton B, Hoganson G, Peterson R, Rhead W, Rouse B, Scott R, Wolff J, Stern AM, Guttler F, Nelson M, de la Cruz F, Coldwell J, Erbe R, Geraghty MT, Shear C, Thomas J, Azen C. Phenylketonuria in adulthood: a collaborative study. J Inherit Metab Dis. 2002;25:333–46. doi: 10.1023/a:1020158631102. [DOI] [PubMed] [Google Scholar]
- 3.NIH. Phenylketonuria (PKU): screening and management. NIH Consensus Statement. 2000;17:1–33. [PubMed] [Google Scholar]
- 4.van Spronsen FJ, Ahring KK, Gizewska M. PKU-what is daily practice in various centres in Europe? Data from a questionnaire by the scientific advisory committee of the European Society of Phenylketonuria and Allied Disorders. J Inherit Metab Dis. 2009;32:58–64. doi: 10.1007/s10545-008-0966-y. [DOI] [PubMed] [Google Scholar]
- 5.MacDonald A, Rylance G, Davies P, Asplin D, Hall SK, Booth IW. Administration of protein substitute and quality of control in phenylketonuria: a randomized study. J Inherit Metab Dis. 2003;26:319–26. doi: 10.1023/a:1025186217369. [DOI] [PubMed] [Google Scholar]
- 6.Monch E, Herrmann ME, Brosicke H, Schoffer A, Keller M. Utilisation of amino acid mixtures in adolescents with phenylketonuria. Eur J Pediatr. 1996;155(Suppl 1):S115–20. doi: 10.1007/pl00014226. [DOI] [PubMed] [Google Scholar]
- 7.Weigle DS, Breen PA, Matthys CC, Callahan HS, Meeuws KE, Burden VR, Purnell JQ. A high-protein diet induces sustained reductions in appetite, ad libitum caloric intake, and body weight despite compensatory changes in diurnal plasma leptin and ghrelin concentrations. Am J Clin Nutr. 2005;82:41–8. doi: 10.1093/ajcn.82.1.41. [DOI] [PubMed] [Google Scholar]
- 8.Westerterp-Plantenga MS, Rolland V, Wilson SA, Westerterp KR. Satiety related to 24 h diet-induced thermogenesis during high protein/carbohydrate vs high fat diets measured in a respiration chamber. Eur J Clin Nutr. 1999;53:495–502. doi: 10.1038/sj.ejcn.1600782. [DOI] [PubMed] [Google Scholar]
- 9.Millward DJ, Layman DK, Tome D, Schaafsma G. Protein quality assessment: impact of expanding understanding of protein and amino acid needs for optimal health. Am J Clin Nutr. 2008;87:1576S–1581S. doi: 10.1093/ajcn/87.5.1576S. [DOI] [PubMed] [Google Scholar]
- 10.Veldhorst MA, Nieuwenhuizen AG, Hochstenbach-Waelen A, van Vught AJ, Westerterp KR, Engelen MP, Brummer RJ, Deutz NE, Westerterp-Plantenga MS. Dose-dependent satiating effect of whey relative to casein or soy. Physiol Behav. 2009;96:675–82. doi: 10.1016/j.physbeh.2009.01.004. [DOI] [PubMed] [Google Scholar]
- 11.Hall WL, Millward DJ, Long SJ, Morgan LM. Casein and whey exert different effects on plasma amino acid profiles, gastrointestinal hormone secretion and appetite. Br J Nutr. 2003;89:239–48. doi: 10.1079/BJN2002760. [DOI] [PubMed] [Google Scholar]
- 12.Anderson GH, Tecimer SN, Shah D, Zafar TA. Protein source, quantity, and time of consumption determine the effect of proteins on short-term food intake in young men. J Nutr. 2004;134:3011–5. doi: 10.1093/jn/134.11.3011. [DOI] [PubMed] [Google Scholar]
- 13.Etzel MR. Manufacture and use of dairy protein fractions. J Nutr. 2004;134:996S–1002S. doi: 10.1093/jn/134.4.996S. [DOI] [PubMed] [Google Scholar]
- 14.Matalon R, Michals-Matalon K, Bhatia G, Burlina AB, Burlina AP, Braga C, Fiori L, Giovannini M, Grechanina E, Novikov P, Grady J, Tyring SK, Guttler F. Double blind placebo control trial of large neutral amino acids in treatment of PKU: effect on blood phenylalanine. J Inherit Metab Dis. 2007;30:153–8. doi: 10.1007/s10545-007-0556-4. [DOI] [PubMed] [Google Scholar]
- 15.Luhovyy BL, Akhavan T, Anderson GH. Whey proteins in the regulation of food intake and satiety. J Am Coll Nutr. 2007;26:704S–12S. doi: 10.1080/07315724.2007.10719651. [DOI] [PubMed] [Google Scholar]
- 16.Brody EP. Biological activities of bovine glycomacropeptide. Br J Nutr. 2000;84(Suppl 1):S39–46. doi: 10.1017/s0007114500002233. [DOI] [PubMed] [Google Scholar]
- 17.Burton-Freeman BM. Glycomacropeptide (GMP) is not critical to whey-induced satiety, but may have a unique role in energy intake regulation through cholecystokinin (CCK) Physiol Behav. 2008;93:379–87. doi: 10.1016/j.physbeh.2007.09.010. [DOI] [PubMed] [Google Scholar]
- 18.Lam SM, Moughan PJ, Awati A, Morton HR. The influence of whey protein and glycomacropeptide on satiety in adult humans. Physiol Behav. 2009;96:162–8. doi: 10.1016/j.physbeh.2008.09.022. [DOI] [PubMed] [Google Scholar]
- 19.Gustafson DR, McMahon DJ, Morrey J, Nan R. Appetite is not influenced by a unique milk peptide: caseinomacropeptide (CMP) Appetite. 2001;36:157–63. doi: 10.1006/appe.2000.0392. [DOI] [PubMed] [Google Scholar]
- 20.Keogh JB, Clifton P. The effect of meal replacements high in glycomacropeptide on weight loss and markers of cardiovascular disease risk. Am J Clin Nutr. 2008;87:1602–5. doi: 10.1093/ajcn/87.6.1602. [DOI] [PubMed] [Google Scholar]
- 21.Veldhorst MA, Nieuwenhuizen AG, Hochstenbach-Waelen A, Westerterp KR, Engelen MP, Brummer RJ, Deutz NE, Westerterp-Plantenga MS. Effects of complete whey-protein breakfasts versus whey without GMP-breakfasts on energy intake and satiety. Appetite. 2009;52:388–95. doi: 10.1016/j.appet.2008.11.014. [DOI] [PubMed] [Google Scholar]
- 22.Strader AD, Woods SC. Gastrointestinal hormones and food intake. Gastroenterology. 2005;128:175–91. doi: 10.1053/j.gastro.2004.10.043. [DOI] [PubMed] [Google Scholar]
- 23.Lee HM, Wang G, Englander EW, Kojima M, Greeley GH., Jr Ghrelin, a new gastrointestinal endocrine peptide that stimulates insulin secretion: enteric distribution, ontogeny, influence of endocrine, and dietary manipulations. Endocrinology. 2002;143:185–90. doi: 10.1210/endo.143.1.8602. [DOI] [PubMed] [Google Scholar]
- 24.Cummings DE, Purnell JQ, Frayo RS, Schmidova K, Wisse BE, Weigle DS. A preprandial rise in plasma ghrelin levels suggests a role in meal initiation in humans. Diabetes. 2001;50:1714–9. doi: 10.2337/diabetes.50.8.1714. [DOI] [PubMed] [Google Scholar]
- 25.Callahan HS, Cummings DE, Pepe MS, Breen PA, Matthys CC, Weigle DS. Postprandial suppression of plasma ghrelin level is proportional to ingested caloric load but does not predict intermeal interval in humans. J Clin Endocrinol Metab. 2004;89:1319–24. doi: 10.1210/jc.2003-031267. [DOI] [PubMed] [Google Scholar]
- 26.Cummings DE, Weigle DS, Frayo RS, Breen PA, Ma MK, Dellinger EP, Purnell JQ. Plasma ghrelin levels after diet-induced weight loss or gastric bypass surgery. N Engl J Med. 2002;346:1623–30. doi: 10.1056/NEJMoa012908. [DOI] [PubMed] [Google Scholar]
- 27.Schulpis KH, Papassotiriou I, Vounatsou M, Karikas GA, Tsakiris S, Chrousos GP. Morning preprandial plasma ghrelin and catecholamine concentrations in patients with phenylketonuria and normal controls: evidence for catecholamine-mediated ghrelin regulation. J Clin Endocrinol Metab. 2004;89:3983–7. doi: 10.1210/jc.2004-0311. [DOI] [PubMed] [Google Scholar]
- 28.van Calcar SC, MacLeod EL, Gleason ST, Etzel MR, Clayton MK, Wolff JA, Ney DM. Improved nutritional management of phenylketonuria by using a diet containing glycomacropeptide compared with amino acids. Am J Clin Nutr. 2009;89:1068–77. doi: 10.3945/ajcn.2008.27280. [DOI] [PMC free article] [PubMed] [Google Scholar]
- 29.Ney DM, Gleason ST, van Calcar SC, MacLeod EL, Nelson KL, Etzel MR, Rice GM, Wolff JA. Nutritional management of PKU with glycomacropeptide from cheese whey. J Inherit Metab Dis. 2009;32:32–9. doi: 10.1007/s10545-008-0952-4. [DOI] [PMC free article] [PubMed] [Google Scholar]
- 30.Lim K, van Calcar SC, Nelson KL, Gleason ST, Ney DM. Acceptable low-phenylalanine foods and beverages can be made with glycomacropeptide from cheese whey for individuals with PKU. Mol Genet Metab. 2007;92:176–8. doi: 10.1016/j.ymgme.2007.06.004. [DOI] [PMC free article] [PubMed] [Google Scholar]
- 31.Laclair CE, Ney DM, MacLeod EL, Etzel MR. Purification and use of glycomacropeptide for nutritional management of phenylketonuria. J Food Sci. 2009;74:E199–206. doi: 10.1111/j.1750-3841.2009.01134.x. [DOI] [PMC free article] [PubMed] [Google Scholar]
- 32.Slocum RH, Cummings JG. Amino acid analysis of physiological samples. In: HFA, editor. Techniques in diagnostic human biochemical genetics: a laborator manual. Wiley-Liss; New York, NY: 1991. pp. 87–126. [Google Scholar]
- 33.Stubbs RJ, Hughes DA, Johnstone AM, Rowley E, Reid C, Elia M, Stratton R, Delargy H, King N, Blundell JE. The use of visual analogue scales to assess motivation to eat in human subjects: a review of their reliability and validity with an evaluation of new hand-held computerized systems for temporal tracking of appetite ratings. Br J Nutr. 2000;84:405–15. doi: 10.1017/s0007114500001719. [DOI] [PubMed] [Google Scholar]
- 34.Anderson GH, Catherine NL, Woodend DM, Wolever TM. Inverse association between the effect of carbohydrates on blood glucose and subsequent short-term food intake in young men. Am J Clin Nutr. 2002;76:1023–30. doi: 10.1093/ajcn/76.5.1023. [DOI] [PubMed] [Google Scholar]
- 35.Darling PB, Grunow J, Rafii M, Brookes S, Ball RO, Pencharz PB. Threonine dehydrogenase is a minor degradative pathway of threonine catabolism in adult humans. Am J Physiol Endocrinol Metab. 2000;278:E877–84. doi: 10.1152/ajpendo.2000.278.5.E877. [DOI] [PubMed] [Google Scholar]
- 36.Modan-Moses D, Vered I, Schwartz G, Anikster Y, Abraham S, Segev R, Efrati O. Peak bone mass in patients with phenylketonuria. J Inherit Metab Dis. 2007;30:202–8. doi: 10.1007/s10545-007-0462-9. [DOI] [PubMed] [Google Scholar]
- 37.Cummings DE. Ghrelin and the short- and long-term regulation of appetite and body weight. Physiol Behav. 2006;89:71–84. doi: 10.1016/j.physbeh.2006.05.022. [DOI] [PubMed] [Google Scholar]
- 38.Foster-Schubert KE, Overduin J, Prudom CE, Liu J, Callahan HS, Gaylinn BD, Thorner MO, Cummings DE. Acyl and total ghrelin are suppressed strongly by ingested proteins, weakly by lipids, and biphasically by carbohydrates. J Clin Endocrinol Metab. 2008;93:1971–9. doi: 10.1210/jc.2007-2289. [DOI] [PMC free article] [PubMed] [Google Scholar]
- 39.Lejeune MP, Westerterp KR, Adam TC, Luscombe-Marsh ND, Westerterp-Plantenga MS. Ghrelin and glucagon-like peptide 1 concentrations, 24-h satiety, and energy and substrate metabolism during a high-protein diet and measured in a respiration chamber. Am J Clin Nutr. 2006;83:89–94. doi: 10.1093/ajcn/83.1.89. [DOI] [PubMed] [Google Scholar]
- 40.Overduin J, Frayo RS, Grill HJ, Kaplan JM, Cummings DE. Role of the duodenum and macronutrient type in ghrelin regulation. Endocrinology. 2005;146:845–50. doi: 10.1210/en.2004-0609. [DOI] [PubMed] [Google Scholar]
- 41.Gropper SS, Acosta PB. Effect of simultaneous ingestion of L-amino acids and whole protein on plasma amino acid and urea nitrogen concentrations in humans. JPEN J Parenter Enteral Nutr. 1991;15:48–53. doi: 10.1177/014860719101500148. [DOI] [PubMed] [Google Scholar]
- 42.Deglaire A, Fromentin C, Fouillet H, Airinei G, Gaudichon C, Boutry C, Benamouzig R, Moughan PJ, Tome D, Bos C. Hydrolyzed dietary casein as compared with the intact protein reduces postprandial peripheral, but not whole-body, uptake of nitrogen in humans. Am J Clin Nutr. 2009;90:1011–22. doi: 10.3945/ajcn.2009.27548. [DOI] [PubMed] [Google Scholar]
- 43.Daenzer M, Petzke KJ, Bequette BJ, Metges CC. Whole-body nitrogen and splanchnic amino acid metabolism differ in rats fed mixed diets containing casein or its corresponding amino acid mixture. J Nutr. 2001;131:1965–72. doi: 10.1093/jn/131.7.1965. [DOI] [PubMed] [Google Scholar]
- 44.Tome D, Schwarz J, Darcel N, Fromentin G. Protein, amino acids, vagus nerve signaling, and the brain. Am J Clin Nutr. 2009;90:838S–843S. doi: 10.3945/ajcn.2009.27462W. [DOI] [PubMed] [Google Scholar]
- 45.Mellinkoff SM, Frankland M, Boyle D, Greipel M. Relationship between serum amino acid concentration and fluctuations in appetite. 1956. Obes Res. 1997;5:381–4. doi: 10.1002/j.1550-8528.1997.tb00568.x. [DOI] [PubMed] [Google Scholar]
- 46.Williams DL, Cummings DE, Grill HJ, Kaplan JM. Meal-related ghrelin suppression requires postgastric feedback. Endocrinology. 2003;144:2765–7. doi: 10.1210/en.2003-0381. [DOI] [PubMed] [Google Scholar]
- 47.Weigel C, Rauh M, Kiener C, Rascher W, Knerr I. Effects of various dietary amino acid preparations for phenylketonuric patients on the metabolic profiles along with postprandial insulin and ghrelin responses. Ann Nutr Metab. 2007;51:352–8. doi: 10.1159/000107678. [DOI] [PubMed] [Google Scholar]
- 48.Schmid R, Schulte-Frohlinde E, Schusdziarra V, Neubauer J, Stegmann M, Maier V, Classen M. Contribution of postprandial amino acid levels to stimulation of insulin, glucagon, and pancreatic polypeptide in humans. Pancreas. 1992;7:698–704. doi: 10.1097/00006676-199211000-00011. [DOI] [PubMed] [Google Scholar]