Abstract
We have previously shown that adenoviral-mediated interferon α (Ad-IFNα) treatment is highly cytotoxic to tumor cells which are resistant to the interferon α̣ protein. We now report that autophagy is produced after Ad-IFNα treatment of either interferon resistant bladder cancer cells (UC-9 and KU7) or the normal urothelial cell line (TERT-NHUC). After Ad-IFNα infection autophagesomes, an early stage of autophagy, were seen in cancer cells whereas autophagolysosomes, a later stage of autophagy, were observed mostly in normal cells by electron microscopy. Conditioned medium from either normal or bladder cancer cells, however, produced no autophagy when placed on the bladder cancer cells, although again marked cytotoxicity was observed. This indicated that the autophagy seen was related to the direct effect of Ad-IFNα transfection and expression rather than to the bystander factors produced. In addition, autophagic changes were seen using LysoTracker Red DND99 in both normal and cancer cells. We also documented that Ad-IFNα treatment produces the autophagic protein form, LC3-II, in cancer cells but not normal cells, which in turn was inhibited by the autophagic inhibitor, 3-methyladenine (3-MA). This inhibition of autophagy resulted in a significant increase in apoptotic cell death as measured by the sub-G1 population. We hypothesize that the autophagy seen in normal urothelial cells is a protective response and is allowed to be completed, providing a survival mechanism following Ad-IFN treatment, whereas the autophagy produced in interferon resistant cancer cells is not allowed to be completed and is insufficient to significantly suppress cytotoxicity.
Keywords: Adenoviral-mediated interferon α, autophagy, normal bladder and cancer cells, bystander effects
Introduction
Our laboratory has shown that adenoviral-mediated interferon α (Ad-IFNα) is highly cytotoxic to tumor cells resistant to the interferon α protein. Ad-IFNα also produces a strong bystander effect in cancer cells, which in turn can be seen in conditioned medium from either normal and cancer cells, but is not cytotoxic to normal urothelial cells (1-4). In addition, intravesical Ad-IFNα is presently being used in a Phase l trial for BCG resistant superficial bladder cancer.
It order to better understand possible mechanisms by which normal urothelial cells are spared from the cytotoxic effects observed in cancer cells, we decided to investigate the role of autophagy in protecting the normal cells. Indeed, we found that the differences in the degree and stages of autophagy produced in normal versus cancer cells were related to the direct effect of Ad-IFNα transfection and expression, whereas no autophagy was observed in either cell type as a result of the bystander factors. These results in turn may provide at least one mechanism to allow cell survival for normal urothelial cells following Ad-IFNα treatment.
Materials and Methods
Cell lines
The bladder cancer cell lines, UM-UC9 bladder and KU7 cells were grown using MEM in 10% fetal bovine serum, supplemented with penicillin and streptomycin, and incubated at 37°C in 5% CO2 and 95% air. The normal urothelial cell line (TERT-NHUC), provided by Dr. Margaret Knowles, was grown in K-SFM medium containing BPE and EGF and cholera toxins as supplements (4). Cells were infected with a 100 MOI of Ad-IFN-α or Ad-β-gal, which were both obtained from the Schering-Plough Research Institute (Kenilworth, NJ USA). The infection procedure was done as previously described [2]. The cells were exposed to the adenoviral vector for 3 hours in medium without serum. The virus was then removed and complete control medium added. Transfection frequency was checked by immunostaining in order to assure that the different experiments were comparable. The autophagy inhibitor 3-Methyladenine (3-MA) was purchased from Sigma-Aldrich (St Louis, MO). After Ad-IFN-α infection, the tumor cells or normal cells were cultured with growth medium containing or not containing 2mM to 5mM 3-MA.
Western blotting
Western blotting was done to measure LC3-II. The cultured cells were lysed in cold lysis buffer (1% Triton X-100, 1mM EDTA, 150mM NaCl, 50 mM Tris-HCl, 0.2 mMNa2VO4, and 10mg/ml each of leupeptin, phenylmethylsulfonyl fluoride, and apotine) (Roche Molecular Biochemical, Indianapolis,IN) and the soluble proteins isolated as described previously. Protein concentrations were estimated by the Pierce protein assay (Thermo, Rockford IL). Fifty μg of each protein sample were separated by 4-20% SDS-PAGE and transferred to low fluorescence PVDF membrane (Thermo, Rockford, IL). The membrane was then blotted by using a rabbit polyclonal anti-microtubule-associated protein 1 light chain 3 (LC3) antibody purchased from MBL (Woburn, MA). Bound antibody was detected using the enhanced Pierce Daco/ Pico detection kit (Thermo, Rockford, IL).
Transmission electron microscope and immunochemical analysis
Cells were grown on six–well culture dishes for each time point. They were then were washed with PBS to remove unbound protein and fixed with 2% paraformaldehyde and 3% glutaraldehyde in 1% sodium cacodylate buffer, pH 7.3, for 1 hr at room temperature. Other cells were fixed and stained for interferon protein as previously described (1). Samples were then infiltrated, embedded in Spurr's low-viscosity medium, and allowed to polymerize in a 60°C oven for two days. Glass coverslips were removed by dipping the blocks in liquid nitrogen. Ultra thin sections were cut with an LKB Ultracut microtome (Leica, Deerfield, IL), stained with uranyl acetate and lead citrate in an LKB Ultrastainer, and examined in a JEM-1010 transmission electron microscope at an acceleration voltage of 80 KV. Digital images were obtained using an AMT Imaging System (Advanced Microscopy Techniques Corp, Danvers, MA).
Generation of conditioned medium (CM) and CM treatment
The UC9 and KU7 bladder cancer and TERT-NHU cells were plated into 100-mm dishes at 1×10⁶ cells/ dish. After Ad-IFNα infection as outlined above, the medium was harvested from the Ad-IFNα infected dishes at various times after treatment, filtered through a 0.22 μm filter and were then termed either UC9 or KU7-CM-AdIFN. The medium harvested from the non-infected control cells were termed UC9-CM-control. All of the conditioned media were then aliquoted and stored at -80°C. CM was used in treatment of normal or tumor cells by adding 1 part CM to 4 part growth medium for a final 1:5 dilution.
Cell cycle analysis
The tumor cells and normal urothelial cells were plated into 100-mm dishes at 1×10⁶ cells/dish or into 60-mm dishes at 1×10⁵ before infection. After Ad-IFN infection, the cells were cultured with or without the autophagy inhibitor 3-MA, the control and treated cells were harvested with trypsin-EDTA and washed in 1 ml of cold PBS. The cells were suspended in 1.0 ml of propidium iodide solution (50 mg/ml propidium iodide, 0.1% Triton X-100, and 0.1% sodium citrate in PBS). Cells were then incubated at 4°C for 2 h in the dark, and then the fluorescence was read on a FACSCanto II cytometer(BD, Brea, CA). The results were analyzed with Diva (BD, Brea, CA) and FlowJo (Ishland, OR).
Quantification of Acidic organelles
Autophagy was measured by the development of acidic vesicular organelle staining with LysoTracker Red DND-99 (Invitrogen, Carlsbad, CA). The tumor cells and normal urothelial cells were plated into 100-mm dishes at 1-2×10⁶ cells/dish and infected with Ad-IFNα. Before harvesting, the medium was removed and re-fed with medium containing 75ng/ml of LysoTracker Red DND-99, and incubated at 37°C 5% CO2 for 15 minutes. Finally, the control and treated cells were harvested with trypsin-EDTA and washed in 1 ml of cold PBS. The stained cells were analyzed by flow cytometry using the FACSCanto II cytometer (BD, Brea, CA).
Statistical Analysis
Sub-G1 results were expressed as the mean ± standard error of the mean. Each treatment was assayed three times and the analysis was done using the Descriptive Statistics Module of the Statistica software (StatSoft, Inc., Tulsa, OK). Flow cytometry results were analyzed with the Diva (BD, Brea, CA) and FlowJo (Ishland, OR) software.
Results and Discussion
Direct Ad-IFNα infection induces different stages of autophagy in interferon resistant bladder tumor cells and normal urothelial cells as analyzed by electron microscopy whereas Ad-IFNα produced bystander factors do not
Ad-IFNα produces marked cytotoxicity to cancer cells which are resistant to the IFN protein itself (1). An example is shown in Fig.1B where floating apoptotic cells are readily seen. In addition many of the cells remaining on the dish show marked perinuclear IFN staining (Fig.1B, insert). These reflect cells which are killed by the direct transfection and expression of Ad-IFNα. Other cells are killed by Ad-IFN-α via bystander factors following treatment with Ad-IFNα as can be shown by culture of conditioned medium from either normal or cancer cells after Ad-IFNα exposure which no longer contains Ad-IFNα particles (3). An example of this cytotoxicity is shown in Fig.1C. Since all this type of cancer cell death is produced by bystander factors and not from Ad-IFNα transfection and expression, no cells show IFN intracellular staining such as seen in Fig. 1B. In contrast Ad-IFNα produces no cytotoxicity in normal urothelial cells (Fig.1F), although these cells are readily transfected with Ad-IFNα and show similar IFN perinuclear staining as seen after transfection of cancer cells (Fig.1F, insert). Ad-β-gal also showed no cytotoxicity when used as an adenoviral-mediated control (Fig.1D).
Fig.1.
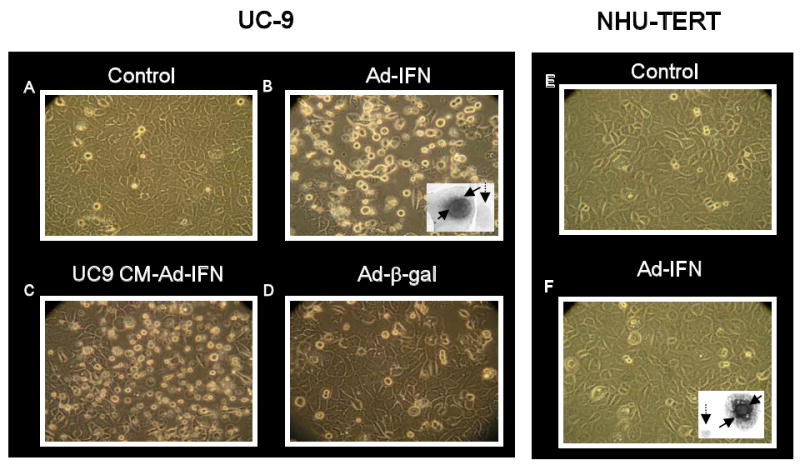
Ad-IFNα is cytotoxic to UC-9 bladder cancer cells but not normal urothelial cells (NHU-TERT). A-D. Many floating cells are seen 48 hr after Ad-IFNα treatment of UC-9 cells (B) as well as 48 hr after exposure to conditioned medium obtained following treatment with Ad-IFNα (C). The latter cell death represents a bystander effect. Insert in B illustrates a cell transfected with Ad-IFNα and expressing the interferon α protein (solid arrows) next to a cell which was not transfected (dotted arrow). Normal urothelial cells showed no cytotoxicity following treatment with Ad-IFNα (F) although numerous cells showed strong perinuclear interferon staining in many cells (insert, solid arrows) indicating these cells are readily transfected with Ad-IFNα. The dotted arrow indicates an untransfected cell.
When the cancer cells were examined by electron microscopy (EM) following Ad-IFNα treatment, early autophagy was observed as indicated by the presence of numerous autophagosomes. In contrast little evidence for Ad-IFNα induced late stage autophagy or the presence of autophagolysosome was seen (Fig.2B). In addition, no significant evidence of autophagy was found when conditioned medium produced from Ad-IFNα treated interferon resistant UC-9 cancer cells was incubated with UC-9 cells (Fig.2C) although marked cytotoxicity was observed (Fig.1C). This provided the first evidence that little or no autophagy occurs during bystander-produced cell kill. In contrast, Ad-IFNα treated normal urothelial cells contained mostly latter stage autophagic changes, namely autophagolysosomes (Fig.2F). Ad-β-gal treated cancer cells (Fig.2D) as well as normal cells contained little evidence of autophagy at the EM level.
Fig.2.
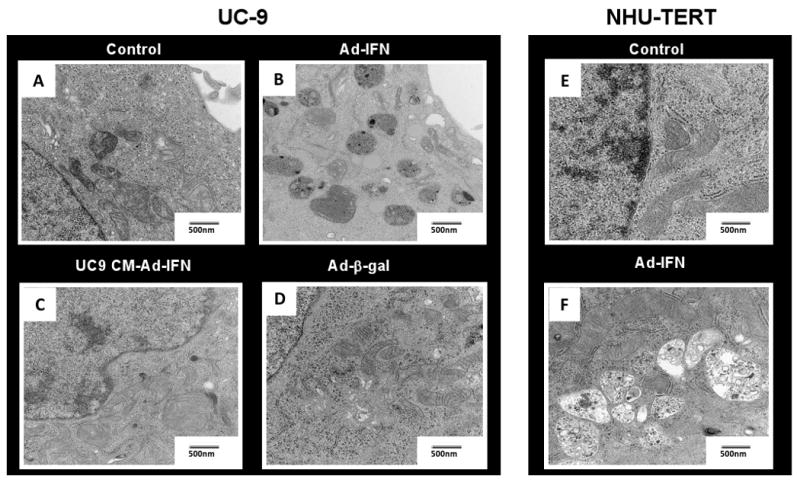
Ad-IFNα, but not bystander factors, can induce autophagy in both UC9 and NHU-TERT cells as examined by electron microscopy. The UC9 cancer cells contain mainly autophagosome (B) whereas mostly autophagolysosomes are seen in the NHU-TERT cells (F) 48 hr after Ad-IFNα treatment. No or little autophagy was observed, however, in UC-9 treated with UC-9 conditioned medium under conditions which produced significant cytotoxcity as shown in Fig. 1C or following treatment with Adβ-gal.
Autophagic changes occur in acidic vesicular organelles following treatment with Ad-IFNα but not by bystander products
The burden of an increased autophagic influx will tend to stimulate lysosomal proton pumping, thus establishing a correlation between autophagic activity and overall lysosomal acidity. Weakly basic amines selectively accumulate in cellular compartments with low internal pH and can be used to investigate the biosynthesis and pathogenesis of lysosomes. Among a number of fluorescent acidotropic dyes which are available for staining of lysosomes on the basis of acidity, LysoTracker Red DND-99 is often used. These dyes are able to cross the lysosomal membrane as uncharged molecules, but become protonated and trapped in the acidic interior of the lysosome. The intensity of lysosomal staining, detected by fluorescence microscopy or flow cytometry is roughly proportional to lysosomal acidity. Because the general increase in lysosomal acidity accompanying increased autophagy will increase the intensity of fluorescent dye, quantification can be performed by counting the number of detectable lysosomes per cell as well as by measuring the overall fluorescence intensity. The ability to induce autophagy in both normal and KU7 cancer cells following Ad-IFNα could therefore readily be shown by measuring Lysotracker DND intensity (Fig.3A and B, respectively), whereas no change was seen when conditioned medium from Ad-IFNα treated KU7 cancer cells was incubated with the KU7 cells (Fig.3C).
Fig.3.
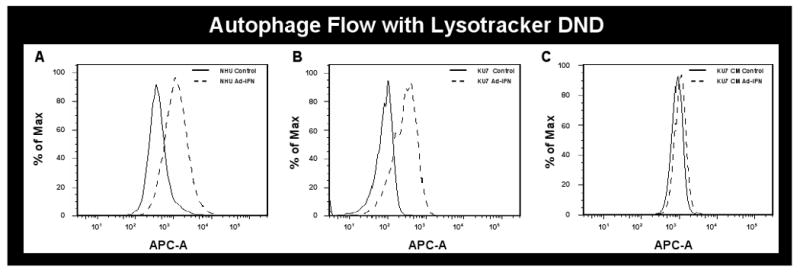
Autophagy is produced as measured with LysoTracker Red DND-99 and flow cytometry. Ad-IFNα infected cells were labeled with DND and analyzed on channel APC-A. Representative histograms are displayed. Data overlay was done by FlowJO. On the y axis is the % Max (the cell count in each bin divided by the cell count in the bin that contained the largest number of cells), and the x axis is the fluorescence intensity in log scale. Both normal and KU7 cancer cells show a shift to the right after Ad-IFNα treatment as a measure of autophagy (A and B, respectively) whereas none is seen in the KU7 cells exposed to conditioned medium obtained 72hr after KU7 cell exposure to Ad-IFNα (KU7 CM-Ad-IFNα) compared to cells treated with KU7 conditioned medium from untreated cells at the same time point (KU7 CM-control).
LC3-II autophagic forms are seen in Ad-IFNα treated cancer cells but not in normal cells
LC3-modification is essential for the dynamic process of autophagosome formation. During translation, Pro-LC3 is cleaved in the carboxyl terminal region, generating a soluble form, LC3-I, which is later modified to a membrane-bound form, LC3-II. LC3-II is localized to pre-autophagosomes and autophagosomes, making it an autophagosomal marker. Following the fusion of the autophagosome with the lysosome, intra-autophagosomal LC3-II is degraded by lysosomal hydrolytic enzymes. Both the LC3-I and LC3-II are detected as two bands following SDS-PAGE and immunoblotting (5). After Ad-IFNα infection, LC3-II conversion was observed in the UC-9 cancer cells but was not seen in the normal NHU cells, although an increase in LC3-I was found in the normal cells after Ad-IFNα treatment (Fig.4). In addition the LC3-II increase could be blocked in the UC-9 cancer cells by the addition of the autophagy inhibitor, 3-MA (Fig.4). A possible reason for lack of LC3-II in Ad-IFN-α infected normal cells is that LC3-II itself could have been completely degraded and recycled during late autophagy within the autophagolysosomes, which are the primary components in normal cells, whereas autophagy is not allowed to go to completion in the cancer cells, where primarily autophagosomes are observed. This possibility is consistent with the EM observations (Fig.2). In our view, the high level of LC3-II in Ad-IFN-α infected cancer cells not only reflects that autophagy has been induced, but that the process of autophagy is not allowed to continue to completion unlike that seen in normal NHU cells.
Fig.4.
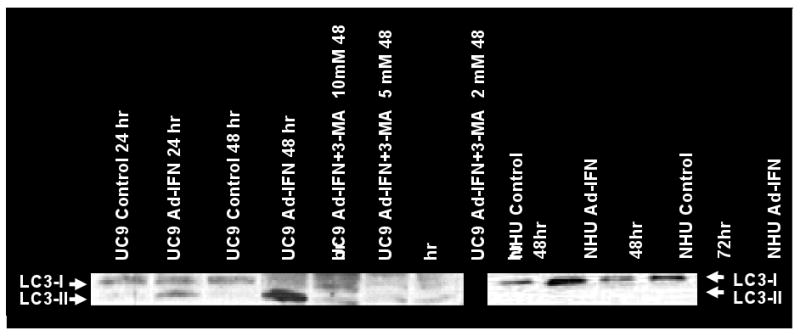
LC3-II autophagic forms are produced by Ad-IFNα in cancer cells but not in normal cells which can be inhibited by the autophagy inhibitor, 3-MA. Increases in the LC3-II autophagic forms were seen over time in Ad-IFNα- treated UC-9 cancer cells which could be blocked by exposure of various doses of 3-MA. In contrast no LC3-II was seen in Ad-IFNα treated normal human urothelial cells.
The autophagy inhibitor 3-MA produces increased apoptosis in cancer cells measuring by the sub-G1 fraction
We have proven that Ad-IFN-α induces apoptosis in interferon resistant cancer cells as measured by an increase in the sub-G1 population in cancer cells (1-3). We now find that the addition of the autophagy inhibitor, 3-MA, increases the subG1 population in both UC9 and KU7 (Fig.5). This result suggests that autophagy also has a protective effect in those cancer cells which are transfected with Ad-IFNα and express interferon α (Fig.1B, insert). However, as mentioned above, this autophagic process does not proceed to completion in the cancer cells, resulting in marked cytotoxicity. In contrast, Ad-IFNα induced autophagy in normal cells provides a more protective effect.
Fig.5.
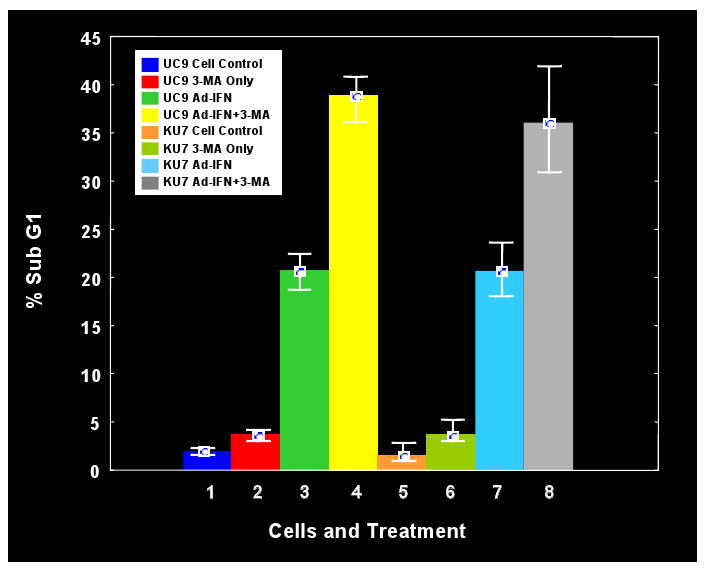
Inhibition of autophagy with the autophagy inhibitor, 3-MA, increases apoptosis in cancer cells as measured by the sub-G1 population. Both Ad-IFNα treated UC-9 and KU7 cells showed significant increases in the subG1 population in the presence of 3-MA exposure.
A Phase 1 study using intravesical treatment of Ad-IFNα for recurrent BCG refractory superficial bladder cancer is nearing completion and the initial results have been presented (6). Almost 50% of the patients treated obtained a complete remission. Except for initial urinary urgency, which could be controlled with prior anticholinergic medication, no other side effects on the bladder were observed. High urine IFNα levels were obtained in this study indicating that significant Ad-IFNα transfection and expression had occurred in the normal urothelium as well as a portion of the cancer cells present. The lack of apparent toxicity of Ad-IFNα to the patient's urothelium may have reflected' in part, the completion of the autophagic process we have reported here in normal urothelial cells. By analogy the incomplete autophagic process in cancer cells may be may be responsible for the insufficient protection of cancer cells from cell death following the direct transfection and expression of Ad-IFNα. Moreover, the bystander effects following Ad-IFNα treatment that cause cell death in cancer cells (3,4) are apparently devoid of any autophagic protection. This mechanism of Ad-IFNα produced cancer cell kill is particularly potent, especially in cancer cells which are resistant to the cytotoxic effects of the interferon α protein itself (3,4).
Acknowledgments
Supported by a GU SPORE in Bladder Cancer (P50 CA91846) Project 5 to WFB and Institutional Core Grant #CA166772
References
- 1.Benedict WF, Tao Z, Kim CS, Zhang X, Zhou JH, Adam L, et al. Intravesical Ad-IFNα causes marked regression of human bladder cancer growing orthotopically in nude mice and overcomes resistance to IFNα protein. Mol Ther. 2004;10:525–532. doi: 10.1016/j.ymthe.2004.05.027. [DOI] [PubMed] [Google Scholar]
- 2.Zhang XQ, Yang Z, Dong L, Papageorgiou A, McConkey D, Benedict WF. Adenoviral-mediated interferon α overcomes resistance to the interferon protein in various cancer types and has marked bystander effects. Cancer Gene Ther. 2007;14:241–250. doi: 10.1038/sj.cgt.7701011. [DOI] [PubMed] [Google Scholar]
- 3.Zhang XQ, Dong L, Chapman E, Benedict WF. Conditioned medium from Ad-IFNα infected bladder cancer and normal urothelial cells is cytotoxic to cancer cells but not normal cells: Further evidence for a strong bystander effect. Cancer Gene Ther. 2008;15:817–822. doi: 10.1038/cgt.2008.53. [DOI] [PMC free article] [PubMed] [Google Scholar]
- 4.Fisher MB, Zhang XQ, McConkey DJ, Benedict WF. Measuring soluble forms of extracellular cytokeratin 18 identifies both apoptotic and necrotic mechanisms of cell death produced by adenoviral-mediated interferon alpha: possible use as a surrogate marker. Cancer Gene Ther. 2009;16:567–572. doi: 10.1038/cgt.2009.2. [DOI] [PMC free article] [PubMed] [Google Scholar]
- 5.Mizushima N, Yoshimori T. How to interpret LC3 immunoblotting. Autophagy. 2007;3:542–545. doi: 10.4161/auto.4600. [DOI] [PubMed] [Google Scholar]
- 6.Benedict WF, Fisher MB, Cutler DL, Alice A, Young S, Yang Z, O'Donnell MA, Dinney CP. Results of a Phase 1 trial with intravesical Ad-IFN-α/Syn3 for superficial bladder cancer including putative marker studies (abstract). Proceedings of the 100th Annual Meeting of the American Association for Cancer Research; 2009. Abstract#1449. [Google Scholar]
- 7.Yang Z, Benedict WF. Role of ER stress and caspase 4 activation in bladder cancer cell death following exposure to Ad-IFNα abstract). Proceedings of the 99th Annual Meeting of the American Association for Cancer Research; 2008. Abstract#1387. [Google Scholar]


