

Abstract
Objective
Small scale mechanical testing techniques offer new possibilities for defining changes in mechanical properties that accompany the morphological, histological, and biochemical abnormalities of OA. The goal of this study was to investigate the use of microindentation in characterizing the biphasic material properties of articular cartilage. Direct comparisons of the biphasic properties (E, k and ν) determined using microindentation were made to those determined on the same specimens using standard macroscale testing techniques.
Methods
Deep-zone bovine articular cartilage specimens (n=10) were tested in macroscale confined and unconfined compression. For microindentation testing, the biphasic properties were determined by conducting finite element simulations of the microindentation experiments for different combinations of values of biphasic properties and identifying the combination yielding the best match to each microindentation curve. Paired t-tests were performed to compare each of E, k and ν between the macro- and microscale.
Results
The microscale values for E, k and ν were 0.74 (0.53, 0.95) MPa, 0.66 (0.022, 0.110) ×10−16 m4/Ns, and 0.16 (0.08, 0.24), respectively. A significant difference between the macro- and microscale measurements was observed for k (p < 0.0001), but not for E or ν (p = 0.88, 0.16).
Conclusions
The agreement in Young’s modulus and Poisson’s ratio between the results of the microindentation and macroscale tests supports the use of microindentation for characterization of some of the biphasic material properties of articular cartilage. The observed differences in permeability between macro- and microscales is consistent with evidence in the literature of a length-scale dependence to this property.
Keywords: articular cartilage, indentation, biphasic, poroelastic, finite element modeling, permeability
INTRODUCTION
Degeneration and subsequent loss of articular cartilage are primary pathologies of joint diseases such as osteoarthritis (OA). In OA, changes in mechanical properties of articular cartilage, such as decreased compressive stiffness and increased permeability [1], contribute to the progressive loss of function of the tissue and joint. However, direct relationships between the biology of OA progression and the loss of mechanical function are not fully understood. Through continued progress in the application of micro- and nanoscale mechanical testing techniques to articular cartilage, new possibilities exist for defining changes in mechanical properties that accompany the morphological, histological, and biochemical abnormalities of OA. For example, small-scale indentation testing can identify age-related and OA-like changes in cartilage stiffness [2] and should allow characterization of regional variations in mechanical properties with high spatial precision. For these applications, there is a need to examine relationships between the mechanical properties at the macroscale and those at smaller length scales, both for proper interpretation of the latter and for building a more comprehensive understanding of the micro- and nanostructural basis of the mechanical degradation that occurs with degenerative joint diseases.
Studies of the mechanical behavior of articular cartilage at the nanoscale have typically used atomic force microscopy and sharp pyramidal indenter tips (radii ≈ 20 nm) [3-5]. An advantage of this approach is that the combination of small tip size and shallow indentation depth allows investigators to probe the behavior of individual structural elements, such as collagen fibrils, in the tissue. In a recent study, Stolz et al. found that nanoindentation, but not microindentation, was able to detect an age-related stiffening in the femoral heads of wild-type mice as well as differences in stiffness between normal and degenerated cartilage in both murine and human cartilage specimens [2]. Moreover, this study and an earlier one on porcine cartilage [4] found much lower stiffnesses measured with nanoindentation as compared to microindentation.
Although microindentation may yield reduced sensitivity in detecting certain changes within the extracellular matrix, an advantage of testing at the microscale is that the volume of tissue that is tested is large enough to enable characterization of the poroelastic nature of articular cartilage. Thus, unlike with nanoindentation, microindentation tests can be more readily used to quantify tissue permeability. However, despite the growing number of microindentation studies on cartilage, most of the studies to date have modeled the cartilage as a linear elastic material [6-10]. Mixture theories, such as the linear biphasic, biphasic poro-viscoelastic, and fiber-reinforced poroelastic theories, that account for interactions between the fluid and solid phases of articular cartilage are more appropriate [11]. Of the studies that have used these fluid-solid mixture theories to analyze the indentation data [12-15], none has performed a direct comparison to values obtained from a “gold standard” macroscale test. As such, the accuracy of the biphasic or poroelastic material properties determined from small-scale indentation testing methods has not been established. The issue of accuracy is particularly important for indentation studies on murine articular cartilage, as the small joint size and irregular joint surface topographies in this species preclude the use of macroscale testing methods.
The overall goal of this study was to investigate the use of microindentation in characterizing the biphasic material properties of articular cartilage. This was accomplished through two specific aims: 1) to estimate the biphasic material properties (Young’s modulus, permeability and Poisson’s ratio) of articular cartilage using microindentation; 2) to compare the material properties determined via microindentation to those determined on the same specimens via standard macroscale testing techniques.
MATERIALS AND METHODS
Specimen Preparation
Bovine articular cartilage from the femoropatellar groove was chosen for this study due to its extensive use in previous studies on cartilage mechanics. As the depth-dependent variation in the mechanical properties of cartilage [16] would create difficulties in comparing macro- and microscale behavior, the deep zone of the cartilage plugs was isolated in this study in order to provide more homogeneous specimens. The specimen thickness was chosen to be thin enough to only contain deep-zone cartilage, yet thick enough to allow macroscale compression testing.
Four intact, bovine hindlimb knee joints were obtained from a local abattoir (City Packing Co, Boston, MA). Full-thickness, osteochondral explants (9.53mm diameter) were harvested from the femoral patellar groove and stored at −20°C in phosphate buffered saline (PBS) with protease inhibitor (PI) until day of testing. Explants were thawed for 1.5 hr, and articular cartilage specimens (n=10) were prepared using a freezing stage microtome (Mikron HM 450, Thermo-Scientific, Waltham, MA) to remove the underlying bone and, subsequently, the articulating surface until the specimens were ~400 μm thick. Specimens were then cut to size using a hollow cylindrical punch (6.53mm diameter, McMaster Carr, Princeton, NJ), and the height was measured using a current sensing micrometer.
Mechanical Testing
Each specimen was tested first in confined compression, followed by unconfined compression and finally microindentation with a 90-minute recovery period between tests. The total experiment time for each specimen was approximately eight hours. Specimens were completely submerged in PBS with PI during all testing and recovery periods.
Macroscale
Confined and unconfined compression tests were performed using a DMA instrument (Q800, TA Instruments, New Castle, DE) equipped with a custom submersion-compression assembly. This assembly consisted of a submersion chamber with a polycarbonate compression well and porous platen for confined compression testing and with glass platens for use in unconfined compression testing. The sides of the submersion chamber were fitted with two glass sides that allowed for imaging of the specimen during testing. For both types of tests, a 5kPa preload was applied to the specimens for 5 minutes. Specimens were then subjected to a ramp to 15% strain for confined compression or 10% strain for unconfined compression, followed by a stress-relaxation period of 1 hour. Specimens were considered to have reached equilibrium when a change of < 1 kPa occurred over 5 minutes [17]. For the unconfined test, images of the specimens were taken with a digital camera (Model #PL-A622, PixeLINK, Ottawa, ON) immediately before applying the loading ramp and at the end of the relaxation period.
Microscale
Microindentation tests were performed using a mechanical tester (TriboIndenter 900, Hysitron, Minneapolis, MN) with 1nN and 0.04nm force and displacement resolutions, respectively. Specimens were mounted with cyanoacrylate glue on a microscope slide with the side closest to the articulating surface facing up. The slide was then submerged in PBS with PI. Each specimen was indented with a conospherical (50-μm radius), diamond, fluid-cell tip. The use of a spherical geometry rather than a plane-ended tip results in a much smaller contact area, thus allowing for the detection of spatial heterogeneity of material properties, and also reduces the stress concentrations at the edge of the indenter. A protocol for manual surface detection was used to ensure an accurate measurement of indentation depth, because significant drifting of the indenter tip into the surface of the cartilage was observed when using the automatic surface detection protocol in the TriboIndenter software [18]. Briefly, the surface of the specimen was located by manually lowering the tip until a sudden increase in force was observed. The tip was then raised slightly above the surface, and each specimen was indented using a displacement-controlled ramp function in which the indenter tip was advanced at 500 nm/s to 4000nm total displacement, held at this peak displacement for a 300s relaxation period, and then unloaded at 500 nm/s. Three indents were performed on at least three different locations across the surface of the specimen. A recovery period of approximately one minute was used between indents. Indents for which it was apparent that the tip had drifted into the specimen surface prior to the start of the test were excluded from analysis. Drifting of the indenter tip prior to indentation was identified by the occurrence of an immediate and sharp increase in the force-time curve at the onset of tip displacement during testing. In the absence this drift, the measured force remained constant at the start of the test until the tip made contact with the surface.
Analysis
Macroscale
Force-time curves from the confined compression tests were analyzed by fitting the last 30% of the relaxation curve, reduced to 75 data points [19], to the linear biphasic model. The theoretical stress-relaxation response σ(t) for a biphasic material in confined compression can be determined by solving the one-dimensional differential equation
| (1) |
using boundary conditions and initial conditions that correspond to a displacement ramp to a predetermined, peak strain and a hold period at the peak strain [20]. In Equation (1), u(z,t) is the displacement, z is the axial coordinate, t is time, HA is the aggregate modulus, and k is the permeability. For the confined compression tests in this study, the displacement rate was not constant during the ramp because the DMA instrument is inherently force-controlled and relies on a feedback loop in order to control the displacement rate. The time to reach constant displacement was approximately 12 seconds. In order to account for the variable ramp rate in the theoretical stress-relaxation response, the ramp portion of the test for each specimen was approximated as piecewise linear (Figure 1) over time. Equation (1) was solved for each linear portion, and also for the hold period, using the appropriate, specimen-specific initial conditions and boundary conditions for each portion. For example, the theoretical stress-relaxation response for the first (0 < t < t1) and second (t1 < t < t2) linear portions of the ramp are
| (2) |
and
| (3) |
respectively, and the response for the hold period (t > t5) is
| (4) |
where
| (5) |
In Equations (2-5), ti are the timepoints as labeled in Figure 1, Vi and Ci are the slope and intercept, respectively, of the equation used to approximate the ith linear piecewise portion of the displacement curve, u5 is the displacement at t5 (i.e. the final, constant displacement), δ is the specimen thickness, and τ = δ2/π2HAk. The macroscale measurements of HA and k, were determined using a least squares curve-fitting routine (Matlab, The Mathworks Inc., Natick, MA) which identified the pair of values that resulted in the lowest sum of squares of error (SSE) between the experimental data and theoretical curves (Equation 4).
Figure 1.
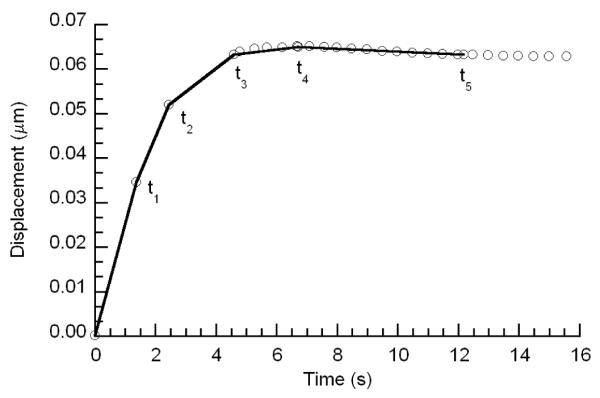
A representative plot of experimental time-displacement data during ramp period of confined compression stress-relaxation test. For the purposes of determining the theoretical stress-relaxation response during the hold period (t > t5), the displacement ramp is approximated as piecewise linear over the time intervals indicated. For ease of visualization, only every 5th data point from t3 onward is shown.
Poisson’s ratio was calculated using optical measurements of radial strain (ImageJ, NIH Bethesda, MA) made on the images taken during the unconfined compression test. Young’s modulus (E) was then calculated from HA and ν. For comparison purposes, the Young’s modulus was also calculated from the unconfined compression test.
Microscale
For analysis of the microindentation testing, finite element (FE) analysis (ABAQUS 6.7.1, Simulia, Providence, RI) was used to simulate the microindentation experiments for different combinations of biphasic material properties, and the set of properties that produced the best match between experimental and FE-computed force-time curves was determined. This approach has been used successfully in the past for macro- and microindentation tests [12, 14, 21-24]. Given that the stiffness of the diamond indenter tip is orders of magnitude stiffer than cartilage, the indenter was modeled as a rigid, impermeable, 50-μm-radius sphere. The cartilage specimen was modeled as a 400-μm-diameter, 400-μm-high cylinder comprised of 3188 bilinear, axisymmetric, pore pressure, continuum elements (CAX4P) graded in size such that smallest elements were near the contact region (Figure 2). The 400-μm diameter was chosen based on a parametric study that was performed to determine the minimum specimen diameter such that boundary effects are negligible. The cartilage was modeled as a homogenous, isotropic, linear, poroelastic solid with void ratio of 4 (representing 80% fluid) and with water (specific weight = 9.81×10⁻⁹ μN/μm3) saturating the pore space. Contact between the indenter tip and the cartilage surface was designated as small sliding, without friction. A Fortran subroutine was used to prohibit flow across the top surface of any element in contact with the tip and to allow free flow across this surface otherwise [25].
Figure 2.

FE mesh and boundary conditions for simulating the microindentation experiment. Boundary conditions: The indenter surface is rigid and impermeable; the left hand side of the model is an axis of symmetry; fluid is allowed to flow across the right boundary of the specimen and across the top surface in regions not in contact with the indenter tip; all displacement and fluid flow are restricted across the bottom.
The displacement boundary conditions followed those of the microindentation experiments, in which the tip was lowered at a rate of 500 nm/s and held for 300 seconds before unloading. As a result of the manual surface detection protocol that was used in the experiments, the total indentation depth in the microindentation experiments ranged from 3188.72 to 3913.58 nm. To account for this variation, FE simulations were performed for indentation depths varying from 3200 to 3900 nm in 100nm increments.
A 3-D, coarse, parameter mesh space (CPMS) was created using the following range of material properties: E = [0.2:0.15:2 MPa]; k = [(0.05, 0.1, 0.5, 1, 5, 10) −10−16 m4/Ns]; ν = [0.0:0.1:0.3]. A finite element simulation was performed for each combination of properties, resulting in 312 force-time curves per depth. An interpolant response surface (IRS) was then created for each depth by linearly interpolating between the CPMS force-time curves [21] using increments of 0.01 MPa for E, 0.01 E−16 m4/Ns for k, and 0.01 for ν, resulting in 5,588,556 force-time curves per IRS. The curve in the IRS that was the closest match to each experimental microindentation curve was identified by the R2 value. The average, microscale E, k and ν over all indents were calculated for each specimen.
Statistical Analysis
Paired t-tests were performed to compare each of E, k and ν between the macro- and microscales. Pearson correlation analyses were performed to determine the associations between values at the macroscale and those at the microscale. A paired t-test was also used to compare the values of E computed from HA and ν versus those computed from the unconfined compression tests. A significance level of 0.05 was used for all statistical analyses.
RESULTS
The average R2 value for all fits of the macroscale confined compression tests was 0.954 (Figure 3). The macroscale values, reported as mean (lower bound of 95% confidence interval, upper bound of 95% confidence interval) for k and ν were 3.05 (2.18, 3.92) ×10−15 m4/Ns, and 0.09 (0.04, 0.14), respectively (Table 1). The average macroscale E was 0.76 (0.60, 0.92) and 0.81 (0.55, 1.07) MPa as calculated from the confined and unconfined compression tests, respectively; these values were not significantly different from one another (p = 0.88).
Figure 3.
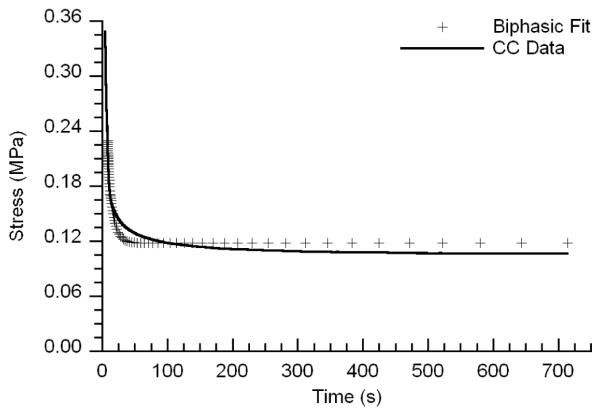
A representative plot of experimental macroscale confined compression data with corresponding fitted biphasic curve over the last 30% of the relaxation data.
Table 1.
Biphasic material properties at the macro- and microscale. Values are reported as mean (lower bound of 95% CI, upper bound of 95% CI).
| Parameter | Macroscale (n=10) | Microscale (n=90) | p-value |
|---|---|---|---|
| E (Mpa) | 0.76 (0.60, 0.92) | 0.74 (0.53, 0.95) | 0.88 |
| k (x10−15) (m4/Ns) | 3.05 (2.18, 3.92) | 0.066 (0.022, 0.110) | 0.0001 |
| ν | 0.09 (0.04, 0.14) | 0.16 (0.08, 0.24) | 0.16 |
The force-time curves from the microindentation tests exhibited the typical relaxation behavior of a biphasic material. The best-fitting IRS curves corresponded very well to the microindentation experimental data with an average R2 value for all indents of 0.990 (Figure 4). The microscale values, mean (lower bound of 95% confidence interval, upper bound of 95% confidence interval) for E, k and ν were 0.74 (0.53, 0.95) MPa, 0.66 (0.022, 0.110) ×10−16 m4/Ns, and 0.16 (0.08, 0.24), respectively (Table 1). Microindentation measurements of E at each location on the specimen surface were repeatable, while differences among locations were observed (Figure 5).
Figure 4.
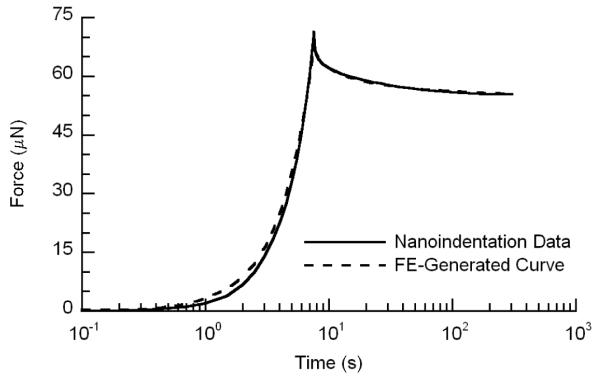
A representative plot of experimental microindentation data with corresponding best-fit IRS curve.
Figure 5.

Per-specimen comparisons of macro- and microscale properties for A) E, B) k, and C) ν. The line shows the significant correlation (p = 0.03) between the two sets of values for E. The slope of the line, 0.82, is different from 1. Each error bar represents the 95% confidence interval of all indents (n = 9) performed, for each specimen.
When comparing the macro- and microscale measurements, no difference in E or ν was observed (p = 0.88, 0.16, respectively) (Table 1). However, k was at least an order of magnitude lower at the micro-compared to the macroscale (p < 0.0001). A correlation between the macro- and microscale values was observed for E (p = 0.03), but not for k and ν (Figure 5).
DISCUSSION
Small-scale indentation techniques hold significant promise for characterizing the biomechanical aspects of the pathogenesis of OA, in part because the high spatial resolution of these techniques is well suited to murine models of OA. However, the accuracy of the biphasic or poroelastic material properties determined from this type of indentation testing has not been established. As such, the overall goal of this study was to investigate the use of microindentation in characterizing the biphasic mechanical properties of articular cartilage. This was accomplished by comparing the values of biphasic properties of bovine articular cartilage determined using microindentation and those determined on the same specimens using standard macroscale techniques. The values that we determined for E, k and ν at the macroscale are consistent with those reported for deep-zone bovine cartilage [16, 26], and reasonable agreement was found between the macro- and microscale values of E and ν. Further, the two sets of values of E were correlated with each other. In contrast, large differences between the macro- and microscale values were seen for k.
To the authors’ knowledge, this is the first study to report a paired comparison of measurements of the biphasic material properties of articular cartilage at the macro- and micro-scales. The inclusion of a direct comparison to gold-standard measurements performed on the same specimen provides the ability to validate the microindentation technique. This validation step is necessary to establish whether microindentation produces meaningful mechanical data on the poroelastic nature of the tissue.
The microindentation technique was found to be repeatable at a given location and was also able to resolve differences in E and in ν across the specimen surface. The ability to quantify spatial heterogeneity was indicated by a comparison of the coefficients of variation for the repeated indents performed at each location to the differences in means among the three indent locations for each specimen. This coefficient of variation was smaller than the average percent difference in means for eight out of the ten specimens in the case of E and nine out of the ten specimens in case of ν. However, a trend toward increasing E and k with subsequent indentation at the same location was observed, and we suspect that adding a preconditioning step to the microindentation protocol and increasing the recovery time between indents would eliminate this trend. The one-minute recovery period that was used during the microindentation test was selected during the course of preliminary analyses that suggested that this amount of time was sufficient, although a retrospective analysis conducted after all testing was completed indicated that a longer period of time should have been used. Increasing the recovery time would be expected to reduce the variability in each of E and k at each indent location, making the coefficients of variation calculated from this study upper bounds of the true extent of variability.
The differences between the values of permeability between the macro- and microscales may be due to several factors, including non-ideal test conditions in the macroscale tests, anisotropy in the tissue permeability, and a possible length-scale dependence to the permeability. For example, unavoidable [20], geometric imperfections in the specimens in this study included oblique specimen sidewalls and non-uniform diameters. These imperfections, which result in incomplete confinement, combined with interdigitation of the cartilage specimen into the porous platen and into the gap between the platen and the confinement well sidewall, contribute to an overestimation of the permeability and can result in errors of up to 400% [20, 27, 28]. An additional limitation in this respect is that the ramp time in the macroscale tests (~12 seconds) may not have been long enough to reduce the contribution of flow-independent viscoelasticity to the relaxation response, and thus may have reduced the quality of the fit of the experimental data to the theoretical model (Figure 3).
Material anisotropy may also contribute to the measured differences in permeability between the macro- and microscales. In this study, the FE simulations predict that the primary path of fluid flow in the microindentation tests is in the radial direction, whereas fluid flow in the macroscale, confined compression test is restricted to the axial direction. Prior studies have shown that the radial permeability of articular cartilage is significantly lower than the axial permeability [29-32], and this anisotropy is thought to be primarily due to the orientation of collagen fibers within the cartilage [33]. Biphasic models that include anisotropic permeability or that explicitly account for the cartilage microstructure may resolve differences observed between the two different testing configurations.
The differences between the values of permeability between the macro- and microscales may be also be due to a length-scale dependence of the permeability. Solute transport studies have reported a fairly smooth decrease in apparent diffusion constants with increasing solute size, providing evidence of the existence of a range in effective pore sizes in articular cartilage [34, 35]. The diffusion behavior of large molecules also suggests the presence of a small number of relatively large pores [34, 35]. Differences in permeability measured at different length scales would thus be expected. Indeed, the microindentation studies that have measured cartilage permeability have produced values of k lower than those typically reported at the macroscale, with differences as much as an order of magnitude [12, 14, 15].
In summary, the agreement in Young’s modulus and Poisson’s ratio between the results of the microindentation tests and those of the macroscale tests supports the use of microindentation for characterization of some of the biphasic material properties of articular cartilage. The agreement between the values of E measured at micro- and macroscale is consistent with prior published results for porcine [4] and human cartilage specimens [2]. The current findings extend the existing body of results by providing a comparison of Poisson’s ratio and permeability between the micro- and macroscales. The observed differences in permeability motivate further investigation of how this property of articular cartilage varies across length scales and of the extent to which this variation is rooted in the tissue microstructure.
ACKNOWLEDGEMENTS
The authors wish to thank Dr. Catherine Klapperich for use of the Hysitron Triboindenter. This work was supported by NIH grant AR53353 (EFM).
Footnotes
CONFLICT OF INTEREST None of the authors have any conflict of interest relating to the submitted manuscript.
Publisher's Disclaimer: This is a PDF file of an unedited manuscript that has been accepted for publication. As a service to our customers we are providing this early version of the manuscript. The manuscript will undergo copyediting, typesetting, and review of the resulting proof before it is published in its final citable form. Please note that during the production process errors may be discovered which could affect the content, and all legal disclaimers that apply to the journal pertain.
REFERENCES
- 1.Armstrong CG, Mow VC. Variations in the intrinsic mechanical properties of human articular cartilage with age, degeneration, and water content. Journal of Bone and Joint Surgery. American Volume. 1982;64:88–94. [PubMed] [Google Scholar]
- 2.Stolz M, Gottardi R, Raiteri R, Miot S, Martin I, Imer R, et al. Early detection of aging cartilage and osteoarthritis in mice and patient samples using atomic force microscopy. Nat Nanotechnol. 2009;4:186–192. doi: 10.1038/nnano.2008.410. [DOI] [PubMed] [Google Scholar]
- 3.Hu K, Radhakrishnan P, Patel RV, Mao JJ. Regional structural and viscoelastic properties of fibrocartilage upon dynamic nanoindentation of the articular condyle. J Struct Biol. 2001;136:46–52. doi: 10.1006/jsbi.2001.4417. [DOI] [PubMed] [Google Scholar]
- 4.Stolz M, Raiteri R, Daniels AU, VanLandingham MR, Baschong W, Aebi U. Dynamic elastic modulus of porcine articular cartilage determined at two different levels of tissue organization by indentation-type atomic force microscopy. Biophys J. 2004;86:3269–3283. doi: 10.1016/S0006-3495(04)74375-1. [DOI] [PMC free article] [PubMed] [Google Scholar]
- 5.Tomkoria S, Patel RV, Mao JJ. Heterogeneous nanomechanical properties of superficial and zonal regions of articular cartilage of the rabbit proximal radius condyle by atomic force microscopy. Med Eng Phys. 2004;26:815–822. doi: 10.1016/j.medengphy.2004.07.006. [DOI] [PubMed] [Google Scholar]
- 6.Ebenstein DM, Kuo A, Rodrigo JJ, Reddi AH, Ries M, Pruitt L. A nanoindentation technique for functional evaluation of cartilage repair tissue. J Mater Res. 2004;19:273–281. [Google Scholar]
- 7.Hyttinen MM, Toyras J, Lapvetelainen T, Lindblom J, Prockop DJ, Li SW, et al. Inactivation of one allele of the type II collagen gene alters the collagen network in murine articular cartilage and makes cartilage softer. Ann Rheum Dis. 2001;60:262–268. doi: 10.1136/ard.60.3.262. [DOI] [PMC free article] [PubMed] [Google Scholar]
- 8.Li C, Pruitt LA, King KB. Nanoindentation differentiates tissue-scale functional properties of native articular cartilage. J Biomed Mater Res A. 2006;78:729–738. doi: 10.1002/jbm.a.30751. [DOI] [PubMed] [Google Scholar]
- 9.Li X, An YH, Wu YD, Song YC, Chao YJ, Chien CH. Microindentation test for assessing the mechanical properties of cartilaginous tissues. J Biomed Mater Res B Appl Biomater. 2007;80:25–31. doi: 10.1002/jbm.b.30564. [DOI] [PubMed] [Google Scholar]
- 10.Park S, Costa KD, Ateshian GA, Hong KS. Mechanical properties of bovine articular cartilage under microscale indentation loading from atomic force microscopy. Proc Inst Mech Eng H. 2009;223:339–347. doi: 10.1243/09544119JEIM516. [DOI] [PubMed] [Google Scholar]
- 11.Lai WM, Mow VC, Zhu W. Constitutive modeling of articular cartilage and biomacromolecular solutions. Journal of Biomechanical Engineering. 1993;115:474–480. doi: 10.1115/1.2895527. [DOI] [PubMed] [Google Scholar]
- 12.Cao L, Youn I, Guilak F, Setton LA. Compressive properties of mouse articular cartilage determined in a novel micro-indentation test method and biphasic finite element model. J Biomech Eng. 2006;128:766–771. doi: 10.1115/1.2246237. [DOI] [PubMed] [Google Scholar]
- 13.Hu K, Xu L, Cao L, Flahiff CM, Brussiau J, Ho K, et al. Pathogenesis of osteoarthritis-like changes in the joints of mice deficient in type IX collagen. Arthritis Rheum. 2006;54:2891–2900. doi: 10.1002/art.22040. [DOI] [PubMed] [Google Scholar]
- 14.Gupta S, Lin J, Ashby P, Pruitt L. A fiber reinforced poroelastic model of nanoindentation of porcine costal cartilage: a combined experimental and finite element approach. J Mech Behav Biomed Mater. 2009;2:326–337. doi: 10.1016/j.jmbbm.2008.09.003. discussion 337-328. [DOI] [PubMed] [Google Scholar]
- 15.Chiravarambath S, Simha NK, Namani R, Lewis JL. Poroviscoelastic cartilage properties in the mouse from indentation. J Biomech Eng. 2009;131:011004. doi: 10.1115/1.3005199. [DOI] [PubMed] [Google Scholar]
- 16.Chen AC, Bae WC, Schinagl RM, Sah RL. Depth- and strain-dependent mechanical and electromechanical properties of full-thickness bovine articular cartilage in confined compression. J Biomech. 2001;34:1–12. doi: 10.1016/s0021-9290(00)00170-6. [DOI] [PubMed] [Google Scholar]
- 17.Khalsa PS, Eisenberg SR. Compressive behavior of articular cartilage is not completely explained by proteoglycan osmotic pressure. J Biomech. 1997;30:589–594. doi: 10.1016/s0021-9290(97)84508-3. [DOI] [PubMed] [Google Scholar]
- 18.Kaufman JD, Miller GJ, Morgan EF, Klapperich CM. Time-dependent mechanical characterization of poly(2-hydroxyethyl methacrylate) hydrogels using nanoindentation and unconfined compression. J Mater Res. 2008;23:1472–1481. doi: 10.1557/JMR.2008.0185. [DOI] [PMC free article] [PubMed] [Google Scholar]
- 19.Roemhildt ML, Coughlin KM, Peura GD, Fleming BC, Beynnon BD. Material properties of articular cartilage in the rabbit tibial plateau. J Biomech. 2006;39:2331–2337. doi: 10.1016/j.jbiomech.2005.07.017. [DOI] [PMC free article] [PubMed] [Google Scholar]
- 20.Mow VC, Kuei SC, Lai WM, Armstrong CG. Biphasic creep and stress relaxation of articular cartilage in compression: theory and experiments. Journal of Biomechanical Engineering. 1980;102:73–84. doi: 10.1115/1.3138202. [DOI] [PubMed] [Google Scholar]
- 21.Keenan KE, Kourtis LC, Besier TF, Lindsey DP, Gold GE, Delp SL, et al. New resource for the computation of cartilage biphasic material properties with the interpolant response surface method. Comput Methods Biomech Biomed Engin. 2009;12:415–422. doi: 10.1080/10255840802654319. [DOI] [PMC free article] [PubMed] [Google Scholar]
- 22.Hale JE, Rudert MJ, Brown TD. Indentation assessment of biphasic mechanical property deficits in size-dependent osteochondral defect repair. J Biomech. 1993;26:1319–1325. doi: 10.1016/0021-9290(93)90355-i. [DOI] [PubMed] [Google Scholar]
- 23.Athanasiou KA, Rosenwasser MP, Buckwalter JA, Malinin TI, Mow VC. Interspecies comparisons of in situ intrinsic mechanical properties of distal femoral cartilage. J Orthop Res. 1991;9:330–340. doi: 10.1002/jor.1100090304. [DOI] [PubMed] [Google Scholar]
- 24.Athanasiou KA, Zhu CF, Wang X, Agrawal CM. Effects of aging and dietary restriction on the structural integrity of rat articular cartilage. Ann Biomed Eng. 2000;28:143–149. doi: 10.1114/1.238. [DOI] [PubMed] [Google Scholar]
- 25.Warner MD, Taylor WR, Clift SE. Computer Methods in Biomechanics and Biomedical Engineering. Gordon and Breach Science Publishers; Lisbon, Portugal: 2001. A method for automatically determining contact between a non-porous surface and articular cartilage in a biphasic FE model; pp. 207–212. [Google Scholar]
- 26.Maroudas A. Physicochemical properteis of cartilage in light of ion-exchange theory. Biophysical Journal. 1968;8:575–595. doi: 10.1016/S0006-3495(68)86509-9. [DOI] [PMC free article] [PubMed] [Google Scholar]
- 27.Buschmann MD, Soulhat J, Shirazi-Adl A, Jurvelin JS, Hunziker EB. Confined compression of articular cartilage: linearity in ramp and sinusoidal tests and the importance of interdigitation and incomplete confinement. J Biomech. 1998;31:171–178. doi: 10.1016/s0021-9290(97)00124-3. [DOI] [PubMed] [Google Scholar]
- 28.Gervaso F, Pennati G, Boschetti F. Effect of geometrical imperfections in confined compression tests on parameter evaluation of hydrated soft tissues. J Biomech. 2007;40:3041–3044. doi: 10.1016/j.jbiomech.2007.02.020. [DOI] [PubMed] [Google Scholar]
- 29.Reynaud B, Quinn TM. Anisotropic hydraulic permeability in compressed articular cartilage. J Biomech. 2006;39:131–137. doi: 10.1016/j.jbiomech.2004.10.015. [DOI] [PubMed] [Google Scholar]
- 30.Jurvelin JS, Buschmann MD, Hunziker EB. Mechanical anisotropy of the human knee articular cartilage in compression. Proc Inst Mech Eng H. 2003;217:215–219. doi: 10.1243/095441103765212712. [DOI] [PubMed] [Google Scholar]
- 31.Greene GW, Zappone B, Zhao B, Soderman O, Topgaard D, Rata G, et al. Changes in pore morphology and fluid transport in compressed articular cartilage and the implications for joint lubrication. Biomaterials. 2008;29:4455–4462. doi: 10.1016/j.biomaterials.2008.07.046. [DOI] [PubMed] [Google Scholar]
- 32.Leddy HA, Haider MA, Guilak F. Diffusional anisotropy in collagenous tissues: fluorescence imaging of continuous point photobleaching. Biophys J. 2006;91:311–316. doi: 10.1529/biophysj.105.075283. [DOI] [PMC free article] [PubMed] [Google Scholar]
- 33.Federico S, Herzog W. On the anisotropy and inhomogeneity of permeability in articular cartilage. Biomech Model Mechanobiol. 2008;7:367–378. doi: 10.1007/s10237-007-0091-0. [DOI] [PubMed] [Google Scholar]
- 34.Maroudas A. Transport of solutes through cartilage: permeability to large molecules. J Anat. 1976;122:335–347. [PMC free article] [PubMed] [Google Scholar]
- 35.Torzilli PA, Adams TC, Mis RJ. Transient solute diffusion in articular cartilage. J Biomech. 1987;20:203–214. doi: 10.1016/0021-9290(87)90311-3. [DOI] [PubMed] [Google Scholar]