
Figure 7.
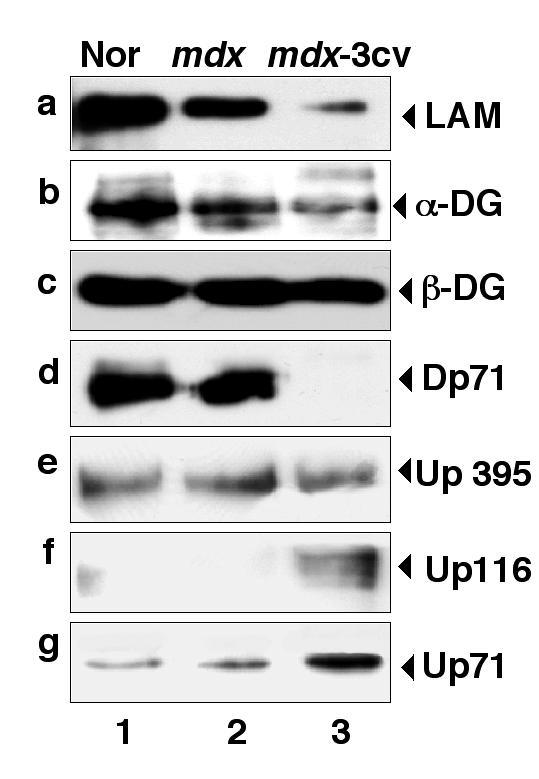
Immunoblot analysis of β dystroglycan and associated components in normal and dystrophic brain-membranes. Shown are identical immunoblots labeled with antibodies to laminin (LAM) (a), α-dystroglycan (α-DG) (b), β-dystroglycan (β-DG) (c), dystrophin of apparent 71 kDa (Dp71) (d), full-length utrophin of apparent 395 kDa (Up395) (e), the utrophin isoform of apparent 116 kDa (Up116) (f), and the utrophin isoform of apparent 71 kDa (Up71) (g). Lanes 1 to 3 represent microsomal membranes isolated from normal brain, mdx brain, and mdx-3cv brain, respectively. The position of immuno-decorated protein bands is indicated by arrow heads.