

Abstract
All-trans retinoic acid (RA) is a critical signaling molecule and its concentration is tightly regulated. Several P450 enzymes including CYP26A1, CYP2C8, and CYP3A4 have been proposed to be responsible for RA clearance in the liver but their quantitative importance has not been demonstrated. To determine the contribution of CYP26A1 to hepatic clearance of RA, CYP26A1 protein was quantified in 37 human liver microsomes (HLMs). CYP26A1 expression ranged from not detectable to 2.80 pmol/mg microsomal protein. RA clearance by P450 enzymes abundant in human liver was measured in Supersomes®. CYP2C8, CYP3A4, CYP3A5 and CYP3A7 metabolized RA with unbound Km values of 3.4–7.2 μM and Vmax values of 2.3–4.9 pmol/min/pmol P450, but were less efficient than CYP26A1 in clearing RA. Simulations performed for livers with varying P450 expression levels over a range of RA concentrations demonstrated that at both endogenous and therapeutic concentrations of RA, CYP26A1 is the primary enzyme responsible for 4-OHRA formation clearance. HLM incubation data showed that 4-OH RA formation velocity varied from 0.2 to 15.3 pmol/min/mg microsomal protein and velocity in HLMs was significantly correlated (p < 0.01) to CYP26A1, CYP3A4, and CYP3A5 protein content, but not to CYP2C8. When experimental data were scaled to in vivo clearances, the predicted hepatic clearance of RA(0.07 L/min using combined Supersome® data) was similar to the published in vivo clearance of RA. These findings suggest that CYP26A1 is the P450 isoform that should be targeted when designing RA metabolism blocking agents.
Keywords: CYP26A1, Retinoic acid metabolism, Vitamin A, Hepatic clearance
1. Introduction
All-trans retinoic acid (RA) is the biologically active metabolite of Vitamin A (Retinol). RA serves as a critical signaling molecule, regulating gene transcription, cell division and apoptosis during development and adult life [1–3]. Both too much and too little RA have been linked with detrimental effects, including increased risk of infection leading to death [4], decreased fertility [5], Alzheimer’s disease [6] and developmental defects [7]. Therefore, concentrations of RA must be tightly regulated.
Cellular exposure to RA is regulated by controlled synthesis and metabolism. The liver plays a role in maintaining RA homeostasis by contributing to RA synthesis and clearance, serving as the major storage organ for retinyl esters and RA, and by providing a first pass barrier for dietary intake of RA [8]. The liver is also likely to be the main organ clearing therapeutically administered RA. The exact metabolic pathway by which RA is cleared from the body is still unclear, but the primary oxidative pathway for RA clearance is believed to be via P450 mediated formation of 4-OH RA [9–11]. There is an abundance of data showing the oxidation of RA to 4-OH RA and other metabolites, including a subsequent oxidation to 4-oxo RA, in in vitro systems such as COS-1, V79-4, and HeLa cells; liver, lung, kidney, and testis microsomes and recombinant P450 expression systems [9–16]. In all of these studies, 4-OH RA was detected as the primary oxidation product formed from RA. Despite the in vitro data, the identity of in vivo metabolites of RA is still mainly qualitative and the only metabolite detected in plasma is the 4-oxo RA. 4-oxo RA has been detected in rabbits administered RA or retinyl palmitate [17] and in human plasma [18]. At present the identity of the enzyme forming 4-oxo RA is unknown. However, since 4-OH RA is a necessary primary metabolite leading to 4-oxo RA, the presence of 4-oxo RA in vivo demonstrates that 4-OH RA is also formed in vivo.
Several P450s have been demonstrated to oxidize RA in vitro, including CYP2C8, CYP2C9, CYP2C18, CYP3A4, CYP3A5, CYP3A7, and the newer family of P450s, CYP26. [9–11,19] The general consensus of the previously published studies evaluating the importance of P450 isoforms in the metabolism of RA is that CYP2C8 and members of the CYP3A subfamily are the primary P450s responsible for RA clearance. However, the proposed relative importance of these enzymes varies and published data suggests that other enzymes may be involved in RA metabolism as well. Quinidine, a classic selective inhibitor of CYP2D6, caused a 50% reduction in 4-OH RA formation in human liver microsomes despite the fact that recombinant CYP2D6 did not form 4-OH RA from RA [11]. In another study, ketoconazole (20 μM) inhibited 50% of the 4-hydroxylation activity indicating that CYP3A4 contribution to RA hydroxylation does not exceed 50% [10]. These findings suggest that enzymes other than CYP3A4 and CYP2C8 may be important for RA hydroxylation in human liver. A possible additional enzyme would be a member of the CYP26 family, as the contribution of CYP26 enzymes to hepatic RA oxidation was not analyzed in these previous studies [20].
CYP26A1 was first identified in 1996 and has been demonstrated to be inducible by RA and to metabolize RA [13]. The enzymes of the CYP26 family, including CYP26A1 as well as CYP26B1 [21] and CYP26C1 [22], are believed to be the primary CYP enzymes responsible for clearing RA based on the fact that these enzymes metabolize RA efficiently in vitro and are inducible by RA [23]. Cyp26a1−/− and Cyp26b1−/− mice are not viable [24,25] and show developmental defects similar to the teratogenic effects associated with excess RA [24]. Studies examining mRNA expression have identified CYP26A1 mRNA in the human liver [26,27] whereas CYP26B1 and CYP26C1 mRNA were present in only a fraction of livers and at a lower level of expression than CYP26A1. Based on mRNA data CYP26A1 was suggested to be the major liver CYP26 isoform [27].
The goal of this study was to determine the role of CYP26A1 in hepatic clearance of RA. We hypothesized that if CYP26A1 is expressed in the liver, it will be the major contributor to RA clearance in this organ, due to the efficiency with which CYP26A1 metabolizes RA [19]. We also hypothesized that due to the low Km of RA towards CYP26A1, with increasing exposure to RA during therapeutic treatment with RA, CYP26A1 will be saturated and the role of other P450 isoforms in RA clearance will increase. To test this hypothesis, RA hydroxylation kinetics was determined for individual P450 isoforms and the relative importance of these enzymes to RA clearance was predicted. Using human liver microsomes (HLMs) from multiple donors, the expression of CYP26A1 protein in the liver was quantified, and RA hydroxylation measured in multiple donors. The obtained data was used in simulating the contribution of CYP26A1 to RA clearance for the purpose of establishing the relative importance of CYP26A1 between individuals and over a variety of RA concentrations.
2. Materials and methods
2.1. Reagents
RA, acitretin, cholate, imidazole and NADPH were purchased from Sigma–Aldrich (St. Louis, MO). 4-OH RA was synthesized in-house as previously described [19]. Supersomes® were purchased from Gentest (BD Biosciences, Woburn, MA.) All supersomes were co-expressed with reductase and, with the exception of CYP4A11, CYP1A1, CYP1A2, CYP2C18 and CYP2D6, with cytochrome b5. Purified CYP1A1 protein was purchased from Panvera (Madison, WI). The remaining purified proteins were obtained as gifts from the Department of Medicinal Chemistry, University of Washington. CYP26A1 was expressed in Sf9 cells as previously described and utilized as microsomal fractions [19]. Nonidet P40, PMSF and Complete EDTA free Protease Cocktail Tablets were purchased from Roche (Indianapolis, IN). All solvents used were HPLC grade or higher and purchased from EMD Chemicals (Gibbstown, NJ), JT Baker (Phillipsburg, NJ), or Fischer Scientific (Pittsburgh, PA). Potassium chloride was purchased from Fisher Scientific. Sodium phosphate and glycerol were purchased from JT Baker. Rat P450 reductase was expressed in E. coli and purified as previously reported [28]. HLMs, a generous gift from Dr. Cathy Yeung, University of Washington, Department of Medicinal Chemistry, were prepared from human liver samples obtained from the University of Washington, School of Pharmacy Human Tissue Bank (Seattle, WA) and prepared according to a previously published protocol [29,30].
2.2. Purification of recombinant His tagged CYP26A1
Full length CYP26A1 with a hexahistidine-tag was expressed in Sf9 cells as previously described [19]. The frozen cell pellet was homogenized using a Thomas tube and a Teflon pestle in a buffer (pH 7.4) containing 50 mM KPi, 150 mM KCl and protease inhibitors. The cell organelles were separated from microsomes by centrifugation at 8000 × g, and the supernatant was collected and centrifuged at 100,000 × g for 40 min. The pellet was resuspended in 50 mM KPi buffer with 150 mM KCl with 20% glycerol. Detergents (Nonidet P40 and cholate) were added to make a final concentration of 1%. The proteins were solubilized with gentle agitation on ice for 1 h. Insoluble matter was pelleted by centrifugation at 21,000 × g for 40 min at 4 °C. The supernatant was then used for affinity purification.
Affinity purification was conducted using a Bio-Rad Duoflow FPLC equipped with an Econo gradient pump, a Quadtech UV–vis detector, conductivity and pH monitors and a UV detector (Hercules, CA). One and a half milliliters of Talon Affinity Resin (Clontech, Mountainview, CA) was hand packed as a column and conditioned using loading buffer (LB) containing, 50 mM KPi, 150 mM KCl, 20% glycerol, 1% Nonidet P40 (NP40), 1% cholate, PMSF and protease inhibitors with additional 20 mM imidazole. The proteins were loaded on the column in LB at 0.75 mL/min flow after which the column was washed with 10 mL LB containing 5 mM imidazole and 40 mL of wash buffer (WB) containing 50 mM KPi, 150 mM KCl, 20% glycerol, 1% cholate and 5 mM imidazole at 0.5 mL/min flow. The proteins were eluted running a linear gradient between WB and elution buffer (EB) containing 50 mM KPi, 150 mM KCl, 20% glycerol, 1 M imidazole at 0.5 mL/min as follows: 15 mL 96% WB, 4% EB, linear gradient from 4% to30% EB over 15 mL, and then isocratic flow at 70% WB, 30% EB for 15 mL. One and a half milliliter fractions were collected and the elution of active CYP26A1 was monitored on 410 nm. Fractions showing absorbance at 410 nm were run on an SDS-Page to confirm purity and correct molecular weight before fractions containing pure protein were combined. The combined fractions were concentrated using an Amicon Centifugal Filter Device (Millipore, Billarica, MA) with molecular weight cut-off of 30 kDa and buffer exchanged in the same concentrator to a final storage buffer of 50 mM KPi, 150 mM KCl, 1% cholate and 20% glycerol. Aliquots of the pure CYP26A1 were flash frozen in liquid nitrogen and stored at −80 °C. The protein concentration was measured with a Pierce BCA Protein Quantitation Kit according to manufacturer’s instructions (Pierce, Rockford, IL) and by CO-difference spectrum to quantify functional P450 protein.
2.3. Development and validation of a specific antibody against CYP26A1
Four anti-CYP26A1 antibodies, three commercial and one in-house, against specific peptides or CYP26A1 protein were evaluated for specificity and sensitivity. The antibodies tested included: Antibody #1 (ab64888) a rabbit polyclonal antibody raised against an internal CYP26A1 sequence peptide and IgG purified by Abcam (Cambridge, MA), Antibody #2 (ab66243) a mouse monoclonal antibody raised against a c-terminal peptide and supplied as culture supernatant also from Abcam (Cambridge, MA), Antibody #3 (H00001592-B01) a mouse polyclonal antibody raised against the full recombinant CYP26A1 protein and IgG purified obtained from Abnova (Walnut, CA), and Antibody #4, a rabbit polyclonal antibody raised against a c-terminal peptide of CYP26A1 (PVDNLPARFTHFHGEI) designed in-house as previously described [19]. The in-house antibody (#4) was purified from rabbit serum using a Pierce (Thermo Scientific, Rockford, IL) CarboxyLink Immobilization Kit (44899) according to the manufacturer’s instructions. In brief, the same peptide used to immunize the rabbits was coupled over the course of 3 h to the provided resin packed column. The column was then washed with 1 M NaCl. Antibodies were bound to the column over 1 h, the column washed with PBS, and the antibody eluted with a 0.1 M glycine–HCl (pH 2.5–3) buffer. The purified Antibody #4 solution was then neutralized with 1 M phosphate buffer (pH 9), concentrated using Zeba™ Desalt Spin Columns (Pierce/Thermo Scientific, Rockford, IL), and 0.05% sodium azide was added to prevent bacterial growth.
The specificity of the antibodies was tested against CYP1A1, CYP1A2, CYP2C8, CYP2C9, CYP2C18, CYP2C19, CYP2D6, CYP3A4, CYP3A5, and CYP3A7 supersomes, in addition to the CYP26A1 insect cell membrane preparation. Five micrograms of CYP26A1 membrane preparation and 20 μg total supersome protein of the other CYP isoforms were loaded on the gel. Alternatively, 4 pmol of purified P450s was loaded on the gel. All samples were boiled for 5 min in a buffer containing 2.5% β-mercaptoethanol, loaded onto 10% polyacrylamide gels and separated using electrophoresis. Proteins were transferred for 1 h with 100 V to a PVDF membrane (Millipore, Billeria, MA). The membranes were blocked for 1 h with a mixture of 50% Odyssey® block (LI-COR® Biosciences, Lincoln, NE, USA) and 50% Phosphate-Buffered Saline (PBS) (pH 7.4). Membranes were incubated overnight in PBS + 0.1% Tween: Odyssey block (1:1) with primary antibodies at dilutions recommended by the vendors: Antibody #1 (1:500), Antibody #2 (1:1), Antibody #3 (1:1000) and Antibody #4 (1:50,000). Membranes were washed four times with PBS + 0.1% Tween and then incubated with the secondary antibody (Alexa Fluor 680 goat anti-rabbit or Alexa Fluor 680 rabbit anti-mouse IgG, Invitrogen Corporation, Eugene, OR) at a 1:4000 dilution for 1 h. Membranes were again washed four times with PBS + 0.1% Tween, then rinsed and stored in PBS. Membranes were scanned using an Odyssey® Infrared Imaging System.
2.4. Quantification of CYP26 protein in human liver microsomes
CYP26A1 protein expression was quantified in HLMs from 37 donors. Samples were prepared and proteins separated as described above. Eighty micrograms of microsomal protein was loaded per donor. Calibration curves containing purified hexahistidine-tagged CYP26A1 (0.1, 0.2, and 0.4 pmol) were included on each gel analyzed for CYP26A1 and proteins detected using Antibody #4. CYP26A1 protein expression was quantified using the Odyssey Infrared Imaging System Application Software 2.1 and a calibration curve was constructed using purified protein. The average intensity was calculated for each lane after background subtraction. Samples that had an average intensity below the lowest CYP26A1 pure protein calibrator were marked as negative and excluded from statistical analysis.
2.5. Analysis of 4-OH RA in incubations
Incubations and extractions were performed in the dark under red light. 1 mL incubations were performed in a 37 °C water bath using 100 mM KPi buffer (pH 7.4). Calibration curves with 4-OH RA were constructed at concentrations of 1, 2.5, 5, 7.5, 10, 25, 50, and 100 nM spiked into KPi buffer. Protein amounts, RA concentrations, and incubation times were as described for individual experiments. After a 4-min pre-incubation at 37 °C, reactions were initiated with 1 mM NADPH. The reaction was terminated with the addition of 5 mL of ethyl acetate before 10 μL of 5 μM acitretin was added as an internal standard. The samples were vortexes, centrifuged, and the organic layer was collected. Solvent was evaporated under a nitrogen stream and the residue was reconstituted in 100 μL methanol for transfer to an amber auto sampler vial. Ten micro liters of sample was injected on to an Agilest Technologies (Palo Alto, CA) 1200 series HPLC system with an Agilest Technologies Extend C18 3.5 μm column (2.1 mm i.d. × 100 mm). The mobile phase flow was 0.20 mL/min and the compounds were separated by gradient elution. The initial conditions were 90% 50 mM ammonium acetate (pH 4.5) and 10% acetonitrile. Acetonitrile was increased linearly to reach 10% buffer and 90% acetonitrile by 15 min. This mixture was held for 13 min before returning linearly to initial conditions 1 min later. The system was then allowed to re-equilibrate for another 11 min. Analytes were detected with a multiple wavelength detector, monitoring the 360 nm wavelength. Data analysis was performed using HP Chemstation software.
2.6. Supersome and HLM incubations
To identify the cytochrome P450 isoforms that metabolize RA, 40 pmol of common drug metabolizing cytochrome P450 enzymes (CYP1A1, CYP1A2, CYP2B6, CYP2C18, CYP2C19, CYP2C8, CYP2C9, CYP2D6, CYP3A4, CYP3A5, CYP3A7, and CYP4A11) were incubated for 30 min in the presence of 10 μM RA. For comparison, 40 pmol of CYP26A1 was combined with 80 pmol P450 reductase and incubated with 10 μM RA for 30 min.
Full kinetic characterization of 4-OH RA formation kinetics was conducted with CYP2C8, CYP3A4, CYP3A5, and CYP3A7. Incubations were performed for 10 min, in duplicate, with 5 pmol of each of the cytochrome P450 isoforms and with 13–16 different concentrations of RA, between 0.01 and 100 μM. The velocities were plotted against the initial substrate concentrations and the Michaelis–Menten equation was fit to the data. The intrinsic clearance for each of the relevant P450 isoforms was calculated as Vmax/Km.
RA hydroxylation was measured in triplicate for 40 HLM samples using 0.2 mg of HLM and 1 μM RA. The incubations were conducted for 30 min. 4-OH RA metabolite formation was quantified and the formation velocity calculated.
2.7. Unbound fraction of RA in HLMs and supersomes
The unbound fraction of RA in both supersomes and HLMs was quantified using a method adapted from a previously published protocol [31]. Samples were analyzed in triplicate. Five picomoles of CYP2C8, CYP3A4 and CYP3A5 supersomes and 0.2 mg of two different HLMs were individually pre-incubated with 1 μM RA in 1 mL KPi at 37 °C for 5 min. A 250 μL aliquot of the 1 mL sample was collected and extracted for RA analysis and another 500 μL aliquot of the sample was transferred to a 2 mL polycarbonate tube and centrifuged at 514,000 × g for 2 h in a Sorvall Micro-Ultracentrifuge, using a fixed angle rotor S120-AT2 (Kendro Laboratory Products, Asheville, NC). From the centrifuged samples, 250 μL of the supernatant was transferred to a clean tube and extracted as described above. The fraction unbound was calculated by dividing the unbound RA (centrifuged) concentration by the total RA (uncentrifuged) concentration.
2.8. Predicting clearance for selected livers
The contribution of individual P450 isoforms to RA clearance was predicted for the livers using the Michaelis–Menten equation and Excel (Redmond, WA). The Michaelis–Menten equation for multiple enzymes was used for prediction of total clearance according to Eq. (1):
| (1) |
in which, Su is the unbound substrate (RA) concentration, [E] refers to the expression level of CYP26A1, CYP2C8, CYP3A4, and CYP3A5 as quantified for each donor in this study or as previously reported [32,33], Vmax is the maximum reaction velocity observed per pmol individual P450 in supersomes and Kmu is the Michaelis constant multiplied by the fraction unbound in individual supersomes. The percent contribution by each cytochrome P450 isoform at the given free RA concentration (Su) was predicted by dividing the predicted clearance calculated for a specific cytochrome P450, by the total predicted clearance for all cytochrome P450. The predictions were performed using the determined cytochrome P450 expression levels in each of the livers analyzed and at two different unbound RA concentrations, the reported circulating concentration of RA at basal conditions (0.05 nM) [34] and the reported Cmax of RA following administration of RA therapeutically (14 nM) [35,36]. The free RA concentration (Su) was calculated by multiplying the plasma concentration by the fraction unbound in plasma (fu = 0.01%) [35] assuming equal free concentrations of RA in plasma and in the hepatocytes.
To determine the effect of CYP26A1 saturation on the relative contribution of individual CYPs to RA clearance, the concentration dependent percent contribution of the CYP isoforms to RA hydroxylation was simulated for two HLMs by dividing the intrinsic clearance for a given isoform by the total clearance predicted using Eq. (1), over a RA concentration range of 0.001–1 μM, using Gepasi 3—Biochemical Kinetics Simulator Software [37]. To determine the effect of CYP26A1 expression together with RA concentration on RA clearance, the unbound intrinsic clearance of RA was simulated varying CYP26A1 protein expression from 0 to 3 pmol/mg and free RA concentrations from 0.001 to 0.1 μM. The average liver CYP2C8 and CYP3A4 protein expression values of 24 and 111 pmol/mg were used for this simulation as reported [38].
For HLM samples for which protein quantitation of the relevant P450s was available, the observed RA hydroxylation clearance obtained in HLM incubations with 1 μM RA was compared to the clearances predicted from supersomal data calculated using Eq. (1). The microsomal unbound concentration of 14 nM was used for the predictions. Correlation between observed and predicted clearances was tested using linear regression.
The total hepatic in vivo clearance (Clh) was predicted using the well-stirred model [39]:
| (2) |
and scaling from the observed and predicted in vitro clearances obtained in supersomes and HLMs. Scaling was performed using the following values: 32 mg microsomal protein/g liver, 20 g of liver/kg body weight, an average body weight of 70 kg, a fraction unbound in plasma of 0.01, and a liver blood flow of 1.5 L/min [40,41].
2.9. Statistical analysis
Non-linear regression and statistical analyses, except where noted, were performed using GraphPad Prism (La Jolla, CA). P-values less than 0.01 were considered to be statistically significant. Km and Vmax were determined using the Michaelis–Menten model and intrinsic clearance was calculated as (Vmax/Km). Correlation between expression of each of the CYP isoforms and 4-OH RA formation velocity was tested using simple linear regression. Next, using SPSS Predictive Analytics Software version 16.0 (Chicago, IL), multivariate regressions were performed using the F-test. CYP26A1 was adjusted as a covariate to determine if the other P450 isoforms (CYP2C8, CYP3A4 and CYP3A5) were still significantly correlated with RA hydroxylation.
3. Results
3.1. Quantification of CYP26 in human liver microsomes
To determine the relative importance of CYP26A1 in RA clearance, the amount of CYP26A1 in a panel of livers was quantified. The specificity and sensitivity of the commercial and in-house antibodies was validated by evaluating them against two CYP26 insect cell membrane preparations and a panel of supersomes of ten P450s abundant in human liver. Cross reactivity with specific P450 isoforms was further confirmed using seven purified CYP proteins. Supplemental Figure 1 shows the ability of the four different antibodies to specifically detect CYP26A1. All antibodies with the exception of the monoclonal Antibody #2 reacted with CYP26A1 protein. In addition to detecting CYP26A1, Antibody #1 and Antibody #3 cross-reacted with other supersomal proteins with molecular weights around 56 kDa (Supplemental Figures 1C and E). When tested against pure P450 isoforms, Antibody #1 and Antibody #3 showed significant cross reactivity with CYP3A4 and Antibody #1 also detected CYP1A2, 2C9, and 2C19 (Supplemental Figures 1D and F). Due to its inability to detect CYP26A1, Antibody #2 was not tested against pure proteins. Antibody #4 was selected for quantification of CYP26A1 in the liver because it was the only antibody tested that was selective for CYP26A1 (Fig. 1A). Peptide purification was, however, necessary to obtain the high level of selectivity of Antibody #4 for CYP26A1 protein. When this antibody was used as antiserum or IgG purified serum, it cross-reacted with CYP2C9, CYP2C19, and CYP3A4 purified proteins (data not shown).
Fig. 1.

Identification and quantification of CYP26A1 in human liver microsomes. Panel (A) shows in-house Antibody #4 reacting with pure CYP26A1 protein, but not any of the other purified P450s tested. Panel (B) is a representative western blot showing the detection of CYP26A1 in HLMs using Antibody #4. The first three lanes contain hexahistidine-tagged CYP26A1 standard (predicted MW: 58 kDa) and the following 13 lanes contain 80 μg of different HLMs containing varied amounts of CYP26A1 (predicted MW: 56 kDa).
Using peptide purified Antibody #4, CYP26A1 was detected at a concentration above the lowest standard (0.1 pmol) in 26 (70%) of the 37 donors. The total microsomal CYP26A1 content in the liver varied between donors (Fig. 1B). Expression in those livers that were quantifiable ranged from 1.02 to 2.80 pmol/mg microsomal protein (mean: 1.60 pmol/mg microsomal protein, median: 1.47 pmol/mg microsomal protein).
3.2. Characterization of 4-OH RA formation by cytochrome P450 isoforms
All twelve liver CYP isoforms screened were capable of oxidizing RA to 4-OH RA when incubated with 10 μM RA (Fig. 2A), but over 10-fold differences in 4-OH RA formation velocity were observed between the low activity and high activity isoforms. Based on the level of activity demonstrated at 10 μM, CYP2C8, CYP3A4, CYP3A5, and CYP3A7 were further kinetically characterized. 4-OH RA was the primary product formed by all P450 isoforms and only minor unidentified peaks were observed in addition (Fig. 2B–E). The exception was CYP26A1 when incubated in the presence of 40 pmol P450 for 30 min; under these conditions significant depletion of both RA and the 4-OH RA metabolite was observed (Fig. 2F). However, 4-OH-RA has previously been shown to be the main primary metabolite formed by CYP26A1. The kinetic characterization for all other CYPs except CYP26A1, was conducted by monitoring the 4-OH RA formation. CYP2C8, CYP3A4, CYP3A5, and CYP3A7 all exhibited typical Michaelis–Menten kinetics (Fig. 3). CYP2C8, CYP3A4, CYP3A5, and CYP3A7 all had similar kinetics with Km values in the low μM range (11.1–19.4 μM) and maximum velocities of 4–5 pmol/min/pmol P450 (Table 1). As a result they had similar intrinsic clearances (0.2–0.4 μL/min/pmol P450) which are much lower than the intrinsic clearance previously published for CYP26A1 [19]. The mean fraction unbound of RA with the supersomes was 0.54 ± 0.9, 0.37 ± 0.08, and 0.21 ± 0.04 for CYP2C8, CYP3A4, and CYP3A5, respectively. Based on these free fractions, the unbound Kms and intrinsic clearances were also determined for individual isoforms resulting in unbound intrinsic clearances of 0.56–1.42 μL/min/pmol P450 (Table 1).
Fig. 2.

Identification of P450 isoforms that metabolize RA. Panel (A) shows the velocities of 4-OH RA formation by twelve CYP isoforms incubated with 10 μM RA. Panels (B–E) depict the chromatograms identifying 4-OH RA as the primary metabolite formed by CYP2C8 (B), CYP3A4 (C), CYP3A5 (D), and CYP3A7 (E) when 40 pmol CYP was incubated with 10 μM RA for 30 min. Panel (F) shows a chromatogram from an incubation of RA with CYP26A1 using similar conditions as those used with CYP3A4, CYP2C8, CYP3A5 and CYP3A7. In contrast to the other CYP isoforms, significant depletion of RA and the primary metabolite 4-OH-RA was observed and multiple primary and secondary metabolites were detected.
Fig. 3.

Determination of enzyme kinetic constants for P450 isoforms that contribute to RA hydroxylation. 4-OH formation rates as a function of total (nominal) RA are shown for CYP2C8 (A), CYP3A4 (B), CYP3A5 (C), and CYP3A7 (D) after incubating 5 pmol CYP for 10 min. The Michaelis–Menten model was fit to the data.
Table 1.
Michaelis–Menten kinetic parameters for the formation of 4-OH RA from RA by various cytochrome P450 isoforms.
| Km (μM) | Kmu (μM) | Vmax (pmol/min/pmol P450) | Cl’int (μL/min/pmol P450) | Cl’intu (μL/min/pmol P450) | |
|---|---|---|---|---|---|
| CYP2C8 | 13.4 | 7.2 | 4.8 | 0.35 | 0.66 |
| CYP3A4 | 19.4 | 7.2 | 4.0 | 0.21 | 0.56 |
| CYP3A5 | 11.1 | 3.4 | 4.9 | 0.44 | 1.42 |
| CYP3A7 | 11.3 | n/a | 2.3 | 0.20 | n/a |
| CYP26A1a | 0.0094 | n/ab | 11.3 | 1202 | n/ab |
Kinetic parameters for CYP26A1 obtained from a previous publication [19].
Due to tight binding shown previously, CYP26A1 unbound fractions were not calculated and depletion of substrate was accounted for in the initial Michaelis–Menten fit. Hence, the total substrate concentration is assumed to be equal to the unbound concentration available to the enzyme.
3.3. Prediction of the relative contribution of CYP26A1 to RA hepatic clearance
To predict the relative contribution of CYP26A1 to hepatic clearance of RA, the contribution of CYP26A1, CYP2C8, CYP3A4 and CYP3A5 was simulated in human livers. The in vitro kinetics and unbound fractions for each of the relevant cytochrome P450 isoforms determined using recombinant P450 enzymes, the CYP26A1 protein concentrations determined in the HLM bank, and the CYP2C8, CYP3A4, and CYP3A5 concentrations previously quantified by others in the HLM bank [32,33] were applied to Eq. (1) to perform the predictions. Based on these predictions, when CYP26A1 is present, it will be the primary enzyme contributing to RA clearance at both endogenous and therapeutic concentrations (Fig. 4A–D). In the absence of CYP26A1, CYP3A will be the primary enzyme responsible for RA hydroxylation. The effect of increasing RA concentrations on the relative contribution of individual isoforms was simulated in two different HLM donors (HLM158 and HLM160) (Fig. 4C and D). Both HLM 158 and HLM 160 had moderate to high CYP26A1 (2.53 and 2.80 pmol/mg) and CYP2C8 (40.86 and 38.30 pmol/mg) expression. HLM 158 is an individual with moderate CYP3A4 and high CYP3A5 content (102.40 and 103.00 pmol/mg), whereas HLM 160 had lower CYP3A4 (57.80 pmol/mg) expression and only trace amounts of CYP3A5 (1.36 pmol/mg). The average Cmax for therapeutic administration of RA is 1.4 μM, yielding a free RA concentration of 0.014 μM [35,36]. At this concentration CYP26A1 is predicted to still be the major P450 isoform contributing to clearance of RA in both livers. As concentrations of RA exceed the typical therapeutic concentrations, the contribution of other P450 isoforms will increase. Fig. 5E shows the relationship between free RA concentration, CYP26A1 enzyme expression and total clearance of RA. As the amount of free RA concentration increases, clearance will decrease as CYP26A1 is saturated. Similarly, as the amount of CYP26A1 increases, RA clearance increases. Together these simulations predict a large inter-individual variability in RA clearance due to the variability in CYP26A1 expression and concentration dependent clearance.
Fig. 4.

The relative importance of CYP26A1 in retinoic acid clearance. The predicted total clearance and the contribution of each P450 isoform to RA hydroxylation is shown for ten HLM donor samples at 0.05 nM (A) and 14 nM (B) free RA. Each bar represents the total predicted clearance and the predicted contribution by individual P450 isoforms is indicated by colors. The predicted percent contribution of each P450 isoform over a continuous range of free RA concentrations is shown in panels (C) and (D) for two specific livers. Panel (E) shows the predicted change in RA clearance for a HLM sample with fixed CYP2C8 and CYP3A4 values as a function of varied free RA concentrations and CYP26A1 expression. Predictions were performed using Eq. (1).
Fig. 5.
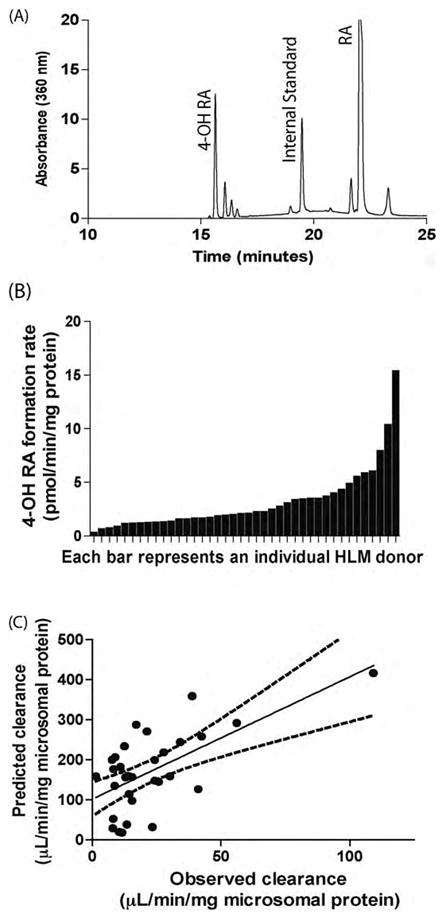
4-OH RA formation in human liver microsomes. Panel (A) is a representative chromatogram from a HLM incubation with RA showing 4-OH RA as the primary metabolite formed in HLMs. Panel (B) shows the 4-OH RA formation rates in forty different HLM samples. 0.2 mg Protein was incubated in the presence of 1 μM total RA for 30 min. Panel (C) depicts the correlation between observed RA clearance in HLMs and predicted RA clearances using supersome kinetic values and liver CYP expression levels. There was a significant correlation between the observed and predicted clearances.
3.4. RA hydroxylase activity in human liver microsomes
RA hydroxylation was measurable in all HLM samples when incubated with 1 μM RA. Similar to the incubations with individual P450 isoforms, 4-OH RA was the major metabolite formed by the HLMs (Fig. 5A) although other metabolites were also detectable. Formation velocity of 4-OH RA varied approximately 100-fold between liver donors (Fig. 5B) ranging from 0.20 to 15.28 pmol/min/mg microsomal protein (mean = 3.0 pmol/min/mg microsomal protein, median = 2.0 pmol/min/mg microsomal protein). The mean fraction unbound for the HLMs analyzed was 0.14 ± 0.01.
Fig. 5C illustrates the correlation between the predicted HLM clearance of RA based on the enzyme concentrations and experimentally determined kinetic parameters, as compared to the clearance observed in the corresponding HLM incubations. There was complete data for 31 donors, as livers with CYP26A1 protein concentrations less than 0.1 pmol were assigned as zero and included in this analysis. A significant correlation between the observed and predicted clearance in HLMs (p = 0.001) was observed, however an average 7-fold over-prediction of the clearance occurred. Using an unbound RA concentration of 0.014 μM, the mean predicted clearance for all HLMs analyzed was 171.0 ± 99.5 μL/min/mg and the mean observed clearance was 23.2 ± 20.4 μL/min/mg. For comparison, when total concentrations of RA were used in the calculations, the mean predicted clearance in HLMs was 44.7 ± 2.9 μL/min/mg, whereas the mean observed clearance was only 3.2 ± 2.9 μL/min/mg, causing a 14-fold over-prediction. The in vitro data obtained from supersomes predicted in vivo clearance of RA relatively well. The predicted in vivo hepatic clearances of RA were calculated as 0.08 and 0.01 L/min, using combined supersome or human liver microsomal clearances, respectively.
3.5. Role of individual CYP isoforms in RA hydroxylation
The role of specific CYP isoforms in RA clearance in human livers was assessed by correlation analysis between CYP isoform expression and RA hydroxylation activity. There was a significant correlation (p = 0.009) between CYP26A1 content and observed 4-OH RA formation velocity in the HLM samples analyzed when RA was incubated at 1 μM (Table 2). There was also a positive correlation between observed 4-OH RA formation and CYP3A4 (p = 0.005), and CYP3A5 (p = 0.001) content. The correlation between CYP2C8 expression and RA hydroxylation was not significant (p = 0.031). Multiple linear regression was performed to determine whether CYP26A1 and CYP3A4 both contributed to RA clearance independently (Table 3). When added to the regression with CYP26A1, CYP3A4 and CYP3A5 significantly improved the correlation whereas CYP2C8 had no effect in addition to CYP26A1. CYP26A1 protein concentrations did not correlate with either CYP3A4 (p = 0.922) or CYP3A5 (p = 0.786) protein concentrations.
Table 2.
Correlation between CYP isoform expression and 4-OH RA formation rate in HLMs.
| na | R2 | p-value | |
|---|---|---|---|
| CYP26A1 | 25 | 0.259 | 0.009 |
| CYP2C8 | 34 | 0.137 | 0.031 |
| CYP3A4 | 34 | 0.219 | 0.005 |
| CYP3A5 | 34 | 0.297 | 0.001 |
Indicates the number of HLMs used in the statistical analysis. CYP26A1 correlations exclude HLMs that quantified below the lowest calibrator.
Table 3.
Multiple linear regression statistics.
| CYP26A1 with: | na | F | p-value |
|---|---|---|---|
| CYP2C8 | 24 | 3.540 | 0.047 |
| CYP3A4 | 23 | 6.471 | 0.007 |
| CYP3A5 | 23 | 11.894 | <0.001 |
| CYP3A4 and CYP3A5 | 23 | 12.064 | <0.001 |
Indicates the number of HLMs used in the statistical analysis.
4. Discussion
The enzymes in the CYP26 family have been suggested to be the main RA hydroxylases in mammals and other chordates. Based on previously published RNA work, CYP26A1 appears to be the main liver CYP26 isoform [26]. CYP26B1 mRNA was not quantifiable in 46% of livers in the donor bank used in this study, and when detected, the amounts were significantly lower than CYP26A1 mRNA [27]. CYP26A1 has been previously demonstrated to be very efficient in metabolizing RA and has a high affinity to RA [19]. Circulating concentrations of RA in plasma are close to the Km for CYP26A1 and therefore CYP26A1 is expected to exhibit capacity limited kinetics in vivo. Based on the initial kinetic characterization of CYP26A1, two hypotheses were generated. First, if expressed in human liver, CYP26A1 will be a major contributor to RA clearance and second that as RA concentrations increase, CYP26A1 will be saturated and its contribution to overall RA clearance will decrease. The aim of this study was to determine the role of CYP26A1 in the hepatic clearance of RA and to evaluate the concentration dependence of RA clearance.
Expression of CYP26A1 protein was found in a majority of the human livers tested, although the mean expression level of 1.60 pmol/mg microsomal protein is much lower than the published expression levels of 3A4 (111 pmol/mg microsomal protein [38]) and CYP2C8 (24 pmol/mg microsomal protein [38]). The expression of CYP26A1 protein in the liver agrees well with previously published RNA data from matched HLM samples [27]. In general, those livers with high CYP26A1 mRNA also had high CYP26A1 protein. Likewise, livers with undetectable mRNA were associated with lack of CYP26A1 protein (data not shown). Previous analysis of the liver bank showed that CYP26A1 transcripts were significantly lower in ischemic livers when compared to non-ischemic livers [27]. Other environmental factors, such as age, drug use, and liver health did not explain variability in CYP26A1 mRNA levels [27]. The great variability in CYP26A1 expression between livers is expected based on the fact that RA has been shown to regulate CYP26A1 expression in liver cell lines [27], and hence different dietary and nutritional status should alter CYP26A1 expression in the liver. If CYP26A1 is required in the liver to limit exposure to excessive dietary RA, it is expected that the expression of CYP26A1 will change dynamically with RA intake to confirm tight regulation to RA exposure.
The low expression level of CYP26A1 in comparison to other P450 enzymes and the lack of detectable expression in some samples emphasize the importance of selecting high specificity antibodies for western blotting CYP26A1 expression. Special attention should be given, even with monoclonal antibodies, to the selectivity of antibodies for specific CYP enzymes, in order to prevent non-specific binding leading to false detection or over quantitation of P450.
The apparent (total) Km values determined here for CYP2C8, CYP3A4 and CYP3A5 are in agreement with previously published values despite the fact that protein binding and different protein concentrations used could change the apparent Km values between studies. Previous studies have published Km values of 1.5, 50.0, and 6.1 μM for CYP2C8, and 2.6, 34.0, and 74.0 μM for CYP3A4. The results in this study showed a Km of 13.4 μM for CYP2C8 and 19.4 μM for CYP3A4. Similarly, published Vmax values are within 10-fold of what we report here. Differences in the values are likely the result of different protein expression systems and experimental conditions used. The normal total circulating plasma concentrations of RA in the body is approximately 4 nM [34], which would correspond to a free RA concentration of 0.04 nM. When RA is administered therapeutically as tretinoin (Vesanoid®) for the treatment of acute promyelocytic leukemia (APL) [42], total RA concentrations in the plasma will range from 1 to 3 μM [35,36], which corresponds to a free concentration of 10–30 nM. The unbound Km values of CYP3As and CYP2C8 determined here are higher than the circulating concentrations of RA in plasma, whereas the Km for CYP26A1 is below the therapeutic unbound plasma concentration. Hence it is likely that saturation of CYP26A1 in vivo is responsible for the non-linear (capacity limited) clearance of RA after therapeutic administration.
Based on the results shown, CYP26A1 and CYP3A4 are the primary determinants of RA metabolism in humans, not CYP2C8 as has been previously suggested [11]. This could, in part, be explained by the use of different expression systems in previous studies and by non-specific binding affecting apparent Km values. Additionally, previous studies did not factor for differences in hepatic P450 expression or account for CYP26 enzyme contribution [9–11]. Interestingly, in contrast to previous publications, CYP2C9 was inefficient at metabolizing RA. This was confirmed in two separate lots of CYP2C9 supersomes. The dominant role of CYP26A1 in RA clearance is supported by several observations. First, the kinetic data demonstrates that CYP26A1 has a 1000-fold lower Km and as a result CYP26A1 has more than a 2500-fold higher intrinsic clearance than the other cytochrome P450 isoforms. Hence, despite its low expression level, CYP26A1 is predicted to be the main RA hydroxylase in the liver. Secondly, the metabolite profile observed in the HLMs is more similar to what has previously been published for CYP26A1 [19] than to the metabolite profiles shown here for CYP2C8 or the CYP3A subfamily, supporting the role of CYP26A1 in metabolizing RA in human liver. Third, a significant correlation between CYP26A1 expression and RA hydroxylation was observed as well as between observed RA hydroxylation and model predicted hydroxylation.
More accurate predictions of hepatic clearance of RA were obtained when unbound values were used for prediction rather than apparent (total) values. Lack of accounting for non-specific binding has, indeed, been shown to lead to significant under-predictions of in vivo hepatic clearance [43] and use of unbound rather than apparent total values is recommended. The observed 7-fold over-prediction between the predicted and observed intrinsic clearances in HLMs is not unexpected as the cytochrome P450 environment in supersomes is inherently different than that in HLMs. For example, cytochrome P450s in supersomes are co-expressed with reductase and b5 resulting in a much higher reductase to P450 ratio than that observed in HLMs. The fact that a correlation between the predicted and observed clearances was significant supports that the model accounting for individual enzymes is appropriate for predicting RA clearance. It is possible that secondary metabolites were formed from 4-OH RA in HLMs, thereby lowering the amount of 4-OH RA observed in the HLM samples, although the percent of subsequent depletion appeared small.
When the in vitro clearances were scaled to in vivo clearances, a total hepatic clearance of 0.01 and 0.07 L/min was predicted using microsomal observed or supersome data. The in vivo clearances predicted using supersome kinetic values and liver P450 expression levels, are consistent (<3-fold error) with previously reported in vivo clearances of 0.19 L/min [36], whereas values predicted using HLM kinetics resulted in >10-fold under prediction. The under prediction in RA clearance in vivo is most likely due to extrahepatic clearance of RA in vivo resulting from CYP26A1 expression in other, highly perfused tissues such as the lungs and the kidneys.
The fact that CYP26A1 is predicted to be the major, if not only, RA clearing CYP in human liver has implications in designing new specific inhibitors of RA clearance, better known as RA metabolism blocking agents (RAMBAs). Based on the results of this study, an optimal design for a RAMBA would be a compound that is a specific and potent inhibitor of CYP26A1, but does not inhibit the other cytochrome P450 isoforms.
The findings of this study can be used to rationalize observed drug–drug interactions between azole antifungals and RA. In two adult APL patients, treatment with fluconazole caused a 2- to 4-fold increase in RA AUC [44]. In another case study, RA toxicity was observed in a four-year-old APL patient after co-administration of fluconazole [45]. A 70% dose reduction of RA was required during the duration of fluconazole treatment. Similarly, the AUC of RA was increased approximately two-fold higher after ketoconazole administration [46]. It was originally suggested that the azole antifungals were inhibiting CYP3A4 or CYP2C9 leading to accumulation of RA in the patients. Given that the APL patients receiving therapeutic doses of RA would have induced CYP26A1 expression, based on the data presented, CYP3A4 is expected to minimally contribute to RA clearance in the APL patients and these azoles are likely inhibiting CYP26A1 in vivo.
In conclusion, this study has shown that CYP26A1 is expressed in human liver and its expression correlates with RA hydroxylation. In the absence of CYP26A1 expression, CYP3A4 and CYP3A5 are predicted to be the main RA hydroxylases and their expression also correlated with RA hydroxylation. The kinetic characterization of cytochrome P450 isoforms contributing to human liver RA clearance allowed quantitative predictions of the in vivo clearance of RA and effectively predicted the capacity limited kinetics of RA in vivo. These results suggest that the in vivo clearance of RA can be blocked by specific inhibitors of CYP26A1.
Supplementary Material
Acknowledgments
This work was supported in part by NIH grants T32 GM007750, P01 GM32165, and R01 GM081569. While the cytochrome P450 concentrations for CYP2C8, CYP3A4, and CYP3A5 used in the predictions for individual HLMs have been previously reported [32,33], we thank Dr. Rheem Totah, University of Washington, Department of Medicinal Chemistry and Dr. Yvonne Lin, University of Washington, Department of Pharmaceutics for providing us a matched list of the concentrations to the specific HLM donor number so that we could perform a side-by-side analysis of CYP26A1 with the other cytochrome P450 isoforms. Dr. Rüdiger Kaspera, Mariko Nakano, and Caleb Woods, from the Department of Medicinal Chemistry, kindly provided purified protein. For their tutorials and assistance with modeling and statistical packages, the authors wish to thank, Dr. Justin Lutz, Dr. Chi-Chi Peng, and Alysa Walker, Department of Pharmaceutics, University of Washington.
Appendix A. Supplementary data
Supplementary data associated with this article can be found, in the online version, at doi:10.1016/j.bcp.2010.05.023.
References
- 1.Tzimas G, Nau H. The role of metabolism and toxicokinetics in retinoid teratogenesis. Curr Pharm Des. 2001;7:803–31. doi: 10.2174/1381612013397708. [DOI] [PubMed] [Google Scholar]
- 2.Marill J, Idres N, Capron CC, Nguyen E, Chabot GG. Retinoic acid metabolism and mechanism of action: a review. Curr Drug Metab. 2003;4:1–10. doi: 10.2174/1389200033336900. [DOI] [PubMed] [Google Scholar]
- 3.Duester G. Retinoic acid synthesis and signaling during early organogenesis. Cell. 2008;134:921–31. doi: 10.1016/j.cell.2008.09.002. [DOI] [PMC free article] [PubMed] [Google Scholar]
- 4.World_Health_Organization. Macronutrient deficiencies: vitamin A deficiency. [cited 2009 April 4]; Available from: http://www.who.int/nutrition/topics/vad/en/index.html.
- 5.Wolbach SB, Howe PR. Tissue changes following deprivation of fat-soluble A vitamin. Exp Med. 1925;42:753–77. doi: 10.1084/jem.42.6.753. [DOI] [PMC free article] [PubMed] [Google Scholar]
- 6.Shudo K, Fukasawa H, Nakagomi M, Yamagata N. Towards retinoid therapy for Alzheimer’s disease. Curr Alzheimer Res. 2009;6:302–11. doi: 10.2174/156720509788486581. [DOI] [PMC free article] [PubMed] [Google Scholar]
- 7.Blomhoff R, Blomhoff HK. Overview of retinoid metabolism and function. J Neurobiol. 2006;66:606–30. doi: 10.1002/neu.20242. [DOI] [PubMed] [Google Scholar]
- 8.Napoli JL. Biochemical pathways of retinoid transport, metabolism, and signal transduction. Clin Immunol Immunopathol. 1996;80:S52–62. doi: 10.1006/clin.1996.0142. [DOI] [PubMed] [Google Scholar]
- 9.Marill J, Cresteil T, Lanotte M, Chabot GG. Identification of human cytochrome P450s involved in the formation of all-trans-retinoic acid principal metabolites. Mol Pharmacol. 2000;58:1341–8. doi: 10.1124/mol.58.6.1341. [DOI] [PubMed] [Google Scholar]
- 10.McSorley LC, Daly AK. Identification of human cytochrome P450 isoforms that contribute to all-trans-retinoic acid 4-hydroxylation. Biochem Pharmacol. 2000;60:517–26. doi: 10.1016/s0006-2952(00)00356-7. [DOI] [PubMed] [Google Scholar]
- 11.Nadin L, Murray M. Participation of CYP2C8 in retinoic acid 4-hydroxylation in human hepatic microsomes. Biochem Pharmacol. 1999;58:1201–8. doi: 10.1016/s0006-2952(99)00192-6. [DOI] [PubMed] [Google Scholar]
- 12.Frolik CA, Roberts AB, Tavela TE, Roller PP, Newton DL, Sporn MB. Isolation and identification of 4-hydroxy- and 4-oxoretinoic acid. In vitro metabolites of all-trans-retinoic acid in hamster trachea and liver. Biochemistry. 1979;18:2092–7. doi: 10.1021/bi00577a039. [DOI] [PubMed] [Google Scholar]
- 13.White JA, Guo YD, Baetz K, Beckett-Jones B, Bonasoro J, Hsu KE, et al. Identification of the retinoic acid-inducible all-trans-retinoic acid 4-hydroxylase. J Biol Chem. 1996;271:29922–7. doi: 10.1074/jbc.271.47.29922. [DOI] [PubMed] [Google Scholar]
- 14.Chen H, Fantel AG, Juchau MR. Catalysis of the 4-hydroxylation of retinoic acids by cyp3a7 in human fetal hepatic tissues. Drug Metab Dispos. 2000;28:1051–7. [PubMed] [Google Scholar]
- 15.Chithalen JV, Luu L, Petkovich M, Jones G. HPLC-MS/MS analysis of the products generated from all-trans-retinoic acid using recombinant human CYP26A. J Lipid Res. 2002;43:1133–42. doi: 10.1194/jlr.m100343-jlr200. [DOI] [PubMed] [Google Scholar]
- 16.Fiorella PD, Napoli JL. Microsomal retinoic acid metabolism. Effects of cellular retinoic acid-binding protein (type I) and C18-hydroxylation as an initial step. J Biol Chem. 1994;269:10538–44. [PubMed] [Google Scholar]
- 17.Tzimas G, Collins MD, Burgin H, Hummler H, Nau H. Embryotoxic doses of vitamin A to rabbits result in low plasma but high embryonic concentrations of all-trans-retinoic acid: risk of vitamin A exposure in humans. J Nutr. 1996;126:2159–71. doi: 10.1093/jn/126.9.2159. [DOI] [PubMed] [Google Scholar]
- 18.Gundersen TE, Bastani NE, Blomhoff R. Quantitative high-throughput determination of endogenous retinoids in human plasma using triple-stage liquid chromatography/tandem mass spectrometry. Rapid Commun Mass Spectrom. 2007;21:1176–86. doi: 10.1002/rcm.2946. [DOI] [PubMed] [Google Scholar]
- 19.Lutz JD, Dixit V, Yeung CK, Dickmann LJ, Zelter A, Thatcher JE, et al. Expression and functional characterization of cytochrome P450 26A1, a retinoic acid hydroxylase. Biochem Pharmacol. 2009;77:258–68. doi: 10.1016/j.bcp.2008.10.012. [DOI] [PMC free article] [PubMed] [Google Scholar]
- 20.Thatcher JE, Isoherranen N. The role of CYP26 enzymes in retinoic acid clearance. Expert Opin Drug Metab Toxicol. 2009;5:875–86. doi: 10.1517/17425250903032681. [DOI] [PMC free article] [PubMed] [Google Scholar]
- 21.White JA, Ramshaw H, Taimi M, Stangle W, Zhang A, Everingham S, et al. Identification of the human cytochrome P450. P450RAI-2, which is predominantly expressed in the adult cerebellum and is responsible for all-trans-retinoic acid metabolism. Proc Nat Acad Sci USA. 2000;97:6403–8. doi: 10.1073/pnas.120161397. [DOI] [PMC free article] [PubMed] [Google Scholar]
- 22.Taimi M, Helvig C, Wisniewski J, Ramshaw H, White J, Amad M, et al. A novel human cytochrome P450, CYP26C1, involved in metabolism of 9-cis and all-trans isomers of retinoic acid. J Biol Chem. 2004;279:77–85. doi: 10.1074/jbc.M308337200. [DOI] [PubMed] [Google Scholar]
- 23.Lee SJ, Perera L, Coulter SJ, Mohrenweiser HW, Jetten A, Goldstein JA. The discovery of new coding alleles of human CYP26A1 that are potentially defective in the metabolism of all-trans retinoic acid and their assessment in a recombinant cDNA expression system. Pharmacogenet Genomics. 2007;17:169–80. doi: 10.1097/FPC.0b013e32801152d6. [DOI] [PMC free article] [PubMed] [Google Scholar]
- 24.Abu-Abed S, Dolle P, Metzger D, Beckett B, Chambon P, Petkovich M. The retinoic acid-metabolizing enzyme. CYP26A1, is essential for normal hind-brain patterning, vertebral identity, and development of posterior structures. Genes Dev. 2001;15:226–40. doi: 10.1101/gad.855001. [DOI] [PMC free article] [PubMed] [Google Scholar]
- 25.Yashiro K, Zhao X, Uehara M, Yamashita K, Nishijima M, Nishino J, et al. Regulation of retinoic acid distribution is required for proximodistal patterning and outgrowth of the developing mouse limb. Dev Cell. 2004;6:411–22. doi: 10.1016/s1534-5807(04)00062-0. [DOI] [PubMed] [Google Scholar]
- 26.Xi J, Yang Z. Expression of RALDHs (ALDH1As) and CYP26s in human tissues and during the neural differentiation of P19 embryonal carcinoma stem cell. Gene Expr Patterns. 2008;8:438–42. doi: 10.1016/j.gep.2008.04.003. [DOI] [PubMed] [Google Scholar]
- 27.Tay S, Dickmann L, Dixit V, Isoherranen N. A comparison of the roles of peroxisome proliferator-activated receptor and retinoic acid receptor on CYP26 regulation. Mol Pharmacol. 2010;77:218–27. doi: 10.1124/mol.109.059071. [DOI] [PMC free article] [PubMed] [Google Scholar]
- 28.Shen AL, Porter TD, Wilson TE, Kasper CB. Structural analysis of the FMN binding domain of NADPH-cytochrome P-450 oxidoreductase by site-directed mutagenesis. J Biol Chem. 1989;264:7584–9. [PubMed] [Google Scholar]
- 29.Yeung CK, Lang DH, Thummel KE, Rettie AE. Immunoquantitation of FMO1 in human liver, kidney, and intestine. Drug Metab Disp. 2000;28:1107–11. [PubMed] [Google Scholar]
- 30.Paine MF, Khalighi M, Fisher JM, Shen DD, Kunze KL, Marsh CL, et al. Characterization of interintestinal and intraintestinal variations in human CYP3A-dependent metabolism. J Pharmacol Exp Ther. 1997;283:1552–62. [PubMed] [Google Scholar]
- 31.Nakai D, Kumamoto K, Sakikawa C, Kosaka T, Tokui T. Evaluation of the protein binding ratio of drugs by a micro-scale ultracentrifugation method. J Pharm Sci. 2004;93:847–54. doi: 10.1002/jps.20012. [DOI] [PubMed] [Google Scholar]
- 32.Naraharisetti SB, Lin YS, Rieder M, Marciante K, Psaty BM, Thummel KE, et al. Human Liver Expression of CYP2C8: gender, age and genotype effects. Drug Metab Dispos. 2010;38:889–93. doi: 10.1124/dmd.109.031542. [DOI] [PMC free article] [PubMed] [Google Scholar]
- 33.Lin YS, Dowling AL, Quigley SD, Farin FM, Zhang J, Lamba J, et al. Co-regulation of CYP3A4 and CYP3A5 and contribution to hepatic and intestinal midazolam metabolism. Mol Pharmacol. 2002;62:162–72. doi: 10.1124/mol.62.1.162. [DOI] [PubMed] [Google Scholar]
- 34.Eckhoff C, Nau H. Identification and quantitation of all-trans- and 13-cis-retinoic acid and 13-cis-4-oxoretinoic acid in human plasma. J Lipid Res. 1990;31:1445–54. [PubMed] [Google Scholar]
- 35.Package insert for Vesanoid (R) (tretinoin capsules): Roche Pharmaceuticals. Roche Laboratories Inc; 2000. [Google Scholar]
- 36.Ozpolat B, Lopez-Berestein G, Adamson P, Fu CJ, Williams AH. Pharmacokinetics of intravenously administered liposomal all-trans-retinoic acid (ATRA) and orally administered ATRA in healthy volunteers. J Pharm Pharm Sci. 2003;6:292–301. [PubMed] [Google Scholar]
- 37.Mendes P. GEPASI: a software package for modelling the dynamics, steady states and control of biochemical and other systems. Comput Appl Biosci. 1993;9:563–71. doi: 10.1093/bioinformatics/9.5.563. [DOI] [PubMed] [Google Scholar]
- 38.Rostami-Hodjegan A, Tucker GT. Simulation and prediction of in vivo drug metabolism in human populations from in vitro data. Nat Rev. 2007;6:140–8. doi: 10.1038/nrd2173. [DOI] [PubMed] [Google Scholar]
- 39.Wilkinson GR. Clearance approaches in pharmacology. Pharmacol Rev. 1987;39:1–47. [PubMed] [Google Scholar]
- 40.Barter ZE, Bayliss MK, Beaune PH, Boobis AR, Carlile DJ, Edwards RJ, et al. Scaling factors for the extrapolation of in vivo metabolic drug clearance from in vitro data: reaching a consensus on values of human microsomal protein and hepatocellularity per gram of liver. Curr Drug Metab. 2007;8:33–45. doi: 10.2174/138920007779315053. [DOI] [PubMed] [Google Scholar]
- 41.Obach RS. Nonspecific binding to microsomes: impact on scale-up of in vitro intrinsic clearance to hepatic clearance as assessed through examination of warfarin, imipramine, and propranolol. Drug Metab Dispos. 1997;25:1359–69. [PubMed] [Google Scholar]
- 42.Huang ME, Ye YC, Chen SR, Chai JR, Lu JX, Zhoa L, et al. Use of all-trans retinoic acid in the treatment of acute promyelocytic leukemia. Blood. 1988;72:567–72. [PubMed] [Google Scholar]
- 43.Venkatakrishnan K, von Moltke LL, Obach RS, Greenblatt DJ. Drug metabolism and drug interactions: application and clinical value of in vitro models. Curr Drug Metab. 2003;4:423–59. doi: 10.2174/1389200033489361. [DOI] [PubMed] [Google Scholar]
- 44.Schwartz EL, Hallam S, Gallagher RE, Wiernik PH. Inhibition of all-trans-retinoic acid metabolism by fluconazole in vitro and in patients with acute promyelocytic leukemia. Biochem Pharmacol. 1995;50:923–8. doi: 10.1016/0006-2952(95)00213-j. [DOI] [PubMed] [Google Scholar]
- 45.Vanier KL, Mattiussi AJ, Johnston DL. Interaction of all-trans-retinoic acid with fluconazole in acute promyelocytic leukemia. J Pediatr Hematol Oncol. 2003;25:403–4. doi: 10.1097/00043426-200305000-00010. [DOI] [PubMed] [Google Scholar]
- 46.Rigas JR, Francis PA, Muindi JR, Kris MG, Huselton C, DeGrazia F, et al. Constitutive variability in the pharmacokinetics of the natural retinoid, all-trans-retinoic acid, and its modulation by ketoconazole. J Nat Cancer Inst. 1993;85:1921–6. doi: 10.1093/jnci/85.23.1921. [DOI] [PubMed] [Google Scholar]
Associated Data
This section collects any data citations, data availability statements, or supplementary materials included in this article.