Abstract
It has been shown that the Earth’s inner core has an axisymmetric anisotropic structure with seismic waves traveling ∼3% faster along polar paths than along equatorial directions. Hemispherical anisotropic patterns of the solid Earth’s core are rather complex, and the commonly used hexagonal-close-packed iron phase might be insufficient to account for seismological observations. We show that the data we collected are in good agreement with the presence of two anisotropically specular east and west core hemispheres. The detected travel-time anomalies can only be disclosed by a lattice-preferred orientation of a body-centered-cubic iron aggregate, having a fraction of their [111] crystal axes parallel to the Earth’s rotation axis. This is compelling evidence for the presence of a body-centered-cubic Fe phase at the top of the Earth’s inner core.
Keywords: elastic anisotropy, Fe-bcc/-hcp, PKiKP/PKIKP waves, molecular dynamics
The Earth’s inner core (IC) is a small spherical body (with a radius of 1,200 km) located at the center of our home planet. Since its discovery in the late 1936 by Inge Lehmann (1), it has long been the most out of reach and enigmatic place of the Earth. Through comparison of the equation of state to seismic data and the abundance of iron, it has been established that the solid IC mainly consists of iron (2–4). The growth of the IC from the freezing of the molten iron alloy at the inner-core boundary (ICB) (5) drives the convection in the outer core and provides the energy source for the geodynamo (6). From the analysis of the normal modes of the Earth’s free oscillations and the body wave data, it has been found that compressional P waves travel about 3% faster along the Earth’s spin axis than in the equatorial plane (7–10). The growing evidence of an elastic anisotropic IC has continued to generate interesting understandings of the deepest part of our planet, though not all the scientific efforts have converged to the same scenario. Surprisingly, the picture has become more and more confusing as further observations have been collected (7). Explaining the anisotropic IC behavior within a unified and well-accepted geophysical model has become an increasingly complicated issue. Nowadays, we know that the Earth’s inner core has a rather complex three-dimensional structure, where texture (11–13) and degree of seismic anisotropy (14–20) change considerably with depth. The most recent view of the solid core corresponds to an uppermost isotropic layer characterized by faster P waves in the eastern hemisphere than in the western one (15, 21, 22). Although the existence of an outermost isotropic layer has somewhat been questioned (23, 24), more consensus has been reached about the presence of a deeper and more anisotropic region (13, 16, 25).
Different mechanisms have been proposed to explain the IC anisotropy (26, 27), though most of them have firmly relied on the lattice-preferred orientation (LPO) of both the hexagonal-close-packed (hcp) (12, 28–31) and the body-centered-cubic (bcc) iron crystals (32). The c axis of the hexagonal iron has been either oriented parallel (33) or perpendicular (12, 34, 35) to the Earth’s spin axis, so as to account for the difference in the polar and equatorial seismic velocities. However, the Fe hcp becomes close to the ideal c/a ratio of 1.6299 at the temperature of the IC (36, 37), thus vanishing the topological low-temperature elastic anisotropy of the hexagonal phase (33). Therefore, other iron phases have to be taken into account to address the IC anisotropy. A likely candidate is the body-centered-cubic iron, which is a stable phase at the Earth’s inner-core conditions either as a pure element (36, 38, 39) or alloyed with silicon (40–42). Hence, it is of primary interest to compute how the LPO of bcc might explain the selected seismic data. In addition, at the ideal c/a value, the Fe hcp becomes very similar to the face-centered-cubic (fcc) crystal, and therefore we do not consider here the fcc iron as a possible candidate for explaining the elastic anisotropy of the IC.
To address which type of iron lattice best accounts for inner-core properties, one needs reliable seismic observations and a good knowledge of the elastic properties of different iron phases. Then, from comparison of these two sets, one can establish which crystal lattice is likely to be responsible for the measured seismic data. This is exactly what our study is aimed at.
Model
Seismic Data Selection and Handpicking Method.
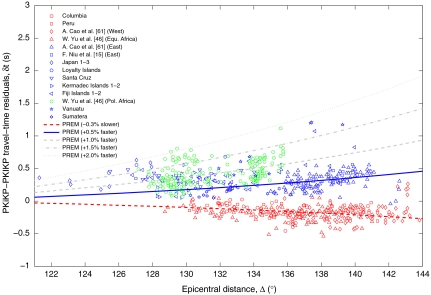
Constraining the seismic velocity in the uppermost portion of the IC is a key issue for understanding the crystalline structure of the solid Earth’s core, its dynamics and growth, and the influence on the geomagnetic field. The waveforms of the PKIKP (PKPdf) and PKiKP (PKPcd) phases observed at the epicentral distance (Δ) range of 120°–145° have been used to constrain the seismic structure in the top 100 km of the Earth’s inner core. The ray paths of P wave transmitted (PKIKP) through the inner core and the one reflected off (PKiKP) the ICB are very similar along the mantle and outer core, thus similarly affecting the PKIKP and the PKiKP phases (15). Our seismic data have been acquired from the recordings in the Global Seismographic Network of the Incorporated Research Institutions for Seismology Consortium and in the J-array network (43) for the period 1994–2009 (Table 1). Specifically, we searched for intermediate and deep events (focal depth ≥97 km and Mw≥5.7) that have shorter time functions and higher signal-to-noise ratios than shallow earthquakes. A total of 224 pairs of high-quality PKiKP and PKIKP observations have been selected on the basis of the above criteria. Broadband seismograms have been bandpass filtered with the World-Wide Standard Seismograph Network short-period instrument response. The waveform modeling technique (15, 22, 45) has been adopted for the handpicking criteria to avoid problems of small separation and interference between the PKIKP and PKiKP phases. The observed PKiKP-PKIKP travel-time residuals (δt) are shown in Fig. 1, together with earlier reported seismic data. Apart from possible small-scale heterogeneities (47) and a bumpy ICB (48, 49), a clear difference between the eastern and western hemisphere has been found. Seismic waves that sample the eastern hemisphere of the inner core can be adjusted by a model velocity that is 0.5–2.0% faster than Preliminary Reference Earth Model (PREM), whereas those which passed through the western hemisphere can be modeled by a model velocity that is 0.3% slower than PREM. The data show that the western hemisphere is definitely more homogeneous than the eastern one, a result that agrees quite well with previous works (15). Instead, the eastern portion of the IC shows δt values that are more scattered, which is a clear sign of an higher degree of heterogeneity. The highest positive residuals reported correspond to the so-called polar African anomalies (46). The striking feature here is that Africa is being considered to belong to the geographic division of the western hemisphere, and therefore should have negative differential travel-time residuals. This applies to the equatorial African data of Fig. 1, but not to the polar directions. These unusual polar-equatorial differences have initially been attributed to seismic anisotropy in the upper portion of the IC (46).
Table 1.
List of seismic events used in this study
| Origin time, GMT | Location (lat., °N, long., °E] | depth, km | Time | Mw | Responding networks | No. of stations | Azimuth range, ° |
| 04/26/1999 | Colombia (−1.65, −77.78) | 164 | 18:17:26.2 | 5.9 | J-array | 56 | 318.12–323.65 |
| 11/16/2007 | Peru (−2.50, −78.00) | 123 | 03:13:00.1 | 6.8 | J-array | 29 | 318.50–321.90 |
| 08/09/2009 | Japan 1 (33.14, 138.04) | 303 | 10:55:56.4 | 7.1 | GT, IU, II | 4 | 252.91–269.04 |
| 08/12/2009 | Japan 2 (32.76, 140.37) | 97 | 22:48:56.4 | 6.7 | GT, IU, II | 2 | 253.05–270.01 |
| 07/23/2008 | Japan 3 (39.79, 141.43) | 112 | 15:26:20.4 | 6.8 | GT, II, IU | 3 | 259.43–276.08 |
| 01/04/1998 | Loyalty Islands (−22.30, 170.91) | 101 | 06:11:58.9 | 7.5 | GE, II, G, IU | 7 | 248.94–293.23 |
| 08/22/1994 | Santa Cruz (−11.51, 166.45) | 142 | 17:26:37.5 | 6.2 | XD, IU | 21 | 238.13–257.31 |
| 12/27/1994 | Kermadec Islands 1 (−31.97, 179.86) | 212 | 17:32:50.8 | 6.4 | XD, II | 9 | 223.11–294.12 |
| 05/03/1997 | Kermadec Islands 2 (−31.79, −179.38) | 108 | 16:46:02.0 | 6.9 | G, GE | 1 | 233.76–252.21 |
| 12/18/1994 | Fiji Islands 1 (−17.86, 178.69) | 551 | 20:38:32.6 | 5.7 | XD | 14 | 233.00–241.00 |
| 11/09/2009 | Fiji Islands 2 (−17.16, 178.40) | 575 | 10:44:53.8 | 6.8 | GB, GT, GE, II, IU | 34 | 121.04–359.69 |
| 01/09/2001 | Vanuatu (−14.93, 167.17) | 103 | 16:49:28.0 | 7.0 | GE | 9 | 296.86–340.68 |
| 07/10/2000 | Sumatera (−4.47, 103.76) | 105 | 10:39:39.0 | 5.8 | XM, CI, AZ | 35 | 39.09–47.98 |
All measurements and data treating processes were carried out by means of the Seismic Analysis Code (44).
Fig. 1.
PKiKP-PKIKP travel-time residuals versus epicentral distances for ray paths spanning a turning depth point ranging from 1.72 to 107.14 km (Δ = 121.29°–143.82°). The uncertainty in picking is ± 0.1 s. Differential travel-time residuals have been calculated with respect to the isotropic PREM (3). Blue and red symbols indicate the eastern and the western hemisphere, respectively. Green open symbols refer to the polar data beneath Africa (46). Positive (negative) travel-time residuals show higher (lower) seismic velocity in the top part of the Earth’s IC compared to PREM. The thick solid (dashed) line indicates the predicted PKiKP-PKIKP travel-time residuals by using a PREM-like model 0.5% faster (0.3% slower).
Inner-core anisotropy.
To investigate the elastic anisotropy of the outermost part of the IC, we applied the Transversely Isotropic Model (7–9) to both bcc and hcp polycrystalline aggregates of iron. For the hexagonal system, we assumed a polycrystalline aggregate having the [001] axes (i.e., the c axis) oriented along the Earth’s rotation axis, whereas for the bcc textural model, we adopted an aggregate with the [111] axes [i.e., the main diagonal (32)] aligned with the Earth’s spin axis. An appropriate correlation of the observed travel-time residuals [δt(Δ,ξ)] with the ray-angles (ξ) can be achieved through Eqs. 1 and 2:
 |
[1] |
 |
[2] |
where the cij are the polycrystalline elastic constants given in Table 2, Vpo the Voigt–Reuss–Hill averaged velocity (50–52), ρ the density, and t(Δ) the PREM travel time of PKIKP wave inside the inner core. For the cubic aggregate  , we analyzed the western (eastern) hemispherical travel-time anomalies by making use of a negative (positive) sign in Eq. 2. The proposed anisotropic model (Eqs. 1 and 2) assumes a common (i.e., specular) elastic behavior for the two shallower core hemispheres, where each side is then corrected by an ad hoc isotropic velocity shift parameter (μhem). The latter term acts on the ray-angle modulated velocity [Vp(ξ)] accounting for the observed hemispherical travel-time variations of PKIKP inside the Earth’s inner core.
Table 2.
Calculated elastic properties of single-crystal hcp and bcc iron and for a cylindrically averaged bcc aggregate ( )
)
| Parameter | hcp* | bcc |  |
| c11, GPa | 1,700.4 | 1,561.5 | 1,870.3 |
| c12 | 1,251.5 | 1,448.1 | 1,345.2 |
| c44 | 200.1 | 365.5 | 159.7 |
| c13 | 1,025.0 | — | 1,242.3 |
| c33 | 1,768.7 | — | 1,973.3 |
| ρ, g/cm3 | 13.543 | 13.559 | — |
| Vpo, km/s | 10.9667 | 11.2760 | — |
| δVp† | 0.2955 | −0.0138 | — |
*Note that the hcp textural model is elastically indistinguishable from a single crystal.
†Difference between the PREM velocity in the Earth’s center (11.2622 km/s) and the calculated Vpo value.
Calculation of the Elastic Constants.
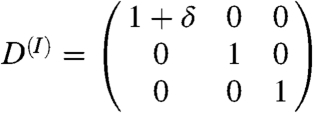
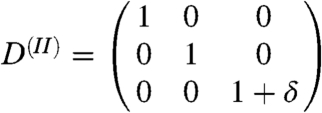
The single-crystal elastic constants that are entering in this model have been computed at the conditions of the IC (P = 364 GPa and T = 6000 K) by using the projector-augmented wave method (53) within the molecular dynamics (MD) approach. The elastic constants have been determined from the generalized form of Hooke’s law σij = cijklεkl, where σij stands for the stresses, cijkl for the elastic moduli, and εkl for the strains. The calculated time-averaged stresses associated with strains applied to the 4 × 4 × 4 hcp-based supercell (128 atoms) have been used. The size of the unit cell a = 2.1498 Å and the c parameter were optimized to get hydrostatic pressure at high temperature. To obtain the five nonzero cijkl of the hexagonal cells (namely, c11, c33, c44, c12, and c13) the five deformation matrixes [ ] shown below were applied with distortions, δ, of ± 2% and ± 4%:
 |
[3] |
 |
[4] |
 |
[5] |
 |
[6] |
 |
[7] |
MD runs have been carried out for the nonstrained as well as for the 20 strained configurations. The systems have been equilibrated for 8,000 time steps and then 8,000 time steps have been used to accumulate the averages. The time step was equal to 0.5 fs. The bcc elastic constants have been computed earlier (54). The hcp elastic constants have been calculated in the present work in a way similar to the approach applied by L. Vočadlo (55). However, to get the constants as precise as possible, the following improvements have been introduced. First, we optimized the c/a ratio directly from several MD runs and obtained at 6,000 K c/a = 1.627. Vočadlo (55) used c/a = 1.6 as obtained from the particle-in-cell treatment (comparably inexpensive approximate method). Note, that at 7,000 K c/a becomes ideal and hcp anisotropy basically vanishes. Second, we run a bigger system for longer times. Third, we treated explicitly 14 valence electrons. The temperature we have chosen for the core (6,000 K) is perhaps too low. Indeed, the latest quantum Monte Carlo simulations (56) confirmed the earlier prediction of high melting temperature of iron (57). At pressures of IC (3.3–3.64 Mbar) iron melts above 7,100 K. However, we keep the temperature at 6,000 K to be on the conservative side of the IC temperatures estimate. This makes the hcp phase more anisotropic, therefore all the conclusions that follow will be even more valid at 7,000 K. All the elastic constants we use are summarized in Table 2.
Results
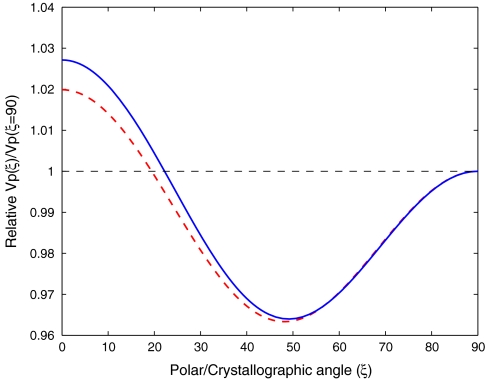
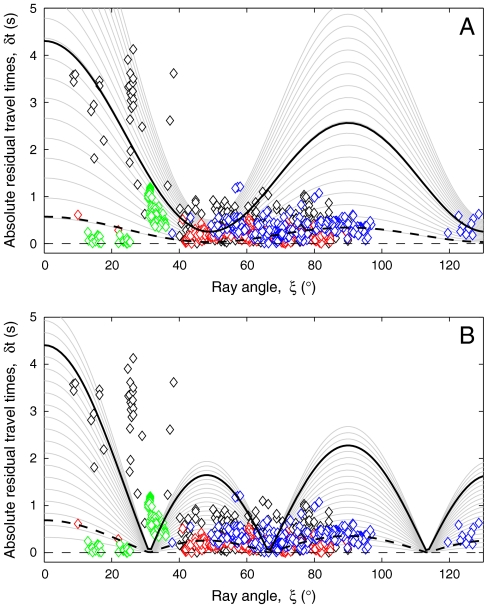
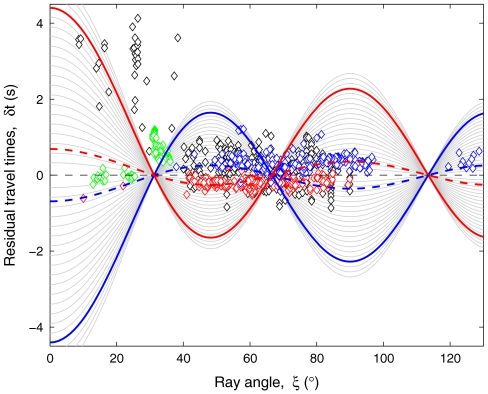
Theoretical hcp and bcc velocity curves for polycrystalline texture in the solid core are shown in Fig. 2. An important dissimilarity between these two models has been found on the lower ray-angle region, on which the bcc aggregate has the steepest velocity variation. The hcp textural-type yields a polar-equatorial velocity difference of 1.95%, whereas the bcc model is 0.69% higher (2.64%). Therefore, the latter aggregate is definitely in better agreement with the well-known 3% value reported from geophysical data (7). It should be remembered, however, that small amounts of light elements are likely alloying the iron metal at the IC conditions, thus further affecting the overall elastic anisotropy pattern. The minimum velocity is achieved at ξ = 48.2° and ξ = 49.1° for hcp and bcc Fe phase, respectively. In either case, the lowest velocity angle is somehow overestimated with respect to experimental results on iron at high pressures [ξ = 45° (58)]. The comparison between the two texturing models and the seismic observations is shown in Fig. 3. The cubic aggregate (Fig. 3A) is in good agreement with the observed seismic anomalies, whereas a shortcoming description is provided by the hexagonal model (Fig. 3B). The seismic data bottoming between the 0–100 km of the IC are binned at Δ = 130° and are reasonably well reproduced by a bcc iron aggregate having 25% of LPO. That is, the hemispherically averaged topmost layer of the Earth’s IC can be modeled by a bcc iron aggregate with 25 ± 2% of its [111] crystal axes aligned along the Earth’s spin axis, whereas the rest are randomly oriented. Reliable and consistent results have also been accomplished when considering the datasets of Creager (8) and Song and Helmberger (59) which are centered at Δ = 150° and are sampling a deeper IC portion (100–300 km). At the epicentral distance of 150°, the magnitude of the calculated polar (8.6 s) and equatorial (5.1 s) travel-time anomalies are somewhat overestimated by the bcc aggregate with respect to observations. Nevertheless, an excellent agreement with the seismic signals is achieved by considering half of the Fe-bcc crystals oriented along the Earth’s spin axis. The attained Fe-bcc elastic anisotropy pattern for the IC is remarkably similar to that observed seismologically (Fig. 3A). The needed 50% of LPO for bcc is a much less severe requirement than initially proposed for the zero-temperature hcp iron (33), where the entire single crystal has to be oriented along the spin axis of the Earth. Besides, a solid inner core made of a single hcp crystal is unlikely to exists, as the iron grain-coarsening rate at IC conditions has been computed to be always lower than the inner-core growing rate (60).
Fig. 2.
Vp velocity models for both bcc (solid blue) and hcp (dashed red) iron relative to their equatorial velocities [Vp(ξ = 90°)]. The ray angle ξ defines the angle between the inner-core leg of the PKIKP ray path and the Earth’s rotation axis.
Fig. 3.
(A) Absolute PKiKP-PKIKP differential travel-times (|δt|) as a function of ray angles for a cylindrically averaged bcc aggregate ( ). The solid gray lines show the Transversely Isotropic Model curves, where the t parameter ranges between 7.799 and 123.234 s, so as to cover the entire interval of observed epicentral distances (Δ = 125°–150°). The shallower (deeper) curve refers to a PKIKP ray path that has the smallest (largest) travel time inside the inner core. The blue (red) open diamonds show the same eastern (western) differential travel-time data of Fig. 1. The polar African anomalies (46) and the datasets of Creager (8) and Song and Helmberger (59) are also shown as green and black open diamonds, respectively. Recall that the ray paths analyzed in refs. 8 and 59 turn at ∼100–300 km beneath the Earth ICB and are centered near Δ = 150°. The solid (dashed) black lines are the predicted travel-time anomalies for Δ = 150° (Δ = 130°) when considering 50% (25%) of the Fe-bcc crystals aligned along the Earth’s spin axis. (B) Absolute PKiKP-PKIKP travel-time residuals versus ray angles for a cylindrically averaged hcp aggregate. The solid gray lines are referring to the transversely isotropic hcp model, and the seismic datasets are the same as in A. The solid (dashed) black lines are the predicted absolute δt anomalies for Δ = 150° (Δ = 130°) when considering 85% (50%) of LPO for the Fe-hcp crystals.
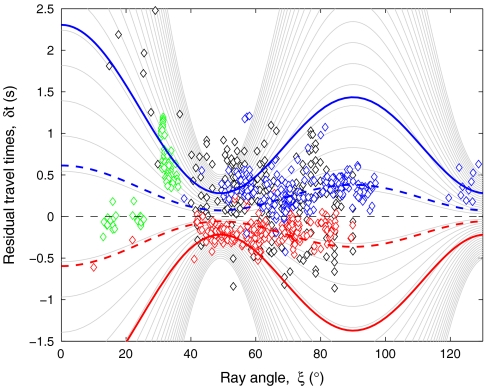
The hcp-Fe model produces nodes (at ξ = 31.5°, 67.0°, 112.9°, etc.) that are pointing to precise ray-angle values with vanishing differential travel-time residuals (Fig. 3B). Such a behavior does not fully fit with the reported seismic data. However, the limitation of the hexagonal model becomes clearer at polar ray angles (20° ≤ ξ ≤ 40°), where both the dataset of Creager (8) and the African anomalies lay outside the upper bound of the hcp aggregate. Therefore, the bcc textural model seems to be the best candidate for describing the anisotropy of the topmost IC. As a passing remark, the calculated Vpo value for Fe-bcc matches better to the PREM velocity in the Earth’s center than hcp (Table 2). Additionally, the Fe-bcc texturing type clearly accounts for an uppermost (top 100 km) anisotropic western and eastern hemisphere (Fig. 4), where both positive and negative travel-time anomalies are reproduced by an aggregate having 25% of lattice-preferred oriented iron bcc crystals. This is not the case when employing an hcp aggregate (Fig. 5). Thus, the shallower hemispherical layers of the IC can be adjusted by a cubic polycrystalline aggregate using the same LPO percentage, though they bear a clear difference in their travel-time arrivals. A commonly accepted idea (15, 61) is that the western inner core is characterized by slower PKIKP arrivals and higher attenuation factors (Qα), whereas the eastern hemisphere has rather faster P-wave propagation and low Qα (Fig. 1). The reason behind this resides on the fact that the real seismic velocity pattern does not correspond to an entirely anisotropic medium. In a more realistic Earth’s core picture, the influence of mantle heterogeneities, grain size, porosity, and inclusion of partial melt in the solid core cannot be completely precluded. These isotropic contributions to travel-time anomalies have been practically introduced in Eqs. 1 and 2 by means of the μhem term, which accounts for the hemispherical dichotomy through the observed velocity changes of Fig. 1. As the thermal heterogeneous mantle controls the convection in the liquid outer core, it is probable that a different heat flow near the ICB gives rise to an isotropic hemispherical differentiation (62). On the colder western (hotter eastern) inner-core side, a rapid (slow) freezing rate of the molten iron might lead to a higher (lower) degree of porosity and therefore to slower (faster) PKIKP-wave propagation. This might address the measured positive (negative) eastern-like (western-like) differential travel-time residuals reported in Fig. 1.
Fig. 4.
Plot of PKiKP-PKIKP travel-time anomalies as a function of ray angles for a bcc polycrystalline aggregate. Note the specularity between the eastern and western hemispherical patterns. Solid gray lines show the anisotropy pattern predicted by the transversely isotropic model for both eastern (blue open diamonds) and western (red open diamonds) hemispheres. We used the same t parameter range as in Fig. 3, as well as the same seismic observables. The solid (dashed) blue lines are the predicted eastern travel-time anomalies for Δ = 150° (Δ = 130°), when assuming 25% of LPO for iron bcc and a hemispherical velocity correction of +0.056 km/s. The solid (dashed) red lines indicate the computed western anomalies for Δ = 150° (Δ = 130°) at 25% of LPO and with μhem = -0.034 km/s.
Fig. 5.
PKiKP-PKIKP travel-time anomalies as a function of ray-angles for an hcp iron aggregate. Both eastern (blue open diamonds) and western (red open diamonds) hemisphere anomalies were tentatively adjusted by using 85% (50%) of LPO iron hcp for Δ = 150° (Δ = 130°). The solid (dashed) lines are the calculated Transversely Isotropic Model travel times for Δ = 150° (Δ = 130°). The polar African anomalies (46) and the datasets of Creager (8) and Song and Helmberger (59) are also shown as green and black open diamonds, respectively.
From the analysis of polar African anomalies, we found more severe constrains to be used in discriminating one texturing model from the other. When comparing together Fig. 3 A and B, one realizes that the polycrystalline bcc aggregate better accounts for the entire set of African travel times. Polar anomalies are obeying the eastern-like bcc model (dataset centered at ξ = 30° in Figs. 3A and 4), whereas the corresponding equatorial differential travel times (40° ≤ ξ ≤ 90°) are comparing rather well with the bcc western-like data points. Conversely, the hcp model cannot properly account for the polar signals centered at ξ = 30° (Figs. 3B and 5). A special case is represented by the data binned at around ξ = 20° that are showing a sort of PREM-like behavior, and therefore they are just positioned in between the hemispherical dichotomy. This complex anisotropic nature can be ascribed to the peculiar geographic position of Africa, being at the borderline between the two hemispheres. It is likely that, beneath Africa, a localized anomalous solidification of the core material takes place, where kinking and kink bands might have formed at the top of the solid core. This alone would justify the observed travel-time anomalies that are very challenging to explain by a simple elastic model. Such an IC scenario could further explain the reported anomalously strong small-scale magnetic field changes in the top IC beneath Africa (63) and the secular variations in the Earth’s magnetic field due to rapidly drifting spots in the top of the outer core (64). It is worth mentioning that Fe-bcc has a nonvanishing magnetic moment at the IC pressure (42, 65), which could account for different and highly localized crystal alignments according to the inner force lines of the Earth’s magnetic field.
Discussion
Our study strongly suggests the existence of an axial-oriented bcc iron/iron alloy phase in the top layer of the Earth’s inner core. The idea of having two inner-core hemispheres that are anisotropically similar (i.e., they held the same 25% of LPO Fe-bcc) but isotropically different (i.e., ∼1% of hemispherical PKIKP velocity variation) can be justified assuming the existence of a common density stratification process at the ICB and a thermally heterogeneous mantle that dominates the heat flow in the outer-core region (62). Solidification of liquid iron at ICB occurs under shear compression along the liquid–solid interface, a process that indeed favors the development of oriented iron/iron-alloy microcrystals. This in turn explains, together with other proposed mechanisms for LPO formation (12, 29, 66–68), why the shallower part of the solid inner core would continue growing according to the same kind of LPO mechanism. This establishes the base for a common degree of elastic anisotropy in both solid core hemispheres. However, an isotropic hemispherical pattern differentiation can also take place at the ICB region due to the complex heat flow in the mantle. Thermal mantle convection might drive the formation of hemispherical-dependent heterogeneities, thus controlling the porosity of the inner-core material and the amount of melt iron inclusion in the shallower layer of the IC. These effects will topologically differentiate one hemisphere from the other without implying the existence of a different degree of LPO.
At deeper depths (100–300 km), the amount of LPO increases considerably (50% of Fe-bcc), pointing to a more anisotropic IC region. This condition is then achievable when the mechanisms responsible for a lattice-preferred orientation are becoming stronger with depth, and therefore less random oriented crystals should be found in the central part of the IC. The aforementioned isotropic differentiation mechanism for the outermost IC should then disappear with increasing depth (> 100 km), leading to a common isotropic inner-core pattern (8).
Acknowledgments.
Authors acknowledge financial support by the Spanish Ministry of Education and Science (CGL2008-00891), Ramón y Cajal program and Universidad Complutense de Madrid (project 910399), the Swedish Research Council, and the Swedish Foundation for Strategic Research. M.M. thanks Dr. M. Knapmeyer for providing the TTBOX package [Knapmeyer M (2005) Seismol Res Lett 76:74–81] and for supporting the development of ad hoc Matlab routines for inner-core applications. The work of H.-K.M. is partially supported by the National Science Foundation EAR-0810255 and EAR-0911492.
Footnotes
The authors declare no conflict of interest.
References
- 1.Lehmann I. P′. A14. Toulouse, France: Publications du Bureau Central International de la Séismologique; 1936. pp. 87–115. [Google Scholar]
- 2.Birch F. Elasticity and constitution of the Earth interior. J Geophys Res. 1952;57:227–286. [Google Scholar]
- 3.Dziewonski A, Anderson DL. Preliminary reference Earth model. Phys Earth Planet In. 1981;25:297–356. [Google Scholar]
- 4.Hemley RJ, Mao H-K. In situ studies of iron under pressure: New windows on the Earth’s core. Int Geol Rev. 2001;43:1–30. [Google Scholar]
- 5.Jacobs JA. The Earth’s inner core. Nature. 1953;172:297–298. [Google Scholar]
- 6.Gubbins D. Energetics of Earth’s core. J Geophys Res. 1977;43:453–464. [Google Scholar]
- 7.Song X. Anisotropy of the Earth’s inner core. Rev Geophys. 1997;35:297–313. [Google Scholar]
- 8.Creager KC. Anisotropy of the inner core from differential travel times of the phases PKP and PKIKP. Nature. 1992;356:309–314. [Google Scholar]
- 9.Tromp J. Support for anisotropy of the Earth’s inner-core from free oscillations. Nature. 1993;366:678–681. [Google Scholar]
- 10.Tromp J. Inner-core anisotropy and rotation. Annu Rev Earth Pl Sc. 2001;29:47–69. [Google Scholar]
- 11.Poupinet G, Pillet R, Souriau A. Possible heterogeneity of the Earth’s core deduced from PKIKP travel-times. Nature. 1983;305:204–206. [Google Scholar]
- 12.Buffett BA, Wenk HR. Texturing of the Earth’s inner core by Maxwell stresses. Nature. 2001;413:60–63. doi: 10.1038/35092543. [DOI] [PubMed] [Google Scholar]
- 13.Sun X, Song X. The inner inner core of the Earth: Texturing of iron crystals from three-dimensional seismic anisotropy. Earth Planet Sc Lett. 2008;269:56–65. [Google Scholar]
- 14.Cao A, Romanowicz B. Test of the innermost core models using broadband PKIKP travel time residuals. Geophys Res Lett. 2007;34:L08303–L08308. [Google Scholar]
- 15.Niu F, Wen L. Hemispherical variations in seismic velocity at the top of the Earth’s inner core. Nature. 2001;410:1081–1084. doi: 10.1038/35074073. [DOI] [PubMed] [Google Scholar]
- 16.Ishii M, Dziewonski AM. The innermost inner core of the Earth: Evidence for a change in anisotropic behavior at the radius of about 300 km. Proc Natl Acad Sci USA. 2002;99:14026–14030. doi: 10.1073/pnas.172508499. [DOI] [PMC free article] [PubMed] [Google Scholar]
- 17.Souriau A, Romanowicz B. Anisotropy in the inner core: Relation between P-velocity and attenuation. Phys Earth Planet In. 1997;101:33–47. [Google Scholar]
- 18.Song X, Helmberger DV. Depth dependence of anisotropy of Earth’s inner-core. J Geophys Res. 1995;100:9805–9816. [Google Scholar]
- 19.Beghein C, Trampert J. Robust normal mode constraints on inner-core anisotropy from model space search. Science. 2003;299:552–555. doi: 10.1126/science.1078159. [DOI] [PubMed] [Google Scholar]
- 20.Romanowicz B, Li X-D, Durek J. Anisotropy in the inner core: Could it be due to low-order convection? Science. 1996;274:963–966. doi: 10.1126/science.274.5289.963. [DOI] [PubMed] [Google Scholar]
- 21.Garcia R, Souriau A. Inner core anisotropy and heterogeneity level. Geophys Res Lett. 2000;27:3121–3124. [Google Scholar]
- 22.Wen LX, Niu FL. Seismic velocity and attenuation structures in the top of the Earth’s inner core. J Geophys Res. 2002;107:2273–2286. doi: 10.1029/2001JB000170. [Google Scholar]
- 23.Ishii M, Dziewonski A, Tromp J, Ekström G. Joint inversion of normal mode and body wave data for inner core anisotropy: 2 Possible complexities. J Geophys Res. 2002;107:2379–2395. [Google Scholar]
- 24.Bréger L, Tkalcic H, Romanowicz B. The effect of D′′ on PKP(AB-DF) travel time residuals and possible implications for inner core structure. Earth Planet Sc Lett. 2000;175:133–143. [Google Scholar]
- 25.Niu FL, Wen LX. Seismic evidence for distinct anisotropy in the innermost inner core. Nat Geosci. 2008;1:692–696. [Google Scholar]
- 26.Morelli A, Dziewonski AM, Woodhouse JH. Anisotropy of the inner core inferred from PKIKP travel times. Geophys Res Lett. 1986;13:1545–1548. [Google Scholar]
- 27.Woodhouse JH, Giardini D, Li XD. Evidence for inner core anisotropy from free oscillations. Geophys Res Lett. 1986;13:1549–1552. [Google Scholar]
- 28.Karato S. Inner-core anisotropy due to the magnetic-filed-induced preferred orientation of iron. Science. 1993;262:1708–1711. doi: 10.1126/science.262.5140.1708. [DOI] [PubMed] [Google Scholar]
- 29.Bergman MI. Measurements of electric anisotropy due to solidification texturing and the implications for the Earth’s inner core. Nature. 1997;389:60–63. [Google Scholar]
- 30.Buffett BA. Earth’s core and the geodynamo. Science. 2000;288:2007–2012. doi: 10.1126/science.288.5473.2007. [DOI] [PubMed] [Google Scholar]
- 31.Singh SC, Taylor MAJ, Montagner JP. On the presence of liquid in Earth’s inner core. Science. 2000;287:2471–2474. doi: 10.1126/science.287.5462.2471. [DOI] [PubMed] [Google Scholar]
- 32.Belonoshko AB, Skorodumova NV, Rosengren A, Johansson B. Elastic anisotropy of Earth’s inner core. Science. 2008;319:797–800. doi: 10.1126/science.1150302. [DOI] [PubMed] [Google Scholar]
- 33.Stixrude L, Cohen RE. High-pressure elasticity of iron and anisotropy of Earth’s inner core. Science. 1995;267:1972–1975. doi: 10.1126/science.267.5206.1972. [DOI] [PubMed] [Google Scholar]
- 34.Steinle-Neumann G, Cohen RE, Stixrude L, Gulseren O. Elasticity of iron at the temperature of the Earth’s inner core. Nature. 2001;413:57–60. doi: 10.1038/35092536. [DOI] [PubMed] [Google Scholar]
- 35.Wookey J, Helffrich G. Inner-core shear-wave anisotropy and texture from an observation of PKJKP waves. Nature. 2008;454:873–877. doi: 10.1038/nature07131. [DOI] [PubMed] [Google Scholar]
- 36.Belonoshko AB, Ahuja R, Johansson B. Stability of the body-centred-cubic phase of iron in the Earth’s inner core. Nature. 2003;424:1032–1034. doi: 10.1038/nature01954. [DOI] [PubMed] [Google Scholar]
- 37.Gannarelli CMS, Alfè D, Gillan J. The axial ratio of hcp iron at the conditions of the Earth’s inner core. Phys Earth Planet In. 2005;152:67–77. [Google Scholar]
- 38.Dubrovinsky L, et al. Body-centered cubic iron-nickel alloy in Earth’s core. Science. 2007;316:1880–1883. doi: 10.1126/science.1142105. [DOI] [PubMed] [Google Scholar]
- 39.Kuwayama Y, Sawai T, Hirose T, Sata N, Ohishi Y. Phase relations of iron-silicon alloys at high pressure and high temperature. Phys Chem Miner. 2009;36:511–518. [Google Scholar]
- 40.Belonoshko AB, Rosengren A, Burakovsky L, Preston DL, Johansson B. Melting of Fe and Fe0.9375Si0.0625 at Earth’s core pressures studied using ab initio molecular dynamics. Phys Rev B. 2009;79:220102R–220106R. [Google Scholar]
- 41.Vočadlo L, et al. Possible thermal and chemical stabilization of body-centred-cubic iron in the Earth’s core. Nature. 2003;424:536–539. doi: 10.1038/nature01829. [DOI] [PubMed] [Google Scholar]
- 42.Mattesini M, Buforn E, Udías A, Vitos L, Ahuja R. An ab initio study of S-substituted iron-nickel-silicon alloy at the Earth’s inner core pressure. High Pressure Res. 2008;28:437–441. [Google Scholar]
- 43.J-array Group. The J-Array program: System and present status. J Geomagn Geoelectr. 1993;45:1265–1274. [Google Scholar]
- 44.Goldstein P, Dodge D, Firpo M, Minner L. The IASPEI International Handbook of Earthquake and Engineering Seismology, Part B. London: Academic Press; 2003. SAC2000: Signal processing and analysis tools for seismologists and engineers; pp. 1613–1614. [Google Scholar]
- 45.Garcia R. Constraints on upper inner-core structure from waveform inversion of core phases. Geophys J Int. 2002;150:651–664. [Google Scholar]
- 46.Yu W, Wen L. Complex seismic anisotropy in the top of the Earth’s inner core beneath Africa. J Geophys Res. 2007;112:B08304–B08322. doi: 10.1029/2006JB004868. [Google Scholar]
- 47.Poupinet G, Kennett BLN. On the observation of high frequency PKiKP and its coda in Australia. Phys Earth Planet In. 2004;146:497–511. [Google Scholar]
- 48.Krasnoshchekov DN, Kaazik PB, Ovtchinnikov VM. Seismological evidence for mosaic structure of the surface of the Earth’s inner core. Nature. 2005;435:483–487. doi: 10.1038/nature03613. [DOI] [PubMed] [Google Scholar]
- 49.Wen LX. Localized temporal change of the Earth’s inner core boundary. Science. 2006;315:967–970. doi: 10.1126/science.1131692. [DOI] [PubMed] [Google Scholar]
- 50.Voigt W. Lehrburch der Kristallphysik. Leipzig: Teubner; 1928. [Google Scholar]
- 51.Reuss A. Berechnung der Fließgrenze von Mischkristallen auf Grund der Plastizitätsbedingung für Einkristalle. Z Angew Math Mech. 1929;9:49–58. [Google Scholar]
- 52.Hill R. The elastic behaviour of a crystalline aggregate. Proc Phys Soc Lond. 1952;65:349–354. [Google Scholar]
- 53.Kresse G, Furthmüller J. Efficiency of ab-initio total energy calculations for metals and semiconductors using a plane-wave basis set. Comp Mater Sci. 1996;6:15–50. doi: 10.1103/physrevb.54.11169. [DOI] [PubMed] [Google Scholar]
- 54.Belonoshko AB, et al. Origin of the low rigidity of the Earth’s inner core. Science. 2007;316:1603–1605. doi: 10.1126/science.1141374. [DOI] [PubMed] [Google Scholar]
- 55.Vočadlo L. Ab initio calculations of the elasticity of iron and iron alloys at inner core conditions: Evidence for a partially molten inner core? Earth Planet Sc Lett. 2007;254:227–232. [Google Scholar]
- 56.Sola E, Alfè D. Melting of iron under Earth’s core conditions from diffusion Monte Carlo free energy calculations. Phys Rev Lett. 2009;103:078501–078505. doi: 10.1103/PhysRevLett.103.078501. [DOI] [PubMed] [Google Scholar]
- 57.Belonoshko AB, Ahuja R, Johansson B. Quasi-an initio molecular dynamic study of Fe melting. Phys Rev Lett. 2000;84:3638–3641. doi: 10.1103/PhysRevLett.84.3638. [DOI] [PubMed] [Google Scholar]
- 58.Mao H-K, et al. Elasticity and rheology of iron above 220 GPa and the nature of the Earth’s inner core. Nature. 1998;396:741–743. [Google Scholar]
- 59.Song XD, Helmberger DV. Anisotropy of Earth’s inner-core. Geophys Res Lett. 1993;20:2591–2594. [Google Scholar]
- 60.Venet L, Duffar T, Deguen R. Grain structure of the Earth’s inner core. C R Geosci. 2009;341:513–516. [Google Scholar]
- 61.Cao A, Romanowicz B. Hemispherical transition of seismic attenuation at the top of the Earth’s inner core. Earth Planet Sc Lett. 2004;228:243–253. [Google Scholar]
- 62.Sumita I, Olson P. A laboratory model for convection in Earth’s core driven by a thermally heterogeneous mantle. Science. 1999;286:1547–1549. doi: 10.1126/science.286.5444.1547. [DOI] [PubMed] [Google Scholar]
- 63.Hulot G, Eymin C, Langlais B, Mandea M, Olsen N. Small-scale structure of the geodynamo inferred from Oersted and Magsat satellite data. Nature. 2002;416:620–623. doi: 10.1038/416620a. [DOI] [PubMed] [Google Scholar]
- 64.Bloxham J, Gubbins J. The secular variation of Earth’s magnetic-field. Nature. 1985;317:777–781. [Google Scholar]
- 65.Söderlind P, Ahuja R, Eriksson O, Wills JM, Johansson B. Crystal structure and elastic-constant anomalies in the magnetic 3d transition metals. Phys Rev B. 1994;50:5918–5927. doi: 10.1103/physrevb.50.5918. [DOI] [PubMed] [Google Scholar]
- 66.Yoshida S, Sumita I, Kumazawa M. Growth model of the inner core coupled with the outer core dynamics and the resulting elastic anisotropy. J Geophys Res. 1996;101:28085–28103. [Google Scholar]
- 67.Karato SI. Seismic anisotropy of the Earth’s inner core resulting from low induced Maxwell stresses. Nature. 1999;402:871–873. [Google Scholar]
- 68.Wenk HR, Baumgardner JR, Lebenshon RA, Tomè CN. A convection model to explain anisotropy of the inner core. J Geophys Res. 2000;105:5663–5677. [Google Scholar]


