

Abstract
Acetyl-CoA carboxylase (ACC), the first committed enzyme in fatty acid (FA) synthesis, is regulated by phosphorylation/dephosphorylation, transcription, and an unusual mechanism of protein polymerization. Polymerization of ACC increases enzymatic activity and is induced in vitro by supraphysiological concentrations of citrate (> 5 mM). Here, we show that MIG12, a 22 kDa cytosolic protein of previously unknown function, binds to ACC and lowers the threshold for citrate activation into the physiological range (< 1 mM). In vitro, recombinant MIG12 induced polymerization of ACC (as determined by nondenaturing gels, FPLC, and electron microscopy) and increased ACC activity by > 50-fold in the presence of 1 mM citrate. In vivo, overexpression of MIG12 in liver induced ACC polymerization, increased FA synthesis, and produced triglyceride accumulation and fatty liver. Thus, in addition to its regulation by phosphorylation and transcription, ACC is regulated at a tertiary level by MIG12, which facilitates ACC polymerization and enhances enzymatic activity.
Keywords: lipogenesis, SREBPs, steatosis
Fatty acids (FAs) are the essential components of phospholipids and provide the most important energy depot for the body in the form of triglycerides (TG). Newly synthesized FAs also serve as signaling molecules and modulators of transcription factor activity (1–3). Excess accumulation of FAs in tissues contributes to the pathogenesis of many common diseases, including insulin resistance, nonalcoholic fatty liver disease, diabetes, and cancer (4, 5). Given the central role of FAs in these diseases, the enzymes of FA biosynthesis are potential therapeutic targets.
The first committed step in FA biosynthesis is carried out by acetyl-CoA carboxylase (ACC). ACC1 was isolated and characterized by Wakil et al. (6) and functions to carboxylate acetyl-CoA to form malonyl-CoA. Subsequently, a second ACC isoform, ACC2, was identified in mammals that is encoded by a separate gene but carries out the same enzymatic reaction (7, 8).
ACCs are members of a larger family of carboxylases that require biotin and ATP and use bicarbonate as a carbon donor. The malonyl-CoA produced by ACC can be used by FA synthase (FAS) for the sequential 2-carbon elongation reactions that generate palmitic acid (C16:0) in the cytosol. While both ACC1 and ACC2 produce malonyl-CoA, ACC1 is predominantly cytosolic and generates malonyl-CoA that is used by FAS to synthesize palmitic acid. ACC2 is associated with the mitochondrial membrane (9) and produces malonyl-CoA that serves to allosterically inhibit carnitine palmitoyl transferase I, the protein responsible for transport of long chain FAs into mitochondria for β-oxidation (10).
Regulation of ACC1 and ACC2 occurs at multiple levels. ACC activity is acutely regulated by phosphorylation/dephosphorylation. AMP-activated protein kinase phosphorylates ACC and inhibits enzyme activity (11). In the fed state, excess glucose must be converted to FAs for energy storage in the form of TGs. Increased insulin signaling in the fed state results in the dephosphorylation of ACC, which increases ACC activity and stimulates FA synthesis in liver (12).
The second level of regulation of ACC is transcriptional, which is mediated by sterol regulatory element-binding protein-1c (SREBP-1c), carbohydrate response element-binding protein (ChREBP), and liver X receptors (LXRs) (13–15). Insulin stimulates FA synthesis in liver through LXR, which transcriptionally induces SREBP-1c mRNA (16). SREBP-1c activates the transcription of ACC and all enzymes involved in FA biosynthesis (13). ChREBP is activated by glucose and independently activates genes encoding the FA biosynthetic enzymes (17).
The third level of regulation of ACC activity is through allosteric activation by high concentrations of citrate, which can induce the polymerization of ACC and thereby increase enzymatic activity (4). Citrate is produced in the mitochondria and is used as a substrate by ATP citrate lyase (ACL), which converts citrate to acetyl-CoA, the substrate of ACC. The overall contribution of this third level of regulation has been questioned inasmuch as the concentrations of citrate required to increase ACC activity are much higher than that normally present in cells (18, 19).
To identify novel proteins involved in lipid metabolism, we carried out microarray studies of mice that either overexpressed SREBPs or that lacked SREBPs in the liver (20). There are three SREBP family members, designated SREBP-1a, -1c, and -2. The SREBP-1 isoforms predominantly regulate genes involved in FA and TG synthesis while the SREBP-2 isoform activates genes involved in cholesterol biosynthesis and cellular homeostasis (13). One gene identified in our array screen was Mig12 (20), a gene that encodes an ∼22 kDa protein that was subsequently reported to cooperate with MID1 to bundle and stabilize microtubules (21). MIG12 mRNA levels were increased in livers of SREBP transgenic mice and significantly reduced in liver of mice that lacked SREBPs (20). Although a function of MIG12 in lipid metabolism was unknown, the regulation of MIG12 mRNA levels by SREBPs suggested that one might exist. Here, we show that MIG12 induces the polymerization of ACC1 and ACC2, which in turn increases total ACC enzymatic activity. Citrate is not required for MIG12-induced polymerization of ACC1. Polymerization of ACC2 requires low concentrations of citrate. MIG12 is incorporated into the ACC polymers. These studies identify MIG12 as a SREBP-regulated tertiary regulator of ACC activity.
Results
MIG12 is Expressed in All Tissues and Is a Cytosolic Protein.
MIG12 mRNA is expressed in all tissues with the highest levels in liver, heart, brain, and kidney (Fig. S1A), and white adipose tissue (22). The hydrodropathy plot of MIG12 suggested that there were no transmembrane domains (Fig. S1B). As a first step in interrogating the function of MIG12, the cellular localization of MIG12 in liver was determined. Liver proteins were separated into nuclear, cytosolic, and membrane fractions, and proteins in each fraction were separated by SDS/PAGE. MIG12 was identified by immunoblot analysis using an antibody raised against recombinant mouse MIG12 protein. As shown in Fig. S1C, MIG12 protein was detected only in the cytosolic fraction of mouse liver.
MIG12 Expression Is Regulated in a Manner Similar to Other Proteins Involved in Lipogenesis.
FA synthesis is normally suppressed during fasting and induced by refeeding carbohydrate-enriched diets (23). Mice were fasted or refed a high carbohydrate diet following a 12 h fast and hepatic MIG12 mRNA and protein levels were measured. In the fasted state, MIG12 mRNA and protein levels were reduced by ∼80%, while the refed mice exhibited an increase of 2.2-fold of both mRNA and protein relative to mice fed ad libitum (Fig. S2). MIG12 appeared as a doublet on immunoblot analysis of mouse liver cytosol with molecular weights of ∼22 and ∼24 kDa. This pattern of regulation is similar to that of SREBP-1c (Fig. S2) and other enzymes involved in FA synthesis (23).
Overexpression of MIG12 in Mice Increases De Novo Hepatic FA Synthesis.
To elucidate whether MIG12 had a direct function in FA metabolism, an adenovirus that expressed MIG12 was injected into C57BL/6 male mice. Mice infected with an adenovirus expressing β-gal were used as controls. Five days after virus administration, mice were injected with tritiated water and in vivo rates of hepatic FA and cholesterol synthesis measured (Fig. 1A). Mice that overexpressed MIG12 in liver had ∼2-fold higher rates of de novo FA synthesis, which culminated in ∼3-fold higher hepatic TG concentrations and the development of fatty livers (Fig. 1B). In vivo cholesterol synthesis rates and liver concentrations were not changed by MIG12 overexpression.
Fig. 1.

MIG12 overexpression in mice increases FA synthesis resulting in fatty liver. Five mice were injected with adenoviruses (1011 particles/mouse) that expressed β-gal or MIG12. Each value represents the average ± S.E. of values from 5 mice and P values were determined using Student’s t-test. (A) In vivo rates of FA and cholesterol synthesis in livers of mice injected with β-gal or MIG12 adenovirus. Five days after adenoviral injections, mice were injected intraperitoneally with [3H]H2O (50 mCi) and 3H incorporation into newly synthesized FAs and cholesterol were measured as described in Methods. Similar results were obtained in 1 independent study. (B) Liver TG and cholesterol concentrations were measured 5 days after adenoviral injections. Similar results were obtained in three independent studies.
To investigate the mechanism by which MIG12 selectively increased FA synthesis, the mRNA levels of the genes that encode enzymes involved in the de novo synthesis of FAs in livers of mice infected with the MIG12 adenovirus were quantified and compared to mice injected with control virus. No significant changes in mRNA levels of ACL, ACC1, ACC2, FAS, elongation of long chain FAs (ELOVL) 6, or stearoyl-CoA desaturase-1 were observed, and nuclear protein levels of the transcription factors that activate the lipogenic genes, SREBP-1 and ChREBP, were not increased by MIG12 overexpression (Fig. S3A and B). Similarly, protein levels of ACL, ACC, and FAS were unchanged by MIG12 overexpression in liver (Fig. S3C). Thus, the increase in hepatic FA synthesis induced by MIG12 was independent of transcriptional activation and the steady state protein levels of lipogenic enzymes.
MIG12 Binds to ACC.
Coimmunoprecipitation studies were carried out to determine whether MIG12 interacted with proteins that might influence FA synthesis. Mice were injected with an adenovirus expressing β-gal or FLAG-tagged MIG12, and livers were harvested 2 d after injection. MIG12 was immunoprecipitated using an anti-FLAG antibody and proteins that coimmunoprecipitated were separated by SDS/PAGE and visualized by silver stain. Proteins that preferentially coimmunoprecipitated with MIG12 were identified using the Procise® Protein Sequencing System. One prominent protein that coimmunoprecipitated preferentially with MIG12 was identified as ACC (Fig. S4); the enzyme that carries out the first committed step in FA synthesis.
To determine whether MIG12 interacted with other FA biosynthetic enzymes, mice were injected with an adenoviruses expressing β-gal or FLAG-tagged MIG12 and killed after a 12 h fast or after refeeding a high carbohydrate diet. MIG12 was immunoprecipitated using the anti-FLAG antibody, and the proteins were subjected to SDS/PAGE and immunoblot analysis using antibodies that recognize ACL, ACC, and FAS. As shown in Fig. 2A, only ACC coimmunoprecipitated with MIG12, and the amount of ACC precipitated was greater from livers of mice refed the high carbohydrate diet, a state in which ACC protein is most abundant.
Fig. 2.

ACC coimmunoprecipitates with MIG12. (A) Five male mice were injected with an adenovirus expressing either β-gal or MIG12-FLAG. Two days after injection, mice were fasted for 12 h (F) or refed a high carbohydrate diet for 12 h following a 12 h fast (R). Livers were harvested and MIG12 was immunoprecipitated from liver lysates using an anti-FLAG monoclonal antibody. Cell lysates and proteins in immunoprecipitation pellets were separated by SDS/PAGE and immunoblot analysis was performed using polyclonal antibodies that recognize mouse ACC1, FAS, and ACL as described in Methods. (B) Five male mice were fed chow ad libitum (C), fasted for 12 h (F), or refed a high carbohydrate diet for 12 h after a 12 h fast (R). Livers were harvested and endogenous MIG12 was immunoprecipitated from cell lysates using an antimouse MIG12 polyclonal antisera or rabbit preimmune sera. Proteins in the supernatant and immunoprecipitation pellets were separated by SDS/PAGE and immunoblot analysis was performed using polyclonal antibodies that recognize mouse ACC1 and MIG12. * cross-reacting band.
To confirm that the interaction between MIG12 and ACC occurred at physiological levels of MIG12 expression, a polyclonal antibody raised against mouse MIG12 was used for immunoprecipitation of endogenous MIG12 from livers of mice fed ad libitum, fasted for 12 h, and refed a high carbohydrate diet following a fast (Fig. 2B). In ad libitum and refed conditions, ACC coimmunoprecipitated with MIG12; in the fasted state, endogenous MIG12 was not detected in liver.
MIG12 Increases ACC Activity.
Inasmuch as MIG12 directly bound to ACC under physiological conditions, we next determined whether MIG12 altered ACC activity using an in vitro assay developed by Lane and coworkers (19). Partially purified ACC protein from livers of mice was incubated with recombinant mouse MIG12, 14C-labeled bicarbonate, and ATP, and the incorporation of 14C into malonyl-CoA was quantified as a measure of ACC activity (Fig. 3A). In the presence of 1 mM citrate, MIG12 increased ACC activity by 58-fold in a concentration-dependent manner (Fig. 3A). In the absence of MIG12, the concentration of citrate required for half-maximal ACC activity was ∼1.6 mM. In the presence of MIG12 the citrate activation curve was shifted markedly to the left, with the half-maximal activation at 0.2 mM (Fig. 3B).
Fig. 3.

Total ACC activity is increased by MIG12. ACC was partially purified from livers of mice and MIG12 was produced as described in Methods. (A) Partially purified ACC (55 μg) was preincubated with the indicated amounts of MIG12 or BSA, and 1.0 mM citrate for 30 min and ACC activity assays were performed as described in Methods. Each value is the mean ± S.E. of three independent reactions. Similar results were obtained in three independent studies. (B) Partially purified ACC (55 μg) was preincubated with 20 μg of recombinant MIG12 or BSA and ACC activity was measured in the presence of increasing concentrations of citrate as described in Methods. Each value is the mean ± S.E. of three independent reactions. Similar results were obtained in three independent studies.
The use of partially purified hepatic ACC in these activity assays could not reveal whether MIG12 enhanced the activity of ACC1, ACC2, or both enzymes. Therefore, ACC activity assays were repeated using recombinant ACC1 and ACC2 proteins (24). As shown in Fig. 4A, the addition of MIG12 to ACC1 or ACC2 increased the activity of each enzyme by ∼10-fold and ∼4-fold, respectively, at the highest MIG12 concentrations tested. MIG12 had a greater ability to enhance ACC1 activity at lower concentrations compared to ACC2. The ability of MIG12 to increase ACC1 and ACC2 activity as a function of citrate concentration was also determined (Fig. 4B). MIG12 increased ACC1 activity by more than sixfold even in the complete absence of citrate, whereas MIG12’s ability to increase ACC2 activity required the presence of citrate in the reaction (Fig. 4B).
Fig. 4.

Recombinant ACC1 and ACC2 activity is induced by MIG12. (A) Recombinant human ACC1 (0.5 μg) and ACC2 (0.5 μg) were incubated with the indicated amounts of mouse MIG12 or BSA and the ACC activity was measured as described in Methods. The ACC1 reactions contained 0 mM citrate and the ACC2 reactions contained 1 mM citrate. Each value is the mean ± standard error of three independent reactions. Similar results were obtained in two independent studies. (B) Recombinant ACC1 (0.5 μg) and ACC2 (0.5 μg) were incubated with 2 μg of MIG12 or BSA in the presence of the indicated concentration of citrate and ACC activity was measured. Each value is the mean ± S.E. of three independent reactions. Similar results were obtained in two independent studies.
MIG12 Does Not Alter ACC Phosphorylation.
ACC activity is reduced by phosphorylation and increased by dephosphorylation (4). To determine whether MIG12 increased ACC activity by altering the phosphorylated state of ACC, avidin-mediated highly purified mouse ACC was incubated with BSA or MIG12 for 30 min, and the proteins were subjected to SDS/PAGE and immunoblot analysis using streptavidin that detects total ACC or an antibody that only detects phosphorylated ACC (Fig. S5A). The ratio of phosphorylated ACC to total ACC was not significantly changed in the presence and absence of recombinant MIG12. To confirm that phosphorylation was not changed by MIG12 in vivo, mice were injected with a MIG12 or control adenovirus and livers were harvested. The ratio of phosphorylated ACC to total ACC was unchanged despite a significant increase in ACC activity (Fig. S5B–D). Combined, these results suggest that MIG12 does not alter the phosphorylated state of ACC.
MIG12 Induces ACC Polymerization.
Activation of ACC by citrate is associated with the formation of ACC polymers (19). To determine whether MIG12 influences ACC polymerization, MIG12 was added to recombinant ACC1 and ACC2 in the presence or absence of citrate and the proteins subjected to nondenaturing blue-native gel electrophoresis. ACC1 and ACC2 in their least active states exist as dimers (4). The addition of increasing concentrations of MIG12 to ACC1 induced the formation of very high molecular weight polymers in a concentration-dependent manner even in the absence of citrate (Fig. 5A). A similar series of studies were performed using recombinant ACC2 in the presence of 0.625 mM citrate, because MIG12 had no or little effect on ACC2 activity in the absence of citrate. While MIG12 also induced the polymerization of ACC2, the concentration of MIG12 required was higher than that required for ACC1 polymerization (Fig. 5B). Addition of citrate alone to ACC1 or ACC2 resulted in a shift to higher order oligomers that are approximately the predicted size of an ACC tetramer (Fig. 5C and D). The addition of MIG12 to ACC1 induced the formation of the high molecular weight ACC1 form even in the absence of citrate (Fig. 5C), while the proportion of high molecular weight ACC2 increased with increasing citrate concentrations (Fig. 5D).
Fig. 5.

Induction of ACC1 and ACC2 polymerization by MIG12. (A) Recombinant ACC1 (6 μg) was incubated with 0, 0.23, 0.45, 0.9, 1.8, and 3.6 μg of MIG12 or BSA in presence of 0 mM citrate. (B) Recombinant ACC2 (6 μg) was incubated with 0, 0.23, 0.45, 0.9, 1.8, and 3.6 μg of MIG12 or BSA in presence 0.625 mM citrate. (C) Recombinant ACC1 (6 μg) was incubated with 0.9 μg of MIG12 or BSA in the presence of 0, 0.3, 0.6, 1.25, 2.5, and 5 mM citrate. (D) Recombinant ACC2 (6 μg) was incubated with 0.9 μg of MIG12 or BSA in the presence of 0, 0.3, 0.6, 1.25, 2.5, and 5 mM citrate. The incubated proteins were subjected to blue-native gel electrophoresis (3.5–10% gradient gels) and the proteins were transferred to nitrocellulose membrane. Immunoblots were performed using a polyclonal anti-MYC antibody to detect ACC1 and ACC2.
To confirm that the increase in ACC molecular weight induced by MIG12 was actually a result of polymerization, the mixture of ACC and MIG12 was subjected to negative staining electron microscopy. As shown in Fig. S6, MIG12 induced the formation of long filamentous ACC1 and ACC2 polymers.
MIG12 Is Incorporated into the ACC Polymer.
To determine whether the MIG12 catalytically induced ACC polymerization or whether MIG12 was directly incorporated into the ACC polymer, MIG12 was incubated with ACC1 or ACC2 in the presence or absence of citrate and the mixture was subjected to FPLC. ACC and MIG12 proteins were detected by immunoblot analysis in each fraction. As shown in Fig. 6A, mixing MIG12 and ACC1 shifted the fractions in which ACC1 was detected to those corresponding to higher molecular weight proteins, consistent with the findings in Fig. 5. In preliminary experiments, we found that MIG12 exists predominantly as a dimer as determined by analytical ultracentrifugation, but in gel filtration studies higher order tetramers were also observed. Using the Superose 6 column, MIG12 was consistently detected only in fractions 14–18. In the presence of ACC1, MIG12 was detected in all fractions that also contained ACC1 (Fig. 6A). In the presence of 5 mM citrate, all MIG12 was detected exclusively in high molecular weight fractions 7–10 that contained ACC1 (Fig. 6B).
Fig. 6.

MIG12 incorporates into ACC polymers. (A) Recombinant ACC1 (80 μg) was incubated with 10 μg of MIG12 or BSA in 0 mM citrate for 5 min at RT. (B) Recombinant ACC1 (80 μg) was incubated with 10 μg of MIG12 or BSA in 5 mM citrate for 5 min at RT. (C) Recombinant ACC2 (80 μg) was incubated with 10 μg of MIG12 or BSA in 0 mM citrate for 5 min at RT. (D) Recombinant ACC2 (80 μg) was incubated with 10 μg of MIG12 or BSA in 5 mM citrate for 5 min at RT. The mixtures were subjected to FPLC using a Superose 6 size exclusion column and 10 μl from the each fraction was subjected to 5.5% SDS/PAGE for ACC1 and ACC2 immunoblots or 12% SDS/PAGE for MIG12 immunoblots. Proteins were transferred to nitrocellulose membrane and ACC1 and ACC2 proteins were detected using an anti-MYC antibody and MIG12 was detected using a polyclonal antimouse MIG12 antibody.
The shift in size induced in ACC2 by MIG12 was more subtle in the absence of citrate (Fig. 6C). This result is consistent with data of Fig. 5 that demonstrated minimal polymerization of ACC2 in the absence of citrate; however, in the presence of 5 mM citrate, ACC2 shifted to the higher molecular weight fractions and MIG12 was also incorporated into this complex (Fig. 6D). Combined, these results suggested that MIG12 is bound to ACC and that the protein becomes an integral component of the high molecular weight ACC polymer.
MIG12 Induces Polymerization of ACC in Living Animals.
To confirm that MIG12 was also capable of inducing ACC polymerization in vivo, mice were injected with an adenovirus expressing β-gal or MIG12, liver was harvested, and cytosolic proteins were subjected to blue-native gel electrophoresis and immunoblot analysis for ACC. Overexpression of MIG12 in mouse liver induced the formation of high molecular weight ACC in a manner similar to that observed with purified recombinant proteins (Fig. 7).
Fig. 7.
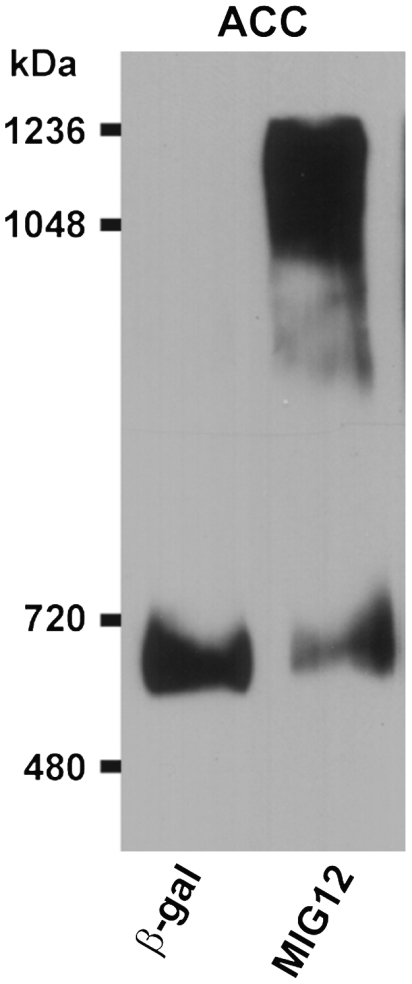
MIG12-induced ACC polymerization in living animals. Five male mice were injected with an adenovirus expressing either β-gal or MIG12 (1011 particles/mouse). Mice were killed 5 days after the injection and liver was harvested. Pooled liver cytosolic proteins (50 μg) from each group of mice were subjected to 3.5–10% gradient blue-native gel electrophoresis and ACC1 protein was detected by immunoblot analysis.
Discussion
In the current report, we demonstrate that MIG12 is responsible for the tertiary regulation of ACC by its ability to bind and induce polymerization, which in turn increases the enzymatic activity of ACC. Adenoviral overexpression of MIG12 in mice also induced the formation of ACC polymers, which was associated with increased rates of de novo FA synthesis in liver leading to hepatic steatosis.
Previously, polymerization of ACC had been shown to be induced by high concentrations of citrate (19). This observation is consistent with the physiologic changes that are associated with states of increased lipogenesis in liver that arise when excess glucose is converted to citrate in the mitochondria and then transported to the cytosol for utilization by ACL to produce acetyl-CoA, the substrate of ACC. While we could demonstrate that citrate alone could induce higher order oligomers of recombinant ACC1 and ACC2 that were approximately the size of a tetramer, the formation of the high molecular weight polymers required the presence of MIG12 as assessed by blue-native gel electrophoresis (Fig. 5). Furthermore, the concentration of citrate required for half-maximal ACC activity was greater than 1.5 mM, which is higher than the normal cellular concentration of citrate (∼0.6–1.25 mM) (18). MIG12 significantly shifted the citrate activation curve to the left, lowering the concentration of citrate required for half-maximal activity to ∼0.2 mM, which is well within the physiological range. In the case of ACC1, MIG12 induced polymerization and increased enzyme activity even in the absence of citrate, while ACC2 required a minimal citrate concentration. The mechanism responsible for the difference in citrate requirements for MIG12-induced ACC1 and ACC2 polymerization was not determined in this study; however, the relative resistance of ACC2 to polymerize has been reported recently (25).
The ability of MIG12 to induce ACC polymerization raised the question of whether MIG12 functioned as a catalyst for ACC polymerization or whether MIG12 actually integrated into the ACC polymer. The experiments of Fig. 6 suggested that MIG12 was directly incorporated into the ACC polymer. To our knowledge, this is a previously undescribed example of a protein that regulates the activity of a metabolic enzyme by binding and inducing a higher order structure, which in turn increases enzymatic activity. Estimates of the stoichiometry of MIG12 and ACC from the gel filtration fractions shown in Fig. 6 suggest that the MIG12-ACC1 ratio is ∼1∶1 in the absence of citrate. Similar estimates for ACC2 in the presence of citrate suggest a slightly higher MIG12:ACC2 ratio of ∼2∶1. The exact stoichiometry of MIG12 to ACC will ultimately require crystallographic analysis of the MIG12:ACC complex.
The MIG12 protein in mouse liver runs as a doublet of ∼22 kDa and 24 kDa on SDS/PAGE. The doublet appears to be due to differences in phosphorylation because the treatment of recombinant MIG12 with alkaline phosphatase to completely dephosphorylate the protein resulted in a single MIG12 band by immunoblot analysis. To confirm that MIG12 was phosphorylated, the ∼22 kDa and ∼24 kDa recombinant MIG12 protein produced in CHO cells was subjected to digestion by trypsin and endoproteinase AspN, and phosphorylation sites were identified by LC/MS/MS. The ∼22 kDa MIG12 contained five phosphorylated serine residues (S44, S71, S74, S110, and S134), whereas the ∼24 kDa MIG12 contained three additional phosphorylated residues (T66, T67, and S78). In the mouse fasting/refeeding studies, both bands appear to be regulated in parallel. Whether alternatively phosphorylated forms of MIG12 have different activities is currently not known; however, in preliminary experiments recombinant MIG12 purified from Escherichia coli that produces MIG12 with no posttranslational modifications behaves the same as MIG12 produced in CHO cells, which produces both forms of phosphorylated MIG12.
A search of the National Institutes of Health database for proteins related to MIG12 only reveals one protein, designated SPOT 14 (S14), which has 36% amino acid identity with MIG12 (21). S14 is also regulated by SREBPs in a manner similar to MIG12 (20) and knockout mice have reduced fatty acid synthesis in mammary glands (26). Recombinant S14 was also tested in vitro and no change in ACC1 or ACC2 activity was found (Fig. S7). Thus, despite the similar regulation and sequence homology, only MIG12 is capable of inducing ACC activity.
MIG12 mRNA and protein levels are regulated in parallel with SREBP-1c and all other enzymes in the FA biosynthetic pathway. Our previous microarray studies demonstrated that the mRNA for MIG12 was markedly induced in livers of SREBP-1 transgenic mice and significantly reduced in mice that lack SREBPs (20). While we did not formally demonstrate that SREBP-1 binds to the promoter of MIG12, a classic sterol response element does exist in the 5′-flanking region of the mouse Mig12 gene ∼174 base pairs 5′ to the transcriptional start site. Previously, most genes identified as direct transcriptional targets of SREBP-1 have been enzymes that carry out the synthesis of FAs and TGs (20). The identification of MIG12 as a protein that activates ACC enzymatic activity by inducing the polymerization of the protein adds a new posttranscriptional layer of regulation of FA synthesis by SREBP-1c. The overall importance of this tertiary level of ACC regulation in the control of FA synthesis rates in liver will ultimately require the generation and characterization of MIG12 knockout mice.
Methods
Generation of Polyclonal Antimouse MIG12 Antibody.
Recombinant mouse (His)6-MIG12 expressed in the E. coli was purified with Ni-NTA affinity column using QIAexpressionist system (Qiagen) according to the manufacturer’s protocol and is described in detail in SI Supplemental Methods. Recombinant MIG12 was injected into rabbits to generate polyclonal antibody as described (27).
Production and Expression of MIG12 Adenovirus in Mice.
Mouse MIG12 cDNA was subcloned into pShuttle-CMV transfer vector and adenovirus produced per protocol. Virus (1011 particles/mouse) was injected to C57BL/6 mice via tail vein and tissues harvested at the indicated times. Animal experiments were approved by the Institutional Animal Care and Research Advisory Committee at the University of Texas Southwestern.
MIG12 Immunoprecipitation from Mouse Liver and Immunoblot Analysis.
Five male C57BL/6 mice were injected with an adenovirus (1011 particles/mouse) expressing either β-gal or MIG12-FLAG. Two days after injection, mice were fasted for 12 h (F) or refed a high carbohydrate diet (MP Biomedicals, Cat # 960238) for 12 h following a 12 h fast (R). In separate experiments to precipitate endogenous MIG12, 5 male mice were subjected to the same feeding paradigm. Livers were harvested and proteins were immunoprecipitated and identified by immunoblot analysis as described in SI Supplemental Methods.
FA and Cholesterol Synthesis.
C57BL/6 mice were injected with adenovirus that expressed MIG12 or β-gal (1011 particles/mouse). Five days after virus administration, mice were injected intraperitoneally with 3H-labeled water (50 mCi) and rates of hepatic FA and cholesterol synthesis were determined as described (28).
Partial Purification of ACC from Mouse Liver.
ACC was enriched from mouse liver using methods of Thampy et. al. (29) with slight modifications described in Supplemental Methods.
In Vitro ACC Activity Assay.
ACC activity was measured as described (19, 30) with minor modifications as described in SI Supplemental Methods.
Analysis of ACC Polymerization by Blue-Native Gels.
Recombinant ACC1 or ACC2 (6 μg) was incubated at 37 °C for 10 min with various concentrations of recombinant mouse MIG12 or BSA in buffer C, which contained 40 mM HEPES, pH 7.6, and 1 mM DTT (final volume, 75 μl). In separate experiments, recombinant ACC1 or ACC2 (6 μg) was incubated with recombinant MIG12 or BSA (0.9 μg) in the presence of various citrate concentrations in buffer C at 37 °C for 10 min (final volume, 75 μl). After the 10 min incubation, the mixture was subjected to 3.5–10% blue-native gel electrophoresis for 12 h at 4 °C and immunoblot analysis performed as described in SI Supplemental Methods.
Analysis of ACC Polymerization by FPLC.
Human recombinant ACC1 or ACC2 (80 μg) was incubated with MIG12 or BSA (10 μg), and the mixture was applied to FPLC using a Superose 6 size exclusion column at a flow rate of 0.4 ml/ min. The first 7 ml of the flow through was discarded and every subsequent 1 ml fraction was collected. An aliquot (10 μl) from each fraction was subjected to SDS/PAGE and the proteins were transferred to a nitrocellulose membrane for immunoblot analysis as described in SI Supplemental Methods.
Analysis of ACC Polymerization in Mouse Liver.
Five male mice were injected with an adenovirus expressing either β-gal or MIG12 (1011 particles/mouse). Mice were killed 5 d after the adenoviral injection and livers were harvested. Equal aliquots of liver (200 mg) from each mouse were pooled (1 g) and homogenized in 10 ml of a buffer containing 40 mM HEPES, pH 7.6, 0.25 M sucrose, and protease inhibitors (Roche). Cytosolic proteins (50 μg) were subjected to 3.5–10% gradient blue-native gel electrophoresis for ACC1 immunoblot analysis as described above.
Supplementary Material
Acknowledgments.
The authors wish to thank Michael S. Brown, David W. Russell, and Joseph L. Goldstein for critical reading of the manuscript. We also thank Norma Anderson, Tuyet Dang, Richard Gibson, and Judy Sanchez for technical assistance, Linda Donnally, Meryl David, and Y.K. Ho for antibody production, and Christopher Gilpin for assistance with electron microscopy. This work was supported by grants from the Perot Family Foundation and the National Institutes of Health HL-20948 and HL-38049.
Footnotes
The authors declare a conflict of interest (such as defined by PNAS policy). Dong Cheng is employed by Bristol-Myers Squibb
*This Direct Submission article had a prearranged editor.
This article contains supporting information online at www.pnas.org/lookup/suppl/doi:10.1073/pnas.1001292107/-/DCSupplemental.
References
- 1.Bensinger SJ, Tontonoz P. Integration of metabolism and inflammation by lipid-activated nuclear receptors. Nature. 2008;454(7203):470–477. doi: 10.1038/nature07202. [DOI] [PubMed] [Google Scholar]
- 2.Chakravarthy MV, et al. Identification of a physiologically relevant endogenous ligand for PPARalpha in liver. Cell. 2009;138(3):476–488. doi: 10.1016/j.cell.2009.05.036. [DOI] [PMC free article] [PubMed] [Google Scholar]
- 3.Moon YA, Hammer RE, Horton JD. Deletion of ELOVL5 leads to fatty liver through activation of SREBP-1c in mice. J Lipid Res. 2009;50(3):412–423. doi: 10.1194/jlr.M800383-JLR200. [DOI] [PMC free article] [PubMed] [Google Scholar]
- 4.Wakil SJ, Abu-Elheiga LA. Fatty acid metabolism: Target for metabolic syndrome. J Lipid Res. 2009;50:S138–143. doi: 10.1194/jlr.R800079-JLR200. [DOI] [PMC free article] [PubMed] [Google Scholar]
- 5.Brookheart RT, Michel CI, Schaffer JE. As a matter of fat. Cell Metab. 2009;10(1):9–12. doi: 10.1016/j.cmet.2009.03.011. [DOI] [PMC free article] [PubMed] [Google Scholar]
- 6.Wakil SJ, Titchener EB, Gibson DM. Evidence for the participation of biotin in the enzymic synthesis of fatty acids. Biochim Biophys Acta. 1958;29(1):225–226. doi: 10.1016/0006-3002(58)90177-x. [DOI] [PubMed] [Google Scholar]
- 7.Bianchi A, et al. Identification of an isozymic form of acetyl-CoA carboxylase. J Biol Chem. 1990;265(3):1502–1509. [PubMed] [Google Scholar]
- 8.Thampy K. Formation of malonyl coenzyme A in rat heart. Identification and purification of an isozyme of A carboxylase from rat heart. J Biol Chem. 1989;264(30):17631–17634. [PubMed] [Google Scholar]
- 9.Abu-Elheiga L, et al. The subcellular localization of acetyl-CoA carboxylase 2. Proc Natl Acad Sci USA. 2000;97(4):1444–1449. doi: 10.1073/pnas.97.4.1444. [DOI] [PMC free article] [PubMed] [Google Scholar]
- 10.McGarry JD, Mannaerts GP, Foster DW. A possible role for malonyl-CoA in the regulation of hepatic fatty acid oxidation and ketogenesis. J Clin Invest. 1977;60(1):265–270. doi: 10.1172/JCI108764. [DOI] [PMC free article] [PubMed] [Google Scholar]
- 11.Kahn BB, Alquier T, Carling D, Hardie DG. AMP-activated protein kinase: Ancient energy gauge provides clues to modern understanding of metabolism. Cell Metab. 2005;1(1):15–25. doi: 10.1016/j.cmet.2004.12.003. [DOI] [PubMed] [Google Scholar]
- 12.Witters LA, Watts TD, Daniels DL, Evans JL. Insulin stimulates the dephosphorylation and activation of acetyl-CoA carboxylase. Proc Natl Acad Sci USA. 1988;85(15):5473–5477. doi: 10.1073/pnas.85.15.5473. [DOI] [PMC free article] [PubMed] [Google Scholar]
- 13.Horton JD, Goldstein JL, Brown MS. SREBPs:activators of the complete program of cholesterol and fatty acid synthesis in the liver. J Clin Invest. 2002;109(9):1125–1131. doi: 10.1172/JCI15593. [DOI] [PMC free article] [PubMed] [Google Scholar]
- 14.Iizuka K, Miller B, Uyeda K. Deficiency of carbohydrate-activated transcription factor ChREBP prevents obesity and improves plasma glucose control in leptin-deficient (ob/ob) mice. Am J Physiol-Endoc M. 2006;291(2):E358–364. doi: 10.1152/ajpendo.00027.2006. [DOI] [PubMed] [Google Scholar]
- 15.Joseph SB, et al. Direct and indirect mechanisms for regulation of fatty acid synthase gene expression by liver X receptors. J Biol Chem. 2002;277(13):11019–11025. doi: 10.1074/jbc.M111041200. [DOI] [PubMed] [Google Scholar]
- 16.Chen G, Liang G, Ou J, Goldstein JL, Brown MS. Central role for liver X receptor in insulin-mediated activation of Srebp-1c transcription and stimulation of fatty acid synthesis in liver. Proc Natl Acad Sci USA. 2004;101(31):11245–11250. doi: 10.1073/pnas.0404297101. [DOI] [PMC free article] [PubMed] [Google Scholar]
- 17.Ishii S, IIzuka K, Miller BC, Uyeda K. Carbohydrate response element binding protein directly promotes lipogenic enzyme gene transcription. Proc Natl Acad Sci USA. 2004;101(44):15597–15602. doi: 10.1073/pnas.0405238101. [DOI] [PMC free article] [PubMed] [Google Scholar]
- 18.Ross KL, Eisenstein RS. Iron deficiency decreases mitochondrial aconitase abundance and citrate concentration without affecting tricarboxylic acid cycle capacity in rat liver. J Nutr. 2002;132(4):643–651. doi: 10.1093/jn/132.4.643. [DOI] [PubMed] [Google Scholar]
- 19.Gregolin C, Ryder E, Kleinschmidt AK, Warner RC, Lane MD. Molecular characteristics of liver acetyl CoA carboxylase. Proc Natl Acad Sci USA. 1966;56(1):148–155. doi: 10.1073/pnas.56.1.148. [DOI] [PMC free article] [PubMed] [Google Scholar]
- 20.Horton JD, et al. Combined analysis of oligonucleotide microarray data from transgenic and knockout mice identifies direct SREBP target genes. Proc Natl Acad Sci USA. 2003;100(21):12027–12032. doi: 10.1073/pnas.1534923100. [DOI] [PMC free article] [PubMed] [Google Scholar]
- 21.Berti C, Fontanella B, Ferrentino R, Meroni G. Mig12, a novel Opitz syndrome gene product partner, is expressed in the embryonic ventral midline and co-operates with Mid1 to bundle and stabilize microtubules. BMC Cell Biol. 2004;5:9. doi: 10.1186/1471-2121-5-9. [DOI] [PMC free article] [PubMed] [Google Scholar]
- 22.Nishi N, Shoji H, Miyanaka H, Nakamura T. Transient up-regulation of a novel member of Spot 14 family in androgen-stimulated rat prostate. Biochim Biophys Acta. 2008;1780(7-8):1004–1009. doi: 10.1016/j.bbagen.2008.05.001. [DOI] [PubMed] [Google Scholar]
- 23.Horton JD, Bashmakov Y, Shimomura I, Shimano H. Regulation of sterol regulatory element binding proteins in livers of fasted and refed mice. Proc Natl Acad Sci USA. 1998;95:5987–5992. doi: 10.1073/pnas.95.11.5987. [DOI] [PMC free article] [PubMed] [Google Scholar]
- 24.Cheng D, et al. Expression, purification, and characterization of human and rat acetyl coenzyme A carboxylase (ACC) isozymes. Protein Expres Purif. 2007;51(1):11–21. doi: 10.1016/j.pep.2006.06.005. [DOI] [PubMed] [Google Scholar]
- 25.Kaushik VK, et al. Characterization of recombinant human acetyl-CoA carboxylase-2 steady-state kinetics. Biochim Biophys Acta. 2009;1794(6):961–967. doi: 10.1016/j.bbapap.2009.02.004. [DOI] [PubMed] [Google Scholar]
- 26.Zhu Q, et al. The Spot 14 protein is required for de novo lipid synthesis in the lactating mammary gland. Endocrinology. 2005;146(8):3343–3350. doi: 10.1210/en.2005-0204. [DOI] [PubMed] [Google Scholar]
- 27.Engelking LJ, et al. Overexpression of Insig-1 in the livers of transgenic mice inhibits SREBP processing and reduces insulin-stimulated lipogenesis. J Clin Invest. 2004;113(8):1168–1175. doi: 10.1172/JCI20978. [DOI] [PMC free article] [PubMed] [Google Scholar]
- 28.Shimano H, et al. Overproduction of cholesterol and fatty acids causes massive liver enlargement in transgenic mice expressing truncated SREBP-1a. J Clin Invest. 1996;98(7):1575–1584. doi: 10.1172/JCI118951. [DOI] [PMC free article] [PubMed] [Google Scholar]
- 29.Thampy KG, Wakil SJ. Regulation of acetyl-coenzyme A carboxylase. I. Purification and properties of two forms of acetyl-coenzyme A carboxylase from rat liver. J Biol Chem. 1988;263(13):6447–6453. [PubMed] [Google Scholar]
- 30.Thampy KG, Wakil SJ. Activation of acetyl-CoA carboxylase. Purification and properties of a Mn2+-dependent phosphatase. J Biol Chem. 1985;260(10):6318–6323. [PubMed] [Google Scholar]
Associated Data
This section collects any data citations, data availability statements, or supplementary materials included in this article.