Abstract
Leptin-deficient ob/ob mice are overweight, develop insulin resistance, and serve as a model for type 2 diabetes (T2D). Studies suggest that inflammatory pathways are linked to the development of insulin resistance and T2D both in animals and humans. We asked whether the induction of regulatory T cells (Tregs) could alleviate the pathological and metabolic abnormalities in ob/ob mice. We induced TGF-β-dependent CD4+ latency-associated peptide (LAP)-positive Tregs by oral administration of anti-CD3 antibody plus β-glucosylceramide. We found a decrease in pancreatic islet cell hyperplasia, fat accumulation in the liver, and inflammation in adipose tissue, accompanied by lower blood glucose and liver enzymes. In addition, treated animals had decreased CD11b+F4/80+ macrophages and TNF-α in adipose tissue. Adoptive transfer of orally induced CD4+LAP+ Tregs ameliorated metabolic and cytokine abnormalities. Our results demonstrate the importance of inflammation in T2D and identify a unique immunological approach for treatment of T2D by the induction of Tregs.
Keywords: adipocytes, oral anti-CD3, type II diabetes, inflammation
Leptin-deficient ob/ob mice are overweight, develop severe insulin resistance elevated liver enzymes, and serve as a model for type 2 diabetes (T2D) and the metabolic syndrome (1, 2). These mice are characterized by an absence of functional leptin, thymic atrophy, and defective immune responses manifested by reduced antigen-specific T-cell proliferation and abnormalities in the number and function of dendritic cells (DCs), regulatory T cells (Tregs), and natural killer T (NKT) cells (3, 4). In recent years, it has become clear that inflammation plays an important role in insulin resistance, and the pathogenesis of T2D with experiments showed that adipose tissue-derived proinflammatory cytokines such as TNF-α could cause insulin resistance in experimental models (5–7). Subsequently, other fat-derived cytokines and bioactive substances such as IL-6, IL-1β, and monocyte chemoattractant protein-1 have been identified (8), and investigators have found that obese adipose tissue is characterized by macrophage infiltration, which serves as an important source of inflammation (9–11).
These observations raise the possibility that therapeutical strategies designed to decrease inflammation in adipose tissue might have a beneficial effect in T2D. Indeed, early experiments suggested that the antiinflammatory effects of salicylates have an ameliorating effect in T2D (12, 13), and recent studies report that IL-1 receptor antagonists may be beneficial in T2D (14).
Tregs play an important role in the maintenance of immunological self-tolerance and have been shown in experimental models to inhibit the development of autoimmune diseases by suppressing potentially autoreactive T cells (15). Treg function is being investigated in a wide range of human inflammatory and infectious diseases and cancer (16–18). We hypothesized that the induction of Tregs might have an ameliorating effect in the ob/ob model of T2D. Consistent with this hypothesis, in a recent report, investigators found a reduction of Tregs in the fat of insulin-resistant models of obesity (19).
The mucosal immune system is unique in that tolerance is preferentially induced after exposure to antigen, and the induction of Tregs is a primary mechanism of oral tolerance (20). We have investigated the induction of Tregs via the mucosal immune system by oral and nasal administration of anti-CD3 monoclonal antibody (21–24). Oral anti-CD3 antibody is rapidly taken up by the gut-associated lymphoid tissue (21, 22) and induces CD4+CD25− latency-associated peptide (LAP)-positive Tregs, which are effective in suppressing autoimmune disease models such as experimental allergic encephalomyelitis, autoimmune diabetes, and lupus in a TGF-β-dependent fashion (21–24). β-glucosylceramide (GC) is a metabolic intermediate in the anabolic and catabolic pathways of glycosphingolipids (25), and administration of GC induces NKT cell-dependent immune regulation in Con A-mediated hepatitis, colitis, and models of insulin resistance (26–29). Furthermore, recent reports have provided evidence of crosstalk between Tregs, DCs, and NKT cells (30, 31) and a role for NKT cells in oral tolerance (32).
Given this background, we investigated the effect of oral anti-CD3 in conjunction with oral GC in the ob/ob model of T2D.
Results
Oral Anti-CD3 + GC Decreases Glucose, Liver Enzymes, and Cholesterol in ob/ob Mice.
The ob/ob mice were fed daily with 5 μg of anti-CD3 plus 100 μg of GC for 5 consecutive days, and blood glucose and aspartate aminotransferase (AST) levels were measured 10 days after feeding. The doses studied were based on our previous studies of anti-CD3 and GC in animal models (18, 21, 26). As shown in Table S1, we observed a decrease in blood glucose in anti-CD3 + GC-treated animals (230 mg/dL) compared with control animals fed PBS (367 mg/dL), GC alone (337 mg/dL), or anti-CD3 alone (316 mg/dL) (P < 0.001). We also observed a decrease in serum AST in animals fed anti-CD3 + GC (267 U/L) compared with control animals (416 U/L) (P < 0.004). Anti-CD3 (296 U/L) or GC alone (310 U/L) also reduced serum AST vs. PBS (P < 0.005), and levels were not significantly different from those of anti-CD3 + GC-treated animals. No change in the weight of animals was observed in the anti-CD3 + GC, anti-CD3, or GC group compared with controls. Similar to our previous studies of oral anti-CD3 (21–23), no effect was observed when an isotype control antibody for anti-CD3 was given. Thus, throughout our studies, we used PBS as an untreated control and compared GC and anti-CD3 alone with the effect of anti-CD3 + GC.
Oral Anti-CD3 + GC Reduces Hepatic Fat Accumulation and Pancreatic Hyperplasia.
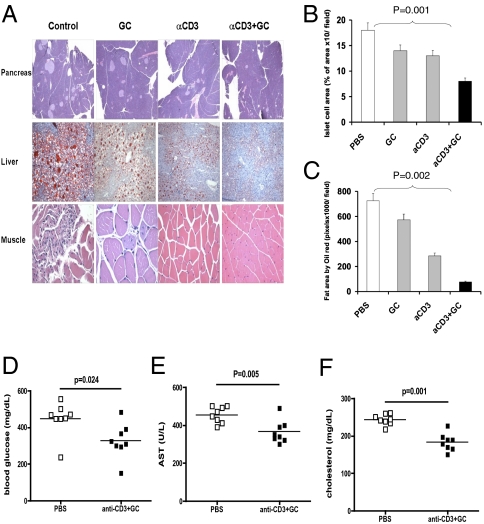
After observing these metabolic effects, we measured the effect of oral anti-CD3 + GC in ob/ob mice by pathological analysis of the pancreas, liver, and muscle (Fig. 1A). We found that animals fed anti-CD3 + GC had a significant reduction in pancreatic hyperplasia (Fig. 1B; P = 0.001 vs. PBS) and hepatic fat accumulation (Fig. 1C; P = 0.002 vs. PBS). Anti-CD3 + GC was more effective than anti-CD3 or GC alone, although some effect was observed when the compounds were given individually. Furthermore, as shown in Fig. 1A, we observed a reversal of muscle fiber thinning and increased nuclei in animals treated with oral anti-CD3 + GC. Having shown an effect of oral anti-CD3 + GC on disease pathology, we next investigated the long-term therapeutical effects of oral anti-CD3 + GC. The ob/ob mice were fed anti-CD3 + GC or PBS as a control. Thirty days following treatment, mice were analyzed for levels of glucose, AST, and cholesterol in blood. We found that oral anti-CD3 + GC significantly reduced the level of glucose (Fig. 1D), AST (Fig. 1E), and cholesterol (Fig. 1F), demonstrating a long-term therapeutical effect on metabolic disease in ob/ob mice.
Fig. 1.
Oral anti (a)-CD3 + GC reduces hepatic fat accumulation and pancreatic hyperplasia. (A) Thirty days after oral treatment, H&E staining of the pancreas and muscle and oil-red-O staining of the liver from ob/ob mice (10 per group) were carried out. Five fields per mouse per group were analyzed. Representative pictures are shown. All pictures were taken at a magnification of ×10. (B) Quantification of the pancreatic islet cell area was carried out by examining five fields of 10 islets per field per mouse in each treatment group. Slides were examined at a magnification of ×10 in a blindfolded fashion. Data bars represent average percentages of islet areas in each treatment group. (C) Quantification of the fat area in liver (pixels × 1,000 per field). All slides were read in a random fashion, blinded to treatment group. These experiments were repeated twice with the same results. Error bars represent SD. The ob/ob mice (eight per group) were fed PBS or a-CD3 + GC for 5 consecutive days. Glucose (D), AST (E), and cholesterol (F) levels in ob/ob mice were examined on day 30 following feeding. Data points represent individual mice. The means of each group are indicated by crossbars.
Oral Anti-CD3 + GC Enhances Production of TGF-β and IL-10 in the Mesenteric Lymph Node.
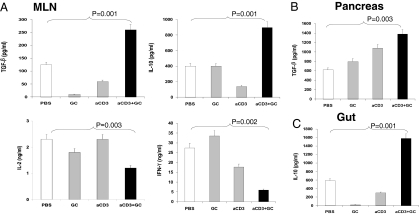
To investigate the potential mechanisms by which oral anti-CD3 + GC affected the metabolic abnormalities described above, we measured cytokine production by mesenteric lymph node (MLN) cells stimulated in vitro with 1 μg/mL plate-bound anti-CD3 5 days after the last feeding. As shown in Fig. 2A, we found an increase in the production of both TGF-β and IL-10 in animals treated with anti-CD3 + GC (P = 0.001 vs. PBS). No effects were observed with anti-CD3 or GC given alone. Oral anti-CD3 + GC also decreased IL-2 (P = 0.003) and IFN-γ (P = 0.002) secretion vs. that in PBS-fed animals. A similar increase of TGF-β and IL-10 was also observed in splenocytes. In addition, we measured cytokine levels in supernatants from homogenized tissues from anti-CD3 + GC-fed mice. We found an increase of TGF-β in the pancreas (Fig. 2B) (P = 0.003 vs. PBS) and an increase of IL-10 in the gut (Fig. 2C) (P = 0.001 vs. PBS) in anti-CD3 + GC-treated mice (P < 0.005 vs. PBS). Furthermore, we isolated CD11c+ DCs from the pancreas and found that they have increased TGF-β message (Fig. S1A) and produced a higher level of bioactive TFG-β1 (Fig. S1B) following in vitro activation. An increase in TGF-β was also found in the liver: anti-CD3 + GC (890 pg/mL) vs. PBS (720 pg/mL) (P < 0.005 vs. PBS). We did not observe an increase of IL-10 in the pancreas or an increase of TGF-β in the gut.
Fig. 2.
Production of TGF-β and IL-10 in the MLN, pancreas, and gut following oral administration of anti (a)-CD3 + GC. (A) TGF-β, IL-10, IL-2, and IFN-γ levels were measured in MLN cells (10 mice per group) following in vitro anti-CD3 stimulation (1 μg/mL) 5 days after the last treatment. TGF-β (B) and IL-10 (C) content in supernatants from homogenized pancreas and gut was measured 10 days after the last treatment. These experiments were repeated twice with same results. Error bars represent SD.
Oral Anti-CD3 + GC Increases CD4+LAP+ Cells and Decreases NKT Cells.
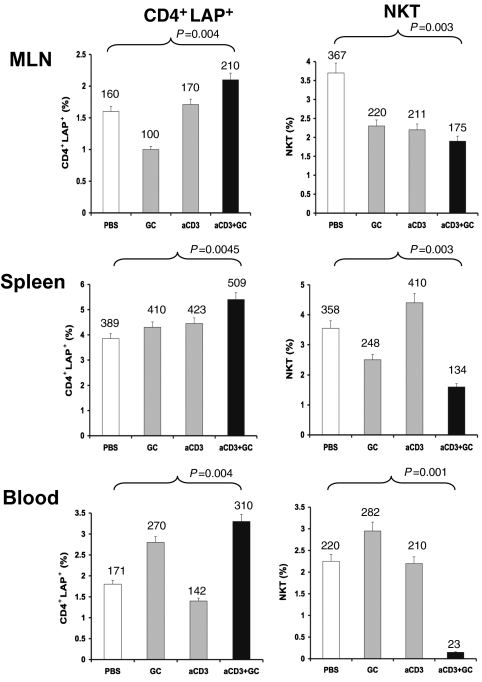
We previously reported that oral anti-CD3 increases the number of LAP+ T cells (21). LAP is the amino-terminal domain of the TGF-β precursor peptide and remains noncovalently associated with the TGF-β peptide after cleavage, forming the latent TGF-β complex (33–35). We thus asked whether oral anti-CD3 + GC was associated with increased CD4+LAP+ cells in lymphoid tissues. As shown in Fig. 3, the percentage of CD4+LAP+ lymphocytes increased in MLN, spleen, and blood 5 days after the last feeding of anti-CD3 + GC. We then measured NKT cells and found a decrease of NKT cells in MLN, spleen, and blood of anti-CD3 + GC-fed animals. Of note, we did not find an increase of Foxp3 expression in T cells following oral anti-CD3 + GC.
Fig. 3.
Oral anti (a)-CD3 + GC increases CD4+LAP+ cells and decreases NKT cells in MLN, spleen, and blood. The percentages of CD4+LAP+ T cells and NKT cells were measured by FACS analysis in MLN, spleen, and blood of ob/ob mice (10 per group) fed with a-CD3 + GC, a-CD3, GC, or PBS 5 days after the last treatment. The percentages of CD4+LAP+ T cells and NKT cells in a total of 1 × 10⁴ events are presented. The numbers shown on top of each data bar represent the total number of cells. These experiments were repeated twice with the same results. Error bars represent SD.
Adoptive Transfer of CD4+LAP+ T Cells Ameliorates Metabolic Abnormalities and Decreases IL-17, IFN-γ, and IL-6 in ob/ob Mice.
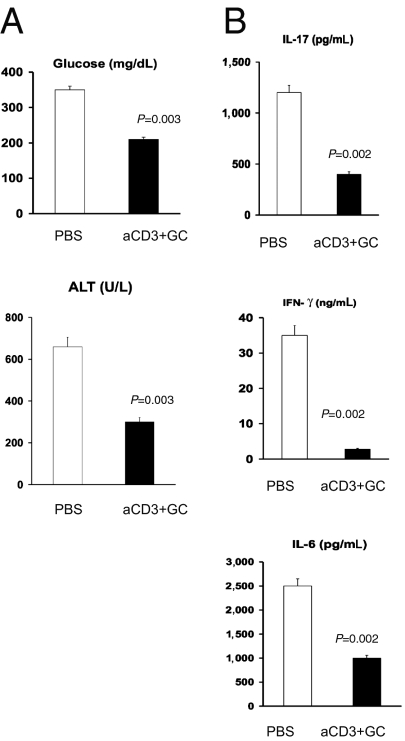
To investigate the in vivo role of LAP+ cells in the effects we observed, we adoptively transferred sorted CD4+LAP+ and CD4+LAP− cells harvested from the spleens of ob/ob donors fed with anti-CD3 + GC to naive ob/ob recipients. As shown in Fig. 4A, adoptive transfer of 4 × 10⁴ LAP+ cells from anti-CD3 + GC-fed ob/ob donors resulted in a decrease of serum glucose levels in ob/ob recipients (P = 0.003). We found similar results when we measured alanine aminotransferase (ALT; Fig. 4A). We next measured the effect of adoptive transfer of LAP+ cells on the inflammatory cytokines IL-17, IFN-γ, and IL-6 in splenocytes stimulated with plate-bound anti-CD3. As shown in Fig. 4B, similar to the metabolic parameters measured, adoptive transfer of CD4+LAP+ cells significantly decreased the levels of these inflammatory cytokines. No effect on metabolic measures or cytokines was observed when LAP− cells from anti-CD3 + GC-fed animals were transferred.
Fig. 4.
Adoptive transfer of CD4+LAP+ T cells ameliorates metabolic abnormalities and decreases IL-17, IFN-γ, and IL-6 in ob/ob mice. CD4+LAP+ cells (4 × 10⁴) harvested from spleens of ob/ob mice (10 per group) fed anti (a)-CD3 + GC were adoptively transferred into naive ob/ob recipients (5 per group) to measure the effect of CD4+LAP+ cells on the metabolic syndrome (A) and inflammatory cytokine patterns (B) in recipients. Cytokines were measured in splenocytes stimulated with a-CD3 antibodies. These experiments were repeated twice with the same results. Error bars represent SD.
DCs from MLN of ob/ob Mice Fed Anti-CD3 + GC Have Increased Expression of TGF-β and IL-10, and T Cells Cultured with DCs from Anti-CD3 + GC-Fed Mice Produce Less IL-2, IL-6, and IL-17.
To investigate the effect of feeding anti-CD3 + GC on DCs, we first measured the expression of TGF-β and IL-10 in DCs from MLN. As shown in Fig. S2A, there was an increase of both TGF-β (P = 0.002) and IL-10 (P = 0.003) mRNA expression in anti-CD3 + GC-fed animals. Analogous effects were seen with oral anti-CD3 alone but not with GC alone. Injection of anti-TGF-β reversed the effect. Because we observed (Fig. 2) that T cells from anti-CD3 + GC-fed mice produced less IL-2 and IFN-γ, we asked whether this was a property of T cells or of DCs. We cocultured T cells from CD3 + GC-fed or control mice with DCs from CD3 + GC-fed or control animals in the presence of plate-bound anti-CD3. As shown in Fig. S2B, a decreased proliferative response and decreased IL-2, IL-6, and IL-17 secretion by CD4 T cells were linked to the source of DCs and were seen irrespective of whether the T cells were from PBS-fed or anti-CD3 + GC-fed animals. This points to an instrumental role of DCs in the immunological effect of oral anti-CD3 + GC.
Effect of Oral Anti-CD3 + GC on Adipose Tissue.
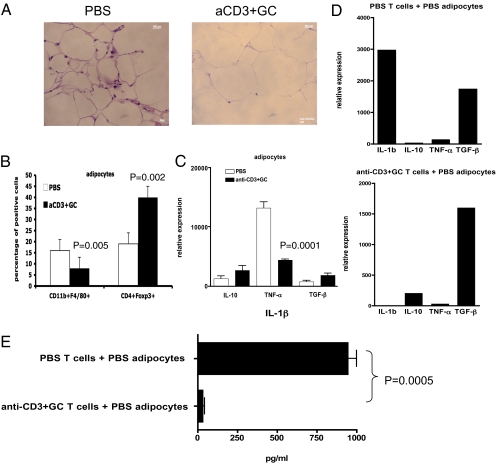
Because it has been shown that an inflammatory response occurs in adipose tissue of ob/ob mice (5–11), we investigated the effect of oral anti-CD3 + GC on adipose tissue. We fed ob/ob mice with PBS or anti-CD3 + GC orally for 5 days, and 3 days after the last feeding, we isolated adipocytes from gonadal s.c. fat tissues. As shown in Fig. 5A, H&E staining of fat showed cell infiltration in control mice that was decreased by oral anti-CD3 + GC treatment. We next measured specific cell populations, and, as shown in Fig. 5B, we found a decrease in CD11b+F4/80+ macrophages and an increase in CD4+Foxp3+ Tregs in fat. Of note, we did not observe a significant increase in CD4+LAP+ T cells in these studies. To investigate cytokine expression by adipose tissue, RNA was extracted from adipocytes and cytokine expression was measured by RT-PCR. As shown in Fig. 5C, we found that oral anti-CD3 + GC markedly suppressed the level of TNF-α in adipose tissue (P = 0.0001). Finally, to examine the role of T cells in driving the expression of cytokines by adipocytes, we cocultured negatively selected CD4+ T cells from PBS-fed or anti-CD3 + GC-fed mice with autologous adipocytes isolated from gonadal fat tissues for 5 days in the presence of plate-bound anti-CD3/CD28 antibodies in vitro. Adipocytes were isolated by positive elimination of CD4+ T cells from coculture, and RNA was extracted for RT-PCR analysis. As shown in Fig. 5D, adipocytes cocultured with control CD4+ T cells expressed high levels of IL-1β, whereas adipocytes cocultured with CD4+ T cells from anti-CD3 + GC-fed mice did not express IL-1β. This is also reflected in the amount of soluble IL-1β being produced by adipocytes (Fig. 5E). These findings suggest that oral anti-CD3 + GC led to Treg trafficking to adipose tissues and decreased inflammatory responses by adipocytes in ob/ob mice.
Fig. 5.
Oral anti-CD3 + GC decreases CD11b+F4/80+ macrophages, TNF-α, and IL-1 and increases CD4+Foxp3+ cells in adipose tissue of ob/ob mice. (A) Mice (four per group) were fed PBS or anti-CD3 (5 μg) plus GC (100 μg) for 5 consecutive days. At 72 h after the last feeding, perigonadal white fat was collected and fat paraffin sections were stained with H&E. Pictures were taken at a magnification of ×100. (B) At 72 h after the last feeding (six mice per group), white fat near or surrounding MLNs was used to isolate adipocytes. Adipocytes were stained with fluorescent antibodies to CD11b and F4/80 or CD4 and were then fixed, permeabilized, and stained with antibody to Foxp3. aCD3, anti-CD3. (C) At 72 h after the last feeding, RNA of adipocytes isolated from perigonadal fat was used in quantitative RT-PCR for cytokine expression of IL-10, TNF-α, and TGF-β. (D) CD4+ T cells were negatively selected from spleens of PBS- or anti-CD3 + GC-fed mice and cocultured with adipocytes from control mice at a 1:1 ratio for 5 days. CD4+ T cells were eliminated from coculture by positive selection, leaving adipocytes for extraction of RNA used in quantitative RT-PCR for cytokine expression. These experiments were repeated three times with the same results. Error bars represent SD. (E) Culture supernatants were harvested from cocultures of CD4+ T cells from control or anti-CD3 + GC-fed mice and adipocytes of control mice. The amount of IL-1β was measured by ELISA.
Discussion
There is growing evidence that there may be a link between inflammation and T2D (7, 8, 36). This concept provides a unique avenue to investigate immunotherapeutical approaches to both understand and treat T2D. Although Tregs have been extensively investigated in animal models and human subjects with autoimmunity and T1D (15, 18, 37, 38), the induction of Tregs to treat T2D has not been performed until recently (39). In the present study, we used the mucosal immune system to induce Tregs, and we demonstrate a profound effect both on metabolic parameters and pathological abnormalities in the pancreas, liver, and muscle of the ob/ob mouse model of T2D. These effects were mediated by the induction of a CD4+LAP+ T cell that could adoptively transfer protection.
CD4+LAP+ Tregs are distinct from naturally occurring Foxp3+ Tregs and function in a TGF-β-dependent fashion (21, 35, 40). LAP is the amino-terminal domain of the TGF-β precursor peptide and remains noncovalently associated with the TGF-β peptide after cleavage, forming the latent TGF-β complex (33, 34). In vivo, TGF-β regulates the expression of Foxp3 and expands Foxp3-expressing CD4+CD25+ T cells (41). In our study, although oral anti-CD3 + GC did not induce Foxp3 Tregs in the periphery, we observed an increase of Foxp3 cells in adipose tissue. We postulate that the increased production of TGF-β by the LAP+ cells induced by oral anti-CD3 + GC led to induction of Foxp3+ Tregs, which were then increased in adipose tissue and associated with decreased inflammation.
We tested the effect of GC given together with oral anti-CD3, and the effect we noted on metabolic and pathological abnormalities in the ob/ob mouse was primarily observed with this combination therapy. β-glycosphingolipids interact with CD1d, a nonpolymorphic MHC class I-like molecule expressed by antigen-presenting cells and NKT lymphocytes (42). NKT cells are a class of T cells that express invariant Vα-chain and have been shown to be involved in oral tolerance (32). Furthermore, IL-10 and TGF-β production are reduced in splenocytes and Peyer's patches (32) from ovalbumin-fed CD1d−/− mice compared with WT controls. Oral administration of GC exerts an immunomodulatory effect on NKT cell-dependent models of T2D (27). We observed a decrease in NKT cells in anti-CD3 + GC-treated animals. Thus, the effect of GC appears to be related both to enhancing induction of LAP+ Tregs by anti-CD3 and direct effects on NKT cells.
Intestinal DCs have emerged as key regulators of oral tolerance and intestinal inflammation (43). The conversion of vitamin A to retinoic acid in gut-associated DCs enhances the TGF-β-dependent conversion of naive T cells to Tregs as well as directing Treg-homing to the gut (44). We found that oral anti-CD3 + GC altered the function of MLN-derived DCs in a way that enhanced production of TGF-β and IL-10 by T cells in the MLN and decreased production of inflammatory cytokines such as IL-6 and IL-17. We believe that oral anti-CD3 binds directly to T cells in the gut and delivers a weak signal that induces LAP+ Tregs and that GC interacts with NKT cells, which further affects DCs. The induction of CD4+LAP+ T cells in the MLN then affects target organs, because we found increased levels of TGF-β in the pancreas and liver and decreased inflammation in adipose tissue. The phenotype of intestinal DCs that mediate the generation of Tregs in the gut following oral anti-CD3 + GC is not known. However, our previous studies have shown that a plasmacytoid-like DC (CD11cintCD11blowCD8α−CD45RBhiB220hi) that secretes IL-10 and TGF-β is important in the mechanism of Treg generation (45).
Because it has become clear that inflammation in adipose tissue plays an important role in insulin resistance and the pathogenesis of T2D (5–11), we examined whether the positive effects of oral anti-CD3 + GC that we observed in the pancreas, liver, and muscle were also reflected in changes in adipose tissue. Indeed, we found a decrease in CD11b+F4/80 monocytes in adipose tissue of ob/ob mice fed anti-CD3 + GC compared with control mice. Furthermore, we found a marked decreased TNF-α expression, which is a major pathway related to insulin resistance in T2D (5, 6), in adipose tissue of anti-CD3 + GC-fed animals. Finally, when we cocultured T cells from anti-CD3 + GC-fed animals with adipocytes, we found there was a dramatic decrease in the ability of adipocytes to produce IL-1β, another important inflammatory cytokine associated with adipose inflammation.
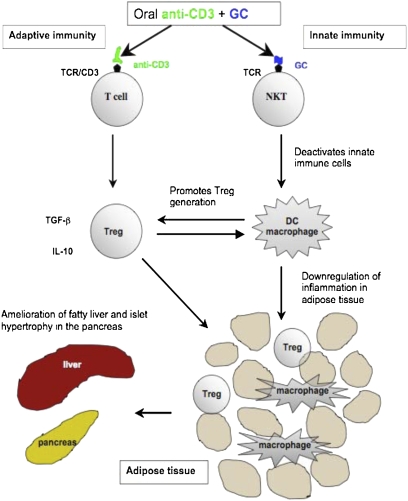
In summary, we demonstrate that CD4+LAP+ Tregs from ob/ob mice fed anti-CD3 + GC alleviate the metabolic syndrome in ob/ob mice. As shown in Fig. 6, we hypothesize that oral anti-CD3 stimulates the adaptive immune system via the T-cell receptor and leads to the induction of Tregs. Oral GC stimulates NKT cells and affects innate immunity by deactivating inflammatory macrophages and conditioning DCs to a tolerogenic phenotype. This further promotes the generation of Tregs, which then traffic to adipose tissue and suppress local inflammation. This leads to reversal of insulin resistance, amelioration of the metabolic syndrome, and reduction of pathological abnormalities in the liver (fat infiltration) and pancreas (islet cell hyperplasia). Induction of Tregs is one of the major goals in immunotherapy of autoimmune diseases and transplantation. Our results identify an approach to treat T2D based on the induction of Tregs.
Fig. 6.
Schematic diagram of the mechanisms of oral anti-CD3 + GC in controlling inflammation.
Methods
Mice.
C57BL/6 (B6) or ob/ob mice, aged 8–10 weeks, were purchased from the Jackson Laboratory. Mice were housed in our pathogen-free animal facility at the Harvard Institutes of Medicine according to the animal protocol guidelines of Harvard University.
Oral Administration and Injections.
Mice were fed a total volume of 0.2 mL by gastric intubation with an 18-gauge stainless-steel feeding needle (Thomas Scientific). Mice were fed once a day for 5 consecutive days with either PBS, hamster isotype control (5 μg per feeding), anti-CD3 antibody (5 μg per feeding), or GC (100 μg per feeding) dissolved in ethanol and emulsified in PBS. Mice fed with the combination of anti-CD3 and GC received 5 μg of anti-CD3 and 100 μg of GC in 0.2 mL of PBS. Mice were injected i.p. with 100 μg of anti-TGF-β 1 day before the feeding and were then given another four injections on alternate days for a total of 500 μg.
Analysis of Adipose Tissue, Liver Enzymes, Cholesterol, and Blood Glucose.
Mice (four per group) were fed PBS or anti-CD3 (5 μg) plus GC (100 μg) for 5 consecutive days. Seventy-two hours after the last feeding, perigonadal white fat was collected and fat paraffin sections were stained with H&E. Pictures were taken at a magnification of ×40. Also, at 72 h after the last feeding (six mice per group), white fat near or surrounding MLNs was used to isolate adipocytes. Adipocytes were stained with fluorescent antibodies to CD11b and F4/80 or CD4 and were then fixed, permeabilized, and stained with antibody to Foxp3. RNA of adipocytes isolated from perigonadal fat was used in quantitative RT-PCR for cytokine expression of IL-10, TNF-α, and TGF-β. CD4+ T cells were negatively selected from spleens of PBS- or anti-CD3 + GC-fed mice and cocultured with adipocytes from control mice at a 1:1 ratio for 5 days. CD4+ T cells were eliminated from coculture by positive selection, leaving adipocytes for extraction of RNA used in quantitative RT-PCR for cytokine expression. Liver enzymes AST and ALT and cholesterol were measured by the Clinical Biochemistry Laboratory at the Brigham and Women's Hospital in a blindfolded fashion. Blood glucose level was measured using Diastix reagent strips (Fisher Scientific) according to the manufacturer's protocol.
Supplementary Material
Footnotes
Conflict of interest statement: Y.I. and H.L.W. are consultants for Nasvax.
This article is a PNAS Direct Submission. S.S. is a guest editor invited by the Editorial Board.
This article contains supporting information online at www.pnas.org/lookup/suppl/doi:10.1073/pnas.0908771107/-/DCSupplemental.
References
- 1.Pelleymounter MA, et al. Effects of the obese gene product on body weight regulation in ob/ob mice. Science. 1995;269:540–543. doi: 10.1126/science.7624776. [DOI] [PubMed] [Google Scholar]
- 2.Cohen B, Novick D, Rubinstein M. Modulation of insulin activities by leptin. Science. 1996;274:1185–1188. doi: 10.1126/science.274.5290.1185. [DOI] [PubMed] [Google Scholar]
- 3.Macia L, et al. Impairment of dendritic cell functionality and steady-state number in obese mice. J Immunol. 2006;177:5997–6006. doi: 10.4049/jimmunol.177.9.5997. [DOI] [PubMed] [Google Scholar]
- 4.Palmer G, et al. Indirect effects of leptin receptor deficiency on lymphocyte populations and immune response in db/db mice. J Immunol. 2006;177:2899–2907. doi: 10.4049/jimmunol.177.5.2899. [DOI] [PubMed] [Google Scholar]
- 5.Hotamisligil GS, Shargill NS, Spiegelman BM. Adipose expression of tumor necrosis factor-alpha: Direct role in obesity-linked insulin resistance. Science. 1993;259:87–91. doi: 10.1126/science.7678183. [DOI] [PubMed] [Google Scholar]
- 6.Feinstein R, Kanety H, Papa MZ, Lunenfeld B, Karasik A. Tumor necrosis factor-alpha suppresses insulin-induced tyrosine phosphorylation of insulin receptor and its substrates. J Biol Chem. 1993;268:26055–26058. [PubMed] [Google Scholar]
- 7.Shoelson SE, Lee J, Goldfine AB. Inflammation and insulin resistance. J Clin Invest. 2006;116:1793–1801. doi: 10.1172/JCI29069. [DOI] [PMC free article] [PubMed] [Google Scholar]
- 8.Wellen KE, Hotamisligil GS. Inflammation, stress, and diabetes. J Clin Invest. 2005;115:1111–1119. doi: 10.1172/JCI25102. [DOI] [PMC free article] [PubMed] [Google Scholar]
- 9.Xu H, et al. Chronic inflammation in fat plays a crucial role in the development of obesity-related insulin resistance. J Clin Invest. 2003;112:1821–1830. doi: 10.1172/JCI19451. [DOI] [PMC free article] [PubMed] [Google Scholar]
- 10.Weisberg SP, et al. Obesity is associated with macrophage accumulation in adipose tissue. J Clin Invest. 2003;112:1796–1808. doi: 10.1172/JCI19246. [DOI] [PMC free article] [PubMed] [Google Scholar]
- 11.Wellen KE, Hotamisligil GS. Obesity-induced inflammatory changes in adipose tissue. J Clin Invest. 2003;112:1785–1788. doi: 10.1172/JCI20514. [DOI] [PMC free article] [PubMed] [Google Scholar]
- 12.Yuan M, et al. Reversal of obesity- and diet-induced insulin resistance with salicylates or targeted disruption of Ikkbeta. Science. 2001;293:1673–1677. doi: 10.1126/science.1061620. [DOI] [PubMed] [Google Scholar]
- 13.Hundal RS, et al. Mechanism by which high-dose aspirin improves glucose metabolism in type 2 diabetes. J Clin Invest. 2002;109:1321–1326. doi: 10.1172/JCI14955. [DOI] [PMC free article] [PubMed] [Google Scholar]
- 14.Ehses JA, et al. IL-1 antagonism reduces hyperglycemia and tissue inflammation in the type 2 diabetic GK rat. Proc Natl Acad Sci USA. 2009;106:13998–14003. doi: 10.1073/pnas.0810087106. [DOI] [PMC free article] [PubMed] [Google Scholar]
- 15.Asano M, Toda M, Sakaguchi N, Sakaguchi S. Autoimmune disease as a consequence of developmental abnormality of a T cell subpopulation. J Exp Med. 1996;184:387–396. doi: 10.1084/jem.184.2.387. [DOI] [PMC free article] [PubMed] [Google Scholar]
- 16.Baecher-Allan C, Hafler DA. Human regulatory T cells and their role in autoimmune disease. Immunol Rev. 2006;212:203–216. doi: 10.1111/j.0105-2896.2006.00417.x. [DOI] [PubMed] [Google Scholar]
- 17.Belkaid Y. Regulatory T cells and infection: A dangerous necessity. Nat Rev Immunol. 2007;7:875–888. doi: 10.1038/nri2189. [DOI] [PubMed] [Google Scholar]
- 18.Roncarolo MG, Battaglia M. Regulatory T-cell immunotherapy for tolerance to self antigens and alloantigens in humans. Nat Rev Immunol. 2007;7:585–598. doi: 10.1038/nri2138. [DOI] [PubMed] [Google Scholar]
- 19.Feuerer M, et al. Lean, but not obese, fat is enriched for a unique population of regulatory T cells that affect metabolic parameters. Nat Med. 2009;15:930–939. doi: 10.1038/nm.2002. [DOI] [PMC free article] [PubMed] [Google Scholar]
- 20.Faria AM, Weiner HL. Oral tolerance. Immunol Rev. 2005;206:232–259. doi: 10.1111/j.0105-2896.2005.00280.x. [DOI] [PMC free article] [PubMed] [Google Scholar]
- 21.Ochi H, et al. Oral CD3-specific antibody suppresses autoimmune encephalomyelitis by inducing CD4+ CD25− LAP+ T cells. Nat Med. 2006;12:627–635. doi: 10.1038/nm1408. [DOI] [PubMed] [Google Scholar]
- 22.Ishikawa H, et al. Inhibition of autoimmune diabetes by oral administration of anti-CD3 monoclonal antibody. Diabetes. 2007;56:2103–2109. doi: 10.2337/db06-1632. [DOI] [PubMed] [Google Scholar]
- 23.Wu HY, Center EM, Tsokos GC, Weiner HL. Suppression of murine SLE by oral anti-CD3: Inducible CD4+CD25−LAP+ regulatory T cells control the expansion of IL-17+ follicular helper T cells. Lupus. 2009;18:586–596. doi: 10.1177/0961203308100511. [DOI] [PMC free article] [PubMed] [Google Scholar]
- 24.Wu HY, Quintana FJ, Weiner HL. Nasal anti-CD3 antibody ameliorates lupus by inducing an IL-10-secreting CD4+ CD25− LAP+ regulatory T cell and is associated with down-regulation of IL-17+ CD4+ ICOS+ CXCR5+ follicular helper T cells. J Immunol. 2008;181:6038–6050. doi: 10.4049/jimmunol.181.9.6038. [DOI] [PMC free article] [PubMed] [Google Scholar]
- 25.Lalazar G, Preston S, Zigmond E, Ben Yáacov A, Ilan Y. Glycolipids as immune modulatory tools. Mini-Rev Med Chem. 2006;6:1249–1253. doi: 10.2174/138955706778742722. [DOI] [PubMed] [Google Scholar]
- 26.Margalit M, et al. Glucocerebroside treatment ameliorates ConA hepatitis by inhibition of NKT lymphocytes. Am J Physiol. 2005;289:G917–G925. doi: 10.1152/ajpgi.00105.2005. [DOI] [PubMed] [Google Scholar]
- 27.Margalit M, et al. Glucocerebroside ameliorates the metabolic syndrome in OB/OB mice. J Pharmacol Exp Ther. 2006;319:105–110. doi: 10.1124/jpet.106.104950. [DOI] [PubMed] [Google Scholar]
- 28.Safadi R, Zigmond E, Pappo O, Shalev Z, Ilan Y. Amelioration of hepatic fibrosis via beta-glucosylceramide-mediated immune modulation is associated with altered CD8 and NKT lymphocyte distribution. Int Immunol. 2007;19:1021–1029. doi: 10.1093/intimm/dxm069. [DOI] [PubMed] [Google Scholar]
- 29.Trop S, Nagler A, Ilan Y. Role of NK1.1+ and AsGm-1+ cells in oral immunoregulation of experimental colitis. Inflamm Bowel Dis. 2003;9:75–86. doi: 10.1097/00054725-200303000-00001. [DOI] [PubMed] [Google Scholar]
- 30.La Cava A, Van Kaer L, Fu-Dong-Shi CD4+CD25+ Tregs and NKT cells: Regulators regulating regulators. Trends Immunol. 2006;27:322–327. doi: 10.1016/j.it.2006.05.003. [DOI] [PubMed] [Google Scholar]
- 31.Zigmond E, et al. Beta-glucosylceramide: A novel method for enhancement of natural killer T lymphocyte plasticity in murine models of immune-mediated disorders. Gut. 2007;56:82–89. doi: 10.1136/gut.2006.095497. [DOI] [PMC free article] [PubMed] [Google Scholar]
- 32.Kim HJ, Hwang SJ, Kim BK, Jung KC, Chung DH. NKT cells play critical roles in the induction of oral tolerance by inducing regulatory T cells producing IL-10 and transforming growth factor beta, and by clonally deleting antigen-specific T cells. Immunology. 2006;118:101–111. doi: 10.1111/j.1365-2567.2006.02346.x. [DOI] [PMC free article] [PubMed] [Google Scholar]
- 33.Saharinen J, Hyytiäinen M, Taipale J, Keski-Oja J. Latent transforming growth factor-beta binding proteins (LTBPs)—Structural extracellular matrix proteins for targeting TGF-beta action. Cytokine Growth Factor Rev. 1999;10:99–117. doi: 10.1016/s1359-6101(99)00010-6. [DOI] [PubMed] [Google Scholar]
- 34.Verma SC, Lan K, Robertson E. Structure and function of latency-associated nuclear antigen. Curr Top Microbiol Immunol. 2007;312:101–136. doi: 10.1007/978-3-540-34344-8_4. [DOI] [PMC free article] [PubMed] [Google Scholar]
- 35.Oida T, et al. CD4+CD25− T cells that express latency-associated peptide on the surface suppress CD4+CD45RBhigh-induced colitis by a TGF-beta-dependent mechanism. J Immunol. 2003;170:2516–2522. doi: 10.4049/jimmunol.170.5.2516. [DOI] [PubMed] [Google Scholar]
- 36.Nishimura S, et al. R.CD8+ effector T cells contribute to macrophage recruitment and adipose tissue inflammation in obesity. Nat Med. 2009;15:914–920. doi: 10.1038/nm.1964. [DOI] [PubMed] [Google Scholar]
- 37.Chatenoud L, Bach JF. Regulatory T cells in the control of autoimmune diabetes: The case of the NOD mouse. Int Rev Immunol. 2005;24:247–267. doi: 10.1080/08830180590934994. [DOI] [PubMed] [Google Scholar]
- 38.Randolph DA, Fathman CG. Cd4+Cd25+ regulatory T cells and their therapeutic potential. Annu Rev Med. 2006;57:381–402. doi: 10.1146/annurev.med.57.121304.131337. [DOI] [PubMed] [Google Scholar]
- 39.Winer S, et al. Normalization of obesity-associated insulin resistance through immunotherapy. Nat Med. 2009;A15(8):921–929. doi: 10.1038/nm.2001. [DOI] [PMC free article] [PubMed] [Google Scholar]
- 40.Gandhi R, et al. Cutting edge: human latency-associated peptide(+) T cells: a novel regulatory T cell subset. J Immunol. 2010;184:4620–4624. doi: 10.4049/jimmunol.0903329. [DOI] [PMC free article] [PubMed] [Google Scholar]
- 41.Bettelli E, et al. Reciprocal developmental pathways for the generation of pathogenic effector TH17 and regulatory T cells. Nature. 2006;441:235–238. doi: 10.1038/nature04753. [DOI] [PubMed] [Google Scholar]
- 42.Bendelac A, Savage PB, Teyton L. The biology of NKT cells. Annu Rev Immunol. 2007;25:297–336. doi: 10.1146/annurev.immunol.25.022106.141711. [DOI] [PubMed] [Google Scholar]
- 43.Niess JH, Reinecker HC. Dendritic cells: The commanders-in-chief of mucosal immune defenses. Curr Opin Gastroenterol. 2006;22:354–360. doi: 10.1097/01.mog.0000231807.03149.54. [DOI] [PubMed] [Google Scholar]
- 44.von Boehmer H. Oral tolerance: Is it all retinoic acid? J Exp Med. 2007;204:1737–1739. doi: 10.1084/jem.20071251. [DOI] [PMC free article] [PubMed] [Google Scholar]
- 45.Awasthi A, et al. A dominant function for interleukin 27 in generating interleukin 10-producing anti-inflammatory T cells. Nat Immunol. 2007;8:1380–1389. doi: 10.1038/ni1541. [DOI] [PubMed] [Google Scholar]
Associated Data
This section collects any data citations, data availability statements, or supplementary materials included in this article.


