Abstract
Purpose
For optimizing the local, pulmonary targeting of inhaled medications, it is important to analyze the relationship between the physicochemical properties of small molecules and their absorption, retention and distribution in the various cell types of the airways and alveoli.
Methods
A computational, multiscale, cell-based model was constructed to facilitate analysis of pulmonary drug transport and distribution. The relationship between the physicochemical properties and pharmacokinetic profile of monobasic molecules was explored. Experimental absorption data of compounds with diverse structures were used to validate this model. Simulations were performed to evaluate the effect of active transport and organelle sequestration on the absorption kinetics of compounds.
Results
Relating the physicochemical properties to the pharmacokinetic profiles of small molecules reveals how the absorption half-life and distribution of compounds are expected to vary in different cell types and anatomical regions of the lung. Based on logP, pKa and molecular radius, the absorption rate constants (Ka) calculated with the model were consistent with experimental measurements of pulmonary drug absorption.
Conclusions
The cell-based mechanistic model developed herein is an important step towards the rational design of local, lung-targeted medications, facilitating the design and interpretation of experiments aimed at optimizing drug transport properties in lung.
INTRODUCTION
The therapeutic benefits of inhaled drugs for treating pulmonary diseases (e.g. asthma, chronic obstructive pulmonary disease (COPD) and pulmonary hypertension) have been appreciated for several decades (1, 2). These benefits include the rapid onset of drug action, low systemic exposure and resultant reduction in side effects (3). In addition, the large absorptive surface area, limited metabolic enzyme activity and active transporters in the pulmonary system make inhalation a favorable delivery strategy for systemic drugs with low bioavailability (4–6). Inhaled formulations of locally- and systemically-active drugs have been used for quite some time, including formulations of biological agents that are poorly bioavailable such as peptides, proteins, and oligonucleotides (7–11).
Although inhalation is an established delivery strategy, the relationship between drug physicochemical properties and drug absorption kinetics in the lung has not been extensively investigated. In fact, most of the attention in terms of optimizing drug delivery to the lung has focused on engineering of aerosol particles and of devices to deliver these particles deep into the lower airways to take advantage of the large absorptive surface area of the alveolar region for systemic drug delivery (12, 13). Yet, investigation of the absorption kinetics in the lung tissues in relation to the drugs’ molecular properties is also critical to the design of locally-acting medications for treating lung disease. Although oral drug absorption is an important area of pharmaceutical research (14–16), comparatively little attention has been devoted to the question of how to optimize local drug absorption and retention in the lung.
There are various models applicable to investigate inhaled drug absorption and retention, ranging from in vitro permeability screening experiments in cell culture to ex vivo and in vivo pharmacokinetic analyses in animals or human. Schanker and coworkers studied the absorption profile of a series of compounds delivered to the lung of anesthetized rats, in which the disappearance rate of compounds in the rat lung was assessed (17–19). Effros and coworkers investigated the transport and composition of fluid and electrolytes in the lung using the exhaled breath condensate (EBC) approach (20, 21). In addition, Tronde and coworkers performed a serial of in vitro, in vivo and ex vivo investigations of the absorption profile of drugs from the lung to the systemic circulation and related it to the physicochemical descriptors empirically (22–25). However, these cellular, tissue or in vivo models are labor-intensive and technique demanding, hence they are not readily applicable to screening large numbers of compounds at early stage. Many computational models are available for the prediction of cell permeability and oral absorption (14, 15, 26), but they are not necessarily applicable to inhaled drugs due to the difference in the anatomy and physiology between the lung and GI tract and the complexity of lung delivery. In addition, construction of an in silico statistical prediction model requires a large amount of experimental data, which is not readily available for inhaled medications.
Recently, an in silico cell based pharmacokinetic model (1CellPK) has been successfully applied to the prediction of the permeability of monobasic drugs across cell monolayers (27, 28). In 1CellPK, the transcellular passive diffusion of small molecules is described by a set of coupled mass balanced differential equation based on a compartmental model of a cell with three subcellular compartments. Most importantly, 1CellPK not only allowed calculation of the rate of transcellular mass transport, but also the mass of intracellular drug, in the presence of a transcellular concentration gradient. Here, we used 1CellPK as the basis for constructing a cell-based, multiscale, mechanistic drug transport model to analyze drug absorption kinetics and retention in the cells and tissues of rat lung.
METHODS
Overall Modeling Strategy
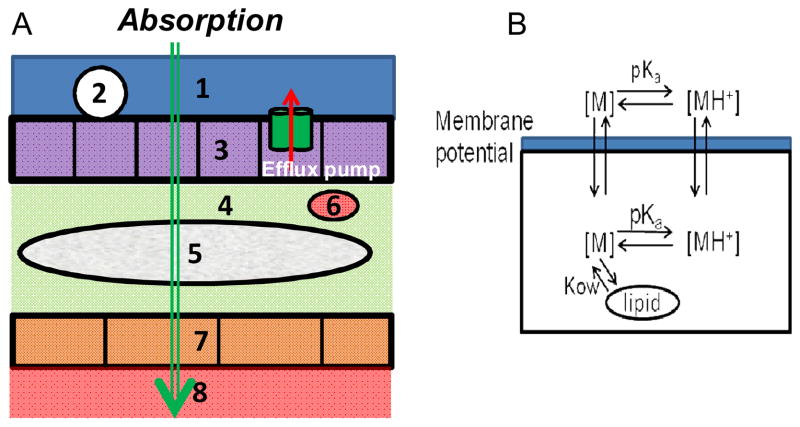
As proposed in this study, each compartment in the lung model represents a cell type delimited by a phospholipid bilayer (Figure 1A, B). For simulation, the passage of small molecules across the air-blood barrier is captured by a set of differential equations that describe mass transport across a series of cellular compartments bounded by lipid bilayers (Supporting Information, eq 1). Since the primary force driving drug transport is the concentration gradient of drug molecules between adjacent compartments, the Nernst-Plank and Fick equations can be used to describe the rate of mass transport of charged and neutral species of a molecule across each of the lipid bilayers. In turn, the time course change of compound concentration in each compartment can be obtained by numerically solving the differential equation system, according to the known physiological and histological structure of the rat lung (Table I). For a monoprotic weak acid or weak base, the concentration of molecule in each subcellular compartment is divided into two components: neutral and ionized. Accordingly, three physicochemical properties are used as input to calculate the rate of mass transport across each lipid bilayer: the logarithms of the lipid:water partition coefficient of the neutral and ionized form of the molecule, and the pKa of the molecule. Different compartments have different pHs and lipid fractions, so the free active fraction of neutral form and ionized form of molecules is calculated according to the molecule’s pKa, logPn, logPd. Based on values previously used as input parameters for a generic epithelial cell (27, 28), we estimated the electrical potential and permeability of each lipid bilayer (Figure 1B) and the pHs of the subcellular compartments.
Figure 1.
A. Diagram representing the general route of drug transport from the airways to the blood, across the histological architecture of lung tissue. 1: Surface lining (liquid) layer (Drug donor compartment); 2: Macrophage (in alveolar region only) 3: Airway epithelial cells 4: Extracellular fluid (interstitium) 5: Smooth muscle (in airways only) 6. Immune cells 7: Endothelium cells 8: Systemic circulation (Drug receiver compartment). B. Diagram representing the path of a monobasic compound across adjacent compartments separated by a phospholipid bilayer, as captured by the model. The neutral form of the molecule is indicated as [M], and the protonated, cationic form of the molecule is indicated as [MH+].
Table I.
Parameters for the tracheaobronchial airways and alveolar region in the rata
| Tracheaobronchial Airways | Alveolar Region | |||||
|---|---|---|---|---|---|---|
| Compartments | Average thickness (μm) | Surface area (cm2) | Volume (cm3) | Average thickness (μm) | Surface area (cm2) | Volume (cm3) |
| Surface lining liquid | 15b | 108 | 0.162 | 5 | 3870 | 1.935 |
| Macrophage | - | - | - | - | 42 | 0.0282 |
| Epithelium | 24-9c | 108 | 0.072d | 0.384 | 3870 | 0.148 |
| Interstitium | 1d | 108 | 0.0108d | 0.693 | 3870 | 0.268 |
| Immune cells | - | 1.08d | 0.000108d | - | 4.2d | 0.00282d |
| Smooth muscle | 19.3-4.3e | 216d | 0.047d | - | - | - |
| Endothelium | 0.4f | 21.6d | 0.000864d | 0.358 | 4520 | 0.162 |
Modeling of Passive Diffusion Across Lipid Bilayers
According to the Fick’s First law, the net flux of passive diffusion of neutral form of molecules is:
| (1) |
Pn is the permeability of the neutral form of molecules across membranes, an is the activity of the molecules, subscripts o and i indicate the direction of flux J is from outside (positive) to inside (negative), n indicates the neutral form of molecules.
For electrolytes the driving force of passive diffusion are not only chemical potential but also electrical potential, which is described by the Nernst-Plank equation (eq2).
| (2) |
| (3) |
Subscript d is for ionized/dissociated form of molecules. Pd is the permeability of the ionized form of molecules across biomembranes. ad is the activity of the ionized form of molecules. In eq3, z is the electronic charge, E is the membrane potential, F is the Faraday constant, R is the universal gas constant, T is the absolute temperature. To calculate the overall net fluxes (Jo,i) for a compound across the membrane, the net fluxes of the neutral (Jo,i,n) and ionized (Jo,i,d) are summed as:
| (4) |
Based on Henderson-Hasselbalch equation, eq 5 is derived to describe the relation between the activity of neutral form (an) and ionized form (ad) of molecules in each compartment.
| (5) |
Therefore, the fraction of the activities (an and ad) in the total concentrations (Ct) of molecules can be described by eq 6 and eq 7.
| (6) |
| (7) |
| (8) |
fn/d is the fraction of free active neutral or ionized form in the total molecular concentration. W is the volumetric water fraction in each compartment, γ is the activity coefficient in each compartment. The activity coefficient of all neutral molecules (γn) is calculated based on the ionic strength I (moles). Using the Setchenov equation, γn is 1.23 at I = 0.3 mol. The activity of ions (γd) is estimated as 0.74 at I = 0.3 with the Davies approximation of the modified Debye-Hückel equation (29). For noncellular compartments no corrections for the ionic strength are made (γn/d = 1). Kn/d is the sorption coefficient of the neutral or ionized form of molecules, which are estimated by eq 8. L is the lipid fraction in each compartment, Kow,n/d is the liposomal partition coefficient described by eq 9.
| (9) |
Empirical equations 10–13 is used to calculate the liposomal partition coefficient (logPn/d,lip) for neutral and ionized form of bases and acids (30).
| (10) |
| (11) |
| (12) |
| (13) |
Eq 14 was used to estimate the partition coefficients (logPd) of ionized form of the molecules from logPn.
| (14) |
The membrane permeability Pn and Pd were estimated by eq 15 (30).
| (15) |
D is the diffusion coefficient, which is estimated as 10−14 m2/s for organic molecules in lipids. K is the partition coefficient and approximates the liposomal partition coefficient Kow,n/d, Δ x is the membrane thickness (approximately 50 nm for a phospholipid bilayer).
The expanded coupled ordinary differential equations (ODEs) can be derived based on the forementioned equations (Suporting information, eq 2). Each equation describes the rate of concentration change for a corresponding compartment. The time course of concentration change for each compartment was obtained by numerically solving the differential equation system using Matlab® (Version R2007b, The Mathworks Inc, Natick, MA). The ODE15S solver was used to address the issue of the stiffness in the differential equations system, and the relative and absolute error tolerance was set as 10−12 to achieve good accuracy for the numercial solutions.
Parameters of the Compartmental Model
Lung tissue varies in histological and anatomical properties from the trachea, to the bronchi, to the lower airways, and all the way down to the alveolar region, as a function of the branching generation. For the sake of simplicity, the lung was divided into two components: (1) the upper airways encompassing trachea and bronchi, with its blood supply provided by the bronchial circulation; and, (2) the lung parenchyma mainly composed of alveoli, with its blood supply provided by the pulmonary circulation. Several cell types are present in the upper airways epithelium, including basal cells, goblet cells, ciliated cells, brush cells, and mast cells etc. Also for the sake of simplicity, three major cell types were considered; (1) apical epithelial cells; (2) endothelial cells; and (3) interstitial cells including smooth muscle and immune cells. In the alveolar region of the lung, the major cell types are epithelial, endothelial and macrophages. Unlike in the trachea-bronchial airways, there is no substantial smooth muscle or other interstitial cells in the alveolar region.
Most of the histological parameters (cell thickness, surface area) of the airways and the alveolar region were obtained from the scientific literature (Table I) (31–36). The volume of each cell layer in each branching generation was estimated as the product of surface area and cell thickness. The parameters of the immune cells in the interstitium were estimated based on 10 percent of interstitial cells being macrophages. Nevertheless, the cell thickness and surface area of epithelium and smooth muscle in tracheaobronchial airways varies, as reported in the literature (31, 34, 36). We adopted the Yeh model to estimate the thickness, surface area of epithelium and smooth muscle cells in airways (37). Yeh model describes a “typical” pathway from trachea to terminal bronchioles with 16 generations of branches, in which the number of airways, diameter, and length at each generation is pre-established. Airways at each generation are considered as cylindrical tubes, so that the total surface area of basement membrane beneath the epithelium at each generation of airways can be calculated based on the respective diameter, length, and the number of airways at each generation. Assuming that the epithelium and smooth muscle form around the airway as cylinder tubes with same perimeter as the basement membrane, and that their cell thickness decreases by 1 μm with each generation beginning with the trachea, one can estimate the volume of epithelium and smooth muscle for each branching generation of airways. The volume and surface area of cells at each generation is then added up as geometric parameters describing the corresponding compartment (Supporting Information, Table I). The average interstitial thickness in airway (excluding the interstitial cells) was estimated to be 1 μm and the surface area and volume of immune cells was estimated as 1 percent of interstitium (38, 39). The surface area of endothelium was estimated as one fifth of the airway surface area (40). The lipid fraction for surface lining liquid in airway and alveoli is estimated to be 0.2 and 0.95, respectively (41, 42). The physiological parameters for an epithelial cell were extracted from literature (27). The membrane potential for other cell types was set as −60 mv. To perform sensitivity analysis, each parameter in the model was randomly sampled 1000 times from a uniform distributed variable within 1/100 and 100 times of the default value or a realistic span based on prior knowledge. All default parameter values and the sensitivity analysis are given in the Supporting information, Table II, III and IV. The logP and pKa of propranolol were used as input parameters to evaluate the robustness of the model.
Simulations of the Transcellular Absorption of Small Molecules in Tracheaobronchial Airways and Alveolar Region
For simulation, a standard initial dose of 50 nmol was delivered to the surface liquid (drug donor compartment) based on drug absorption experiments in rats (23, 24). For simulation, the pKa (5 to 14 with interval of 0.2 units) and logP (−2 to 4 with interval of 0.1 units, corresponding to logPn) of mono-basic compounds were varied independently and used as input. For each logP and pKa combination, the time course change of amount of compounds in each compartment in airways or alveolar region was obtained by numerically solving the coupled differential equations at a predetermined time point, and then multiplying the calculated local concentrations by the volume of the corresponding compartment. For each time point, the amount of compound in each cellular compartment (macrophage, epithelium, smooth muscle, etc) was summed up as the total amount of compound in lung tissue. The absorption rate constant (Ka, min−1) was defined as follows:
| (16) |
The absorption half life (absT50, minutes) refers to the time when a half of dosage appears in the drug receiver compartment (the plasma). Pmax refers to the maximal percentage of amount of compounds retained by the lung tissue as well as other cell types during the absorption process, and Tmax, lung is the time when the peak of amount of compounds in the lung tissue is reached.
Simulations of the Transcellular Absorption of Small Molecules in Whole Rat Lung
For simulating drug absorption in whole rat lung, the regional distribution of dose in the rat lung was used as input parameter, to mimic the drug deposition pattern achieved by aerosol devices. Based on published experimental findings, simulation was performed using 50 nmol as total dose with regional distribution of 70% total dosage deposited in the tracheaobronchial airways and 30% deposited in alveoli (23, 24). After solving the differential equations system for airways and alveoli separately, we generalized all compartments in airways and alveoli area as three compartments, including drug donor compartment (the surface liquid), lung tissue (the sum of all cellular compartments in airway and alveolar region), and drug receiver compartment (the plasma). The absT50 is defined as the time when a half of the total dose (25 nmol) enters the generalized drug receiver compartment.
Simulations of Efflux Transporters and Organelle Sequestration
Efflux transporters were included at the apical membrane of epithelial cells in both airway and alveolar region. The Michaelis-Menten equation was used to describe this saturable drug efflux component. The Km value (432 μM) used for modeling was extracted from the in vitro measurement of talinolol as substrate of P-glycoprotein (P-gp) (43–45). Lacking quantitative information of kinetic parameters of P-gp or other transporters in rat lung, we performed simulations by gradually increasing the Vmax,area from 1×10⁻¹⁵ mol/sec/cm2 (the Vmax of the P-gp inhibitor verapamil in normal Caco-2 cell line) up to 1×10⁻⁶ mol/sec/cm2, thereby making the simulation conditions cover a physiologically-relevant range of values based on experiments in other systems (46). In the simulation, the density of transporters was considered as a constant throughout the lung epithelium. Due to the squamous character of alveolar epithelium, the Vmax,area was divided by 50 to get the normalized Vmax,area for alveolar region (because the average surface area of alveolar and intestinal epithelium is 5000 μm2 (31), and 100 μm2, respectively). We assumed Vmax,area for airway is the same as the Vmax,area in cell lines. The Vmax (unit: mol/sec) for airways and alveoli was computed by multiplying the corresponding surface area of apical membrane of epithelial cells with the Vmax,area.
Two organelle compartments (mitochondria and lysosome) were incorporated in the epithelial cell types at the airway and alveolar region. The volume (m3) of mitochondria and lysosome were estimated as 5% each of corresponding cytoplasm of epithelial cells. The surface area (m2) of mitochondria and lysosome were calculated by multiplying 5.99×10⁶ with their corresponding volume. Membrane potential for mitochondria and lysosome was set as −160 mv and +10 mv, respectively (27, 28). pH in mitochondria and lysosome was set as 8 and 5, respectively.
RESULTS
Absorption and Retention of Small Molecules in Tracheaobronchial Airways
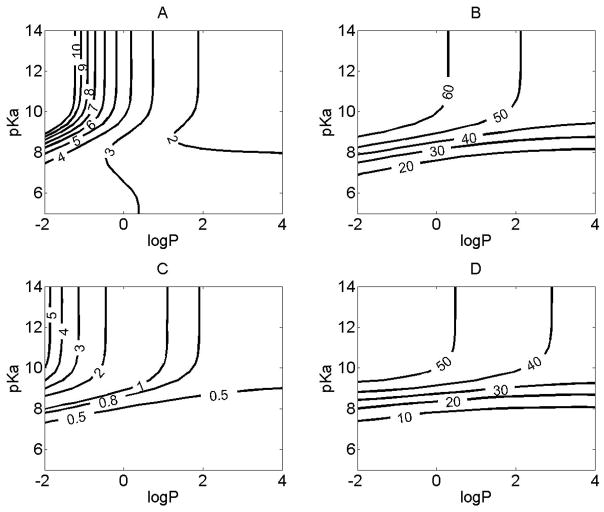
Combinations of logP (corresponding to logPn, ranging from −2 to 4) and pKa (ranging from 5 to 14) were used as input to calculate absT50, Tmax, and Pmax (Figure 2). In airways, compounds with higher lipophilicity were absorbed more rapidly, but this trend was less pronounced when logP>1 (Figure 2A). The absorption rate of compounds with basic pKa<7.5 was fastest and less influenced by lipophilicity and pKa. For hydrophilic compounds with logP < 0 and 7.5<pKa<9, the abs T50 was most sensitive to the change of pKa and logP. Over this range, a one unit change in pKa or logP increased or decreased absT50 by 3 minutes. For compounds with pKa>9, the pKa had little effect on abs T50, and only logP affected the abs T50 in this range.
Figure 2.
The relationship between the physicochemical properties and the absorption or tissue retention in the airways. For simulations, the initial dose was set to 50 nmol, and the logP (corresponding to logPn) and pKa were varied independently. X axis represents the logP, Y axis represents pKa. Contour line indicates: A. The absT50 (unit: minutes) of molecules in airway; B. The maximal amount of compounds (%) retained by airway tissue during the absorption process. C. The time (minutes) when the maximal percentage of the total amount of compounds was reached in airway tissue. D. The maximal amount of compounds (%) retained by smooth muscle during the absorption process.
The rate limiting step for the transport across the airway epithelium was the diffusion across the apical membrane (Supporting information, Figure 3). The amount of drug retained by airway tissue ranged from 20 to 60 % of total dosage during the absorption process (Figure 2B). For molecules with pKa greater than 9, the maximal percentage of compounds retained by the lung tissue during the absorption process was 40 to 60% (Figure 2B) and tmax,lung of 0.8 to 5 minutes (Figure 2C), which could provide a sufficient exposure and fast onset of action for compounds acting locally. Smooth muscle retained up to 50% of the total dose administered to the airway (Figure 2D). Molecules with lower logP and higher pKa had a greater tendency to be distributed into the airway tissues, with airway tissue retention being most sensitive to changes of drug physiochemical properties when 7 < pKa < 9 (Figure 2C, 2D).
For compounds with high pKa and low logP, the efflux rate from the airway tissue to the plasma was slower than the rate of absorption from the surface layer into the airway, explaining their high tissue accumulation. Lower logP and higher pKa slowed down the plasma efflux rate of compounds from the airway more than it slowed the influx rate into the airway tissue, which in turn led to more drug retention and exposure in the airway tissue. Thus, for optimizing locally acting drugs targeting the upper airway, a strategy for prolonging the therapeutic effect can exploit the factors determining the compound’s leaving kinetics from lung tissue (e.g. smooth muscle retention, organelle sequestration, and protein binding), and not just solubility, dissolution, and permeability properties affecting absorption into the lung tissue.
Absorption and Retention of Small Molecules in Alveolar Region
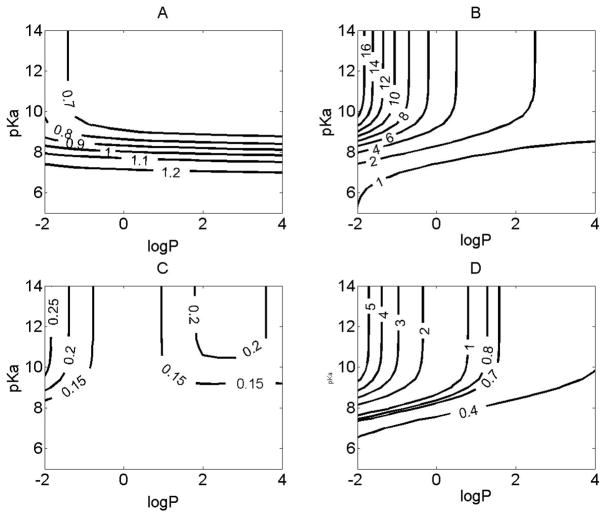
The absorption rate in the alveolar region was very fast: even the longest absT50 of monobasic compounds in alveolar region was less than one and half minutes (Figure 3A). The rate limiting step for the transport across the alveolar epithelium was the diffusion across the apical membrane (Supporting information, Figure 3). For monobasic compounds, only those with pKa < 7.5 possessed absT50 > one minute. The physicochemical properties of compounds had a minor effect on the absorption in the alveolar region, over the range tested. The maximal percentage of compounds retained in alveolar tissue ranged from 1 to 16% of total dose. The major cell type of tissue retention was the epithelium with maximal 5% accumulation (Figure 3B, D). More importantly, tmax in alveolar tissue was less than 0.3 minutes (Figure 3C), with the influx and efflux rate of monobasic small molecules into and out of the alveolar tissue being very fast.
Figure 3.
The relationship between the physicochemical properties and the absorption or tissue retention in the alveolar region. For simulations, the initial dose was set to 50 nmol, and logP (corresponding to logPn) and pKa were varied independently. X axis represents the logP. Y axis represents pKa. Contour line indicates: A. The absT50 (unit: minutes) of molecules in alveolar region; B. The maximal amount of compounds (%) retained by alveolar tissue during the absorption process. C. The time (minutes) when the maximal percentage of amount of compounds was reached in alveolar tissue. D. The amount of compound (%) retained by alveolar epithelium during the absorption process.
Absorption in the Lung as a Function of Regional Deposition Pattern
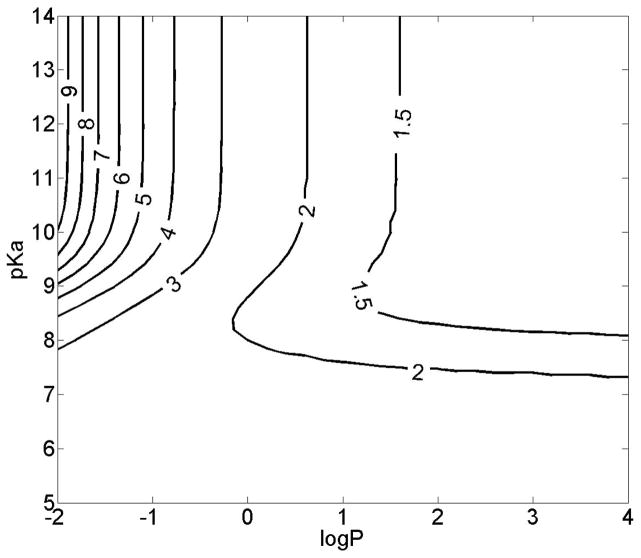
Regional drug deposition patterns can affect absorption and bioavailability in the lung (17, 19, 47). To mimic the deposition pattern of in vivo and ex vivo drug inhalation experiments (22–24) simulation was performed to calculate the absT50 for the whole lung under the condition that 70% of the starting dose was deposited in the airway and 30% dosage was deposited in the alveolar region.. The absT50 for the whole lung ranged from 1 to 9 minutes depending on the physicochemical properties of the drug (Figure 4). The general trend of how absT50 changed in the whole lung was similar to the trend observed in the airways.
Figure 4.
The relationship between the physicochemical properties and the absorption in the whole lung with a dosage deposition of 70% in airways and 30% in alveolar region. For simulations, the initial dose was set to 50 nmol, and logP (corresponding to logPn) and pKa were varied independently. X axis represents the logP. Y axis represents the pKa. Contour line indicates the absT50 (minutes) of molecules in whole lung.
Model Validation and Parameter Sensitivity Analysis
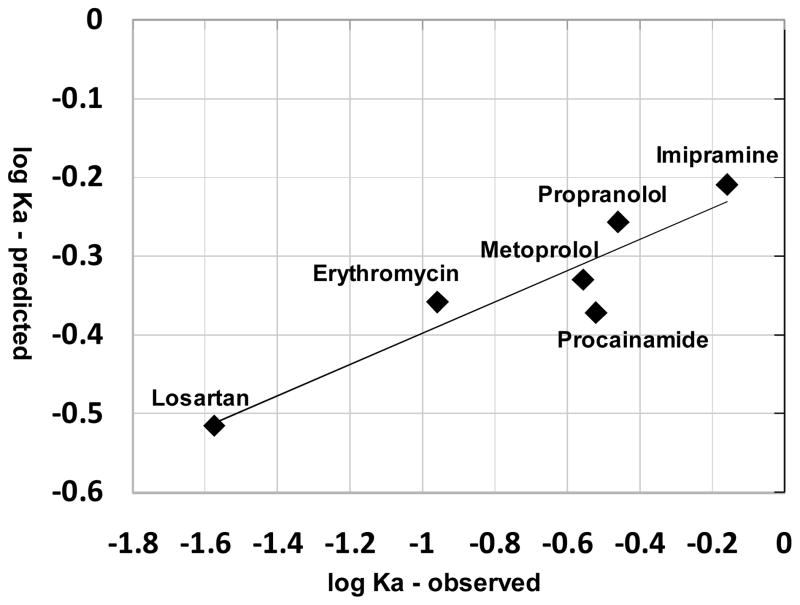
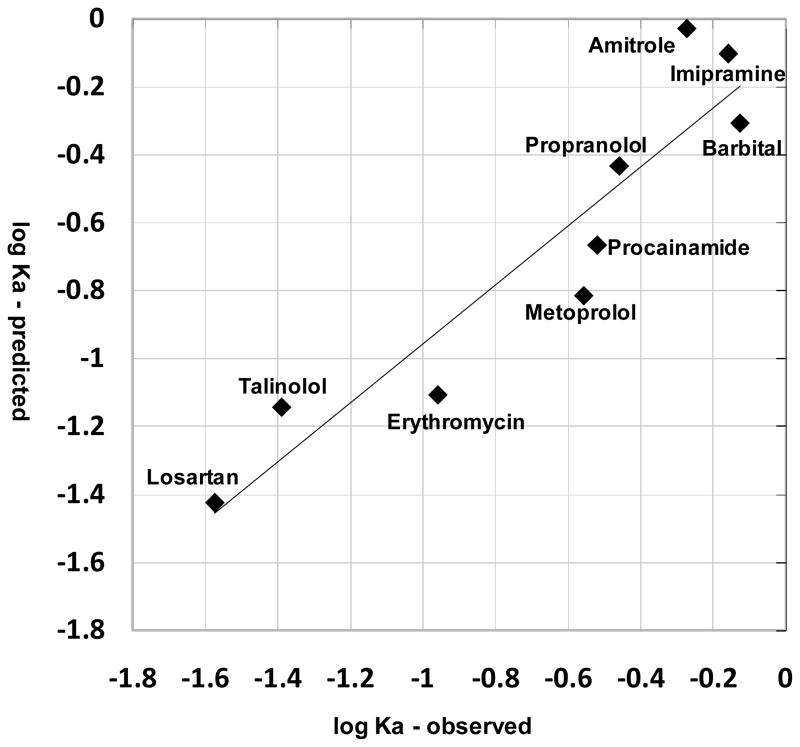
Based on published measurements (17–19, 22–23), nine compounds with single ionized species under physiological pH conditions were used to test the model (table II). These compounds included monovalent weak bases and acids with diverse structures and very different physicochemical properties (table II). The predicted absT50 for all these compounds in alveolar region was less than 1.5 minutes (table II). If the radius of the compounds was not taken into account, simulation results using logP and pKa alone as inputs yielded poor predictions of relative absorption half-life compared to the experimental data (R2 less than 0.1, data not shown). Nevertheless, for compounds with moderate Petitjean radius from 5 to 8, the experimental and predicted Ka were significantly correlated (R2 = 0.86, P = 0.004 (one tail)) (Figure 5). By incorporating size as a factor in the predictions, the predicted Ka for all nine compounds yielded a good correlation (R2 = 0.87, P = 0.0001 (one tail)) with the measured Ka values (Figure 6).
Table II.
Structures, physicochemical properties, observed absT50, Ka, and predicted absorption profile of nine monocharged moleculesa
| Drug name | Structure | pKa | logP | Petitjean radius | abs T50 observed (min) | Ka observed (min−1) | abs T50 (min) | Ka (min−1) | abs T50 in airway (min) | abs T50 in alveolar (min) |
|---|---|---|---|---|---|---|---|---|---|---|
| Predicted | ||||||||||
| Imipramine |  |
9.2 | 4.01 | 5 | 1 | 0.69 | 1.12 | 0.62 | 1.41 | 0.62 |
| Talinolol | 9.76 | 2.46 | 9 | 17 | 0.041 | 1.26 | 0.55 | 1.69 | 0.59 | |
| Losartan |  |
8.15b | 4.18 | 8 | 26 | 0.027 | 2.27 | 0.30 | 2.97 | 1.27 |
| Metoprolol |  |
9.67 | 1.49 | 7 | 2.5 | 0.28 | 1.48 | 0.47 | 2.10 | 0.60 |
| Propranolol |  |
9.67 | 2.5 | 6 | 2 | 0.35 | 1.25 | 0.55 | 1.66 | 0.59 |
| Barbital |  |
7.58b | 0.74 | 3 | 0.93 | 0.75 | 2.42 | 0.29 | 3.20 | 1.32 |
| Amitrole |  |
8.59b | 0.31 | 2 | 1.3 | 0.53 | 2.30 | 0.30 | 3.03 | 1.26 |
| Procainamide | 9.04 | 0.83 | 6 | 2.3 | 0.30 | 1.63 | 0.42 | 2.31 | 0.68 | |
| Erythromycin | 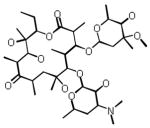 |
8.38 | 1.22 | 8 | 6.3 | 0.11 | 1.58 | 0.44 | 2.05 | 0.85 |
Figure 5.
Observed Ka and predicted Ka are related, for small drug-like molecules of intermediate size range (Petitjean radius 5 to 8). Regression equation: logKa (predicted) = 0.198 logKa (observed) – 0.199; R2=0.86.
Figure 6.
The correlation between the observed and predicted logKa, obtained by partial least square (PLS) regression using the predicted logKa and Petitjean radius as variables. The regression relationship was described by the following equation: logKa (observed) = 1.48 – 0.23 radius + 2.01 logKa (predicted); R2=0.87.
Because of variation and uncertainty in the parameters used in the model, we analyzed the sensitivity of the predicted absT50 in the lung to variations of all the input parameters values (Supporting information, Table III, IV). The prediction of the absorption half-life of applicable compounds had a maximal deviation of 0.38 minutes in the lung (Supporting Information, table III, IV). Although the relative deviation from the corresponding predicted value was about 30% in the lung, the absT50 and Ka calculated with the simulations were within range of the experimentally measured values.
Additional Factors Affecting the Absorption Kinetics of Small Molecules in the Lung
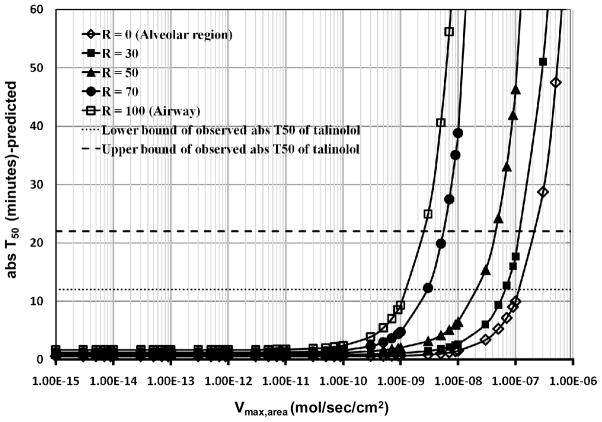
We assessed the theoretical effect of P-gp on the apical epithelial cell membrane on the lung pharmacokinetics of talinolol. The Km (423 μM) of talinolol served as input, with Vmax,area (mol/sec/cm2) ranging from 1×10⁻¹⁵ mol/sec/cm2 (the Vmax,area of P-gp inhibitor verapamil in Caco-2 cells (46)) to a value that was nine orders of magnitude higher, scanning a physiologically realistic range of Vmax,area. The transporter effect was most significant when the initial dose was deposited only in the airways (R = 100%; Figure 7). In the alveolar region, the transporter effect was reduced. Based on simulation results the absT50 of talinolol fell into the observed range of 12–22 minutes (Figure 7) if 70% of 50 nmol dose was deposited in the airways and the predicted Vmax,area for talinolol was from 2×10⁻⁹ mol/sec/cm2 to 6×10⁻⁹ mol/sec/cm2 (Figure 7).
Figure 7.
The effect of an apical airway efflux transporter with Km = 423 μM. For simulations, Vmax,area was varied from 1×10⁻¹⁵ to 1×10⁻⁶ (mol/sec/cm2). R is the percentage of total dose (50 nmol) deposited in the airways.
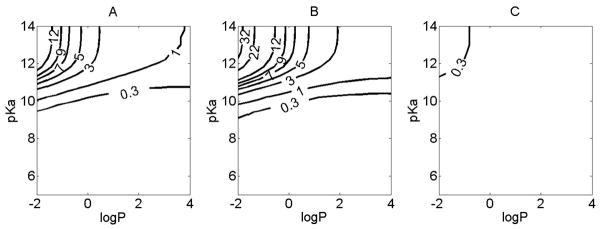
Lastly, we assessed the effect of intracellular organelles on lung pharmacokinetics. Including mitochondria and lysosomes in the simulations increased the predicted absT50 for monobasic compounds only slightly for most pKa and logP conditions (Figure 8). The most pronounced effect of organelles was observed for monobasic compounds with pKa>10 with lung absT50 increasing by a factor of 10 or more (Figure 8A). The organelle sequestration effect was quite pronounced in the airway (Figure 8B) and comparatively insignificant in the alveoli (Figure 8C).
Figure 8.
The simulated effect of organelle sequestration on lung pharmacokinetics of small molecules of varying physicochemical properties. For the simulations, the initial dose was 50 nmol. logP (corresponding to logPn) and pKa were varied independently. X axis represents the logP. Y axis represents pKa. Contour line indicates: A. the difference in the absT50 (minutes) between simulations carried out with and without organelles for the lung, with 70% of the dose in airways and 30% in alveolar region. B. the difference in the absT50 (minutes) between simulations carried out with and without organelles for the airway. C. the difference in the absT50 (minutes) between simulations carried out with and without organelles for the alveolar region.
DISCUSSION
In this study, a multiscale, cell-based compartmental model was developed to analyze the transport of cell-permeant, weakly basic or acidic, monoprotic small molecules in the lung. To predict drug absorption, the transcellular diffusion of small molecules across the phospholipid bilayer was modeled with Fick’s and Plank-Nernst’s equations. The ionization state and lipid partitioning of neutral and ionized forms of the molecules was used to compute the free aqueous fraction of concentration for both neutral and ionized form in each subcellular compartment. Based on the concentration gradient of neutral and ionized, free aqueous species, the concentration and amount at different compartments within the lung could be calculated through time, in accordance with the histological and morphological architecture of the airways and alveolar region.
For development of locally-targeted small molecule drugs, a cell-based biophysical model is able to capture how the behavior of small molecules in airways and alveolar region are different. Our results illustrate how such a model can provide quantitative insights about the relationship between the physicochemical properties and absorption and tissue retention in the upper airways vs. alveolar region. The simulations suggest that a molecule is absorbed at a slower rate in the upper airway, and has more tissue retention than in alveolar region. Organelle sequestration also has a far more significant effect on upper airway pharmacokinetics. Therefore, the upper airway appears as the preferred drug targeting site for local (inhaled) drug therapy with monoprotic weakly basic small molecules. Conversely, the alveolar region is a far more challenging site to target with locally-active inhaled, cell-permeant, monoprotic weakly basic molecules, while it would be the preferred site for facilitating their absorption into the systemic circulation.
The predicted absorption kinetics in lung are very rapid compared with that of the GI tract, and were all consistent in time scale with respect to experimentally-measured absorption kinetics in rat lungs. For model validation, the correlation between predicted and reported values for small lipophilic, monobasic or monoacid molecules within the size range of most drugs (i.e 4< Petitjean radius<9) was found to be significant (R2 = 0. 86). For molecules of larger or smaller size, the molecular radius is far more important than logP and pKa in determining absorption kinetics. Only by accounting for radius with a semi-empirical formula, the correlation between predicted and reported values for compounds that included molecules with extreme size range was significant (R2 = 0.87). As a caveat, the correlation (R2) was 0.60 (P = 0.06 (one tail)) if losartan was removed, which points to the need of acquiring more experimental data for furthering model refinement and validation.
Compared to the other organ systems, the effect of active transporters on drug absorption in the lung have not been extensively studied, although there are suggestions that bioavailability of inhaled medications is minimally affected by such transporters (24). We used talinolol as a model P-gp substrate in simulations to quantify the potential role of transporters on the absT50 using the in vitro kinetic parameters (i.e. Vmax and Km). P-gp expression in lung cell lines and in vivo is lower than in Caco-2 cells with measured Vmax only around 2 × 10⁻¹² mol/sec/cm2 (46,48–50). Therefore, the predicted much larger Vmax values (2×10⁻⁹ to 6×10⁻⁹ mol/sec/cm2) suggests that efflux by P-gp at the apical side of lung epithelial cells cannot account for talinolol’s slower-than-expected absorption. As an alternative explanation, the absorption of talinolol could be mostly limited by its larger size and low solubility (24, 51).
By running simulations with and without mitochondria and lysosomes, the effect of organelle sequestration on small molecule retention and absorption in airways vs. alveoli was also analyzed. The results indicate that organelle sequestration slows down of absorption of monobasic small molecules in the upper airways when pKa > 10.5. This effect is largely due to the membrane potential-dependent uptake of positively-charged, protonated species in the mitochondria. The organelle sequestration effect in alveoli is minimal, due to the larger apical and basolateral membrane surface areas in relation to the mitochondrial surface area of alveolar epithelial and endothelial cells, as well as the absence of interstitial cells. For molecules with pKa < 10.5 the passive diffusion of the neutral species of the molecule does not allow for prolongued retention in mitochondria or lysosomes, with minimal effect on absT50 in both airways and alveoli.
While helping formulate quantitative hypothesis, these results illustrate how a cell-based computational model can help us interpret experimental data on the absorption and retention of small compounds in the lung in the context of the branching structure of the airways, and the cellular organization of the walls of the airways. Presently, the scope of the model is constrained to basic or acidic, monoprotic compounds which are cell permeant, of a limited size range for which the transcellular route is the primary absorption pathway. Admittedly, the uncertainty and inter-individual variability in the estimated or measured parameters for cell types are factors that can affect the accuracy of the model (31, 34). Nevertheless, the parameter sensitivity (error propagation) analysis indicates that the predictions are robust and error-tolerant within the aforementioned constraints and the range of uncertainty of the estimated model parameters.
While this cell-based, mechanistic model can be further elaborated and improved, one of its important applications may reside in its ability to help design inhaled compounds with optimal physiochemical properties at early stage of drug design, thereby improving drug targeting and delivery in the lung. It can also help make predictions about the bioaccumulation and biodistribution properties of inhaled chemical agents, for toxicity risk assessment. More importantly, because the model incorporates quantitative species-specific information about the anatomy, physiology and histology of the lung, it can be scaled to predict human lung absorption. Its potential to bridge the gap between animal species and humans may be particularly valuable when clinical lung absorption data is scarce.
To summarize, a cell-based biophysical model of drug absorption in the lungs is a computational tool that can provide mechanistic insights about a relatively unexplored site of drug targeting and delivery. As additional small molecule absorption experiments are performed, the model can be further validated, refined and elaborated, to increase its accuracy and extend its domain of applicability. Planned experiments and future development effort will aim at exploring the size dependency of transport behavior, modeling paracellular transport routes of more hydrophilic compounds and macromolecules, probing active transport effects, as well as extending the model to zwitterionic and multivalent molecules.
Supplementary Material
Acknowledgments
This work was supported by NIH Grant RO1GM078200 to G. Rosania, and by a Fred Lyons Jr. Fellowship from the College of Pharmacy at University of Michigan to J. Yu. The authors thank Newaj Abdullah for collecting lung relevant parameters.
References
- 1.Brewis RL, Corrin B, Geddes DM, Gibson GJ, editors. Respiratory Medicine. WB Saunders Company Ltd; London: 1995. [Google Scholar]
- 2.Ehrhardt C, Kim K-J, editors. Drug absorption studies: in situ, in vitro and in silico models. Springer; Arlington, VA: 2008. [Google Scholar]
- 3.Lipworth BJ. Pharmacokinetics of inhaled drugs. Br J Clin Pharmacol. 1996;42:697–705. doi: 10.1046/j.1365-2125.1996.00493.x. [DOI] [PMC free article] [PubMed] [Google Scholar]
- 4.Wall DA, Lanutti AT. High-Levels of Exopeptidase Activity Are Present in Rat and Canine Bronchoalveolar Lavage Fluid. Int J Pharm. 1993;97:171–181. [Google Scholar]
- 5.Patton JS. Mechanisms of macromolecule absorption by the lungs. Adv Drug Deliver Rev. 1996;19:3–36. [Google Scholar]
- 6.Anttila S, Hukkanen J, Hakkola J, Stjernvall T, Beaune P, Edwards RJ, Boobis AR, Pelkonen O, Raunio H. Expression and localization of CYP3A4 and CYP3A5 in human lung. Am J Resp Cell Mol. 1997;16:242–249. doi: 10.1165/ajrcmb.16.3.9070608. [DOI] [PubMed] [Google Scholar]
- 7.Niven RW. Delivery of Biotherapeutics by Inhalation Aerosol. Crit Rev Ther Drug. 1995;12:151–231. doi: 10.1615/critrevtherdrugcarriersyst.v12.i2-3.20. [DOI] [PubMed] [Google Scholar]
- 8.LiCalsi C, Christensen T, Bennett JV, Phillips E, Witham C. Dry powder inhalation as a potential delivery method for vaccines. Vaccine. 1999;17:1796–1803. doi: 10.1016/s0264-410x(98)00438-1. [DOI] [PubMed] [Google Scholar]
- 9.Russell KE, Read MS, Bellinger DA, Leitermann K, Rup BJ, McCarthy KP, Keith JC, Jr, Khor SP, Schaub RG, Nichols TC. Intratracheal administration of recombinant human factor IX (BeneFix) achieves therapeutic levels in hemophilia B dogs. Thromb Haemost. 2001;85:445–449. [PubMed] [Google Scholar]
- 10.Skyler JS, Cefalu WT, Kourides IA, Landschulz WH, Balagtas CC, Cheng SL, Gelfand RA, Grp IIPIS. Efficacy of inhaled human insulin in type 1 diabetes mellitus: a randomised proof-of-concept study. Lancet. 2001;357:331–335. doi: 10.1016/s0140-6736(00)03638-2. [DOI] [PubMed] [Google Scholar]
- 11.Patton JS, Byron PR. Inhaling medicines: delivering drugs to the body through the lungs. Nat Rev Drug Discov. 2007;6:67–74. doi: 10.1038/nrd2153. [DOI] [PubMed] [Google Scholar]
- 12.Gumbleton M, Taylor G. Challenges and innovations in effective pulmonary systemic and macromolecular drug delivery. Adv Drug Deliv Rev. 2006;58:993–995. doi: 10.1016/j.addr.2006.07.011. [DOI] [PubMed] [Google Scholar]
- 13.Shoyele SA, Cawthorne S. Particle engineering techniques for inhaled biopharmaceuticals. Adv Drug Deliv Rev. 2006;58:1009–1029. doi: 10.1016/j.addr.2006.07.010. [DOI] [PubMed] [Google Scholar]
- 14.Yu LX, Lipka E, Crison JR, Amidon GL. Transport approaches to the biopharmaceutical design of oral drug delivery systems: Prediction of intestinal absorption. Adv Drug Deliver Rev. 1996;19:359–376. doi: 10.1016/0169-409x(96)00009-9. [DOI] [PubMed] [Google Scholar]
- 15.Egan WJ, Lauri G. Prediction of intestinal permeability. Adv Drug Deliver Rev. 2002;54:273–289. doi: 10.1016/s0169-409x(02)00004-2. [DOI] [PubMed] [Google Scholar]
- 16.Norinder U, Haeberlein M. Computational approaches to the prediction of the blood-brain distribution. Adv Drug Deliver Rev. 2002;54:291–313. doi: 10.1016/s0169-409x(02)00005-4. [DOI] [PubMed] [Google Scholar]
- 17.Brown RA, Schanker LS. Absorption of Aerosolized Drugs from the Rat Lung. Drug Metab Dispos. 1983;11:355–360. [PubMed] [Google Scholar]
- 18.Schanker LS, Hemberger JA. Relation between Molecular-Weight and Pulmonary Absorption Rate of Lipid-Insoluble Compounds in Neonatal and Adult-Rats. Biochem Pharmacol. 1983;32:2599–2601. doi: 10.1016/0006-2952(83)90025-4. [DOI] [PubMed] [Google Scholar]
- 19.Schanker LS, Mitchell EW, Brown RA. Species Comparison of Drug Absorption from the Lung after Aerosol Inhalation or Intratracheal Injection. Drug Metab Dispos. 1986;14:79–88. [PubMed] [Google Scholar]
- 20.Effros RM, Pornsuriyasak P, Porszasz J, Casaburi R. Indicator dilution measurements of extravascular lung water: basic assumptions and observations. Am J Physiol Lung Cell Mol Physiol. 2008;294:L1023–1031. doi: 10.1152/ajplung.00533.2007. [DOI] [PubMed] [Google Scholar]
- 21.Effros RM. Exhaled breath condensates and COPD. Eur Respir J. 2009;33:1238. doi: 10.1183/09031936.00191608. [DOI] [PubMed] [Google Scholar]
- 22.Tronde A. Faculty of Pharmacy, Vol. PhD. Uppsala University; 2002. Pulmonary drug absorption: in vitro and in vivo investigations of drug absorption across the lung barrier and its relation to drug physicochemical properties. [Google Scholar]
- 23.Tronde A, Norden B, Jeppsson AB, Brunmark P, Nilsson E, Lennernas H, Bengtsson UH. Drug absorption from the isolated perfused rat lung--correlations with drug physicochemical properties and epithelial permeability. J Drug Target. 2003;11:61–74. doi: 10.1080/1061186031000086117. [DOI] [PubMed] [Google Scholar]
- 24.Tronde A, Norden B, Marchner H, Wendel AK, Lennernas H, Bengtsson UH. Pulmonary absorption rate and bioavailability of drugs in vivo in rats: structure-absorption relationships and physicochemical profiling of inhaled drugs. J Pharm Sci. 2003;92:1216–1233. doi: 10.1002/jps.10386. [DOI] [PubMed] [Google Scholar]
- 25.Manford F, Tronde A, Jeppsson AB, Patel N, Johansson F, Forbes B. Drug permeability in 16HBE14o-airway cell layers correlates with absorption from the isolated perfused rat lung. European Journal of Pharmaceutical Sciences. 2005;26:414–420. doi: 10.1016/j.ejps.2005.07.010. [DOI] [PubMed] [Google Scholar]
- 26.Oprea TI. Chemical space navigation in lead discovery. Curr Opin Chem Biol. 2002;6:384–389. doi: 10.1016/s1367-5931(02)00329-0. [DOI] [PubMed] [Google Scholar]
- 27.Zhang X, Shedden K, Rosania GR. A cell-based molecular transport simulator for pharmacokinetic prediction and cheminformatic exploration. Mol Pharmaceut. 2006;3:704–716. doi: 10.1021/mp060046k. [DOI] [PMC free article] [PubMed] [Google Scholar]
- 28.Zhang X, Zheng N, Rosania GR. Simulation-based cheminformatic analysis of organelle-targeted molecules: lysosomotropic monobasic amines. J Comput Aided Mol Des. 2008;22:629–645. doi: 10.1007/s10822-008-9194-7. [DOI] [PMC free article] [PubMed] [Google Scholar]
- 29.Trapp S, Horobin RW. A predictive model for the selective accumulation of chemicals in tumor cells. Eur Biophys J. 2005;34:959–966. doi: 10.1007/s00249-005-0472-1. [DOI] [PubMed] [Google Scholar]
- 30.Balon K, Riebesehl BU, Muller BW. Drug liposome partitioning as a tool for the prediction of human passive intestinal absorption. Pharm Res. 1999;16:882–888. doi: 10.1023/a:1018882221008. [DOI] [PubMed] [Google Scholar]
- 31.Parent RA, editor. Treatise on Pulmonary Toxicology: Comparative biology of the normal lung. CRC Press; Boca Raton: 1992. [Google Scholar]
- 32.Widdicombe JG. Airway liquid: a barrier to drug diffusion? Eur Respir J. 1997;10:2194–2197. doi: 10.1183/09031936.97.10102194. [DOI] [PubMed] [Google Scholar]
- 33.Salmon M, Walsh DA, Huang TJ, Barnes PJ, Leonard TB, Hay DW, Chung KF. Involvement of cysteinyl leukotrienes in airway smooth muscle cell DNA synthesis after repeated allergen exposure in sensitized Brown Norway rats. Br J Pharmacol. 1999;127:1151–1158. doi: 10.1038/sj.bjp.0702669. [DOI] [PMC free article] [PubMed] [Google Scholar]
- 34.Cohen MD, Zelikoff JT, Schlesinger RB, editors. Pulmonary Immunotoxicology. Springer; 2000. [Google Scholar]
- 35.Crane GJ, Kotecha N, Luff SE, Neil TO. Electrical coupling between smooth muscle and endothelium in arterioles of the guinea-pig small intestine. Phys Med Biol. 2001;46:2421–2434. doi: 10.1088/0031-9155/46/9/311. [DOI] [PubMed] [Google Scholar]
- 36.James AL, Bai TR, Mauad T, Abramson MJ, Dolhnikoff M, McKay KO, Maxwell PS, Elliot JG, Green FH. Airway smooth muscle thickness in asthma is related to severity but not duration of asthma. Eur Respir J. 2009;34(5):1040–45. doi: 10.1183/09031936.00181608. [DOI] [PubMed] [Google Scholar]
- 37.Yeh HC, Schum GM, Duggan MT. Anatomic models of the tracheobronchial and pulmonary regions of the rat. Anat Rec. 1979;195:483–492. doi: 10.1002/ar.1091950308. [DOI] [PubMed] [Google Scholar]
- 38.Miller LA, Hurst SD, Coffman RL, Tyler NK, Stovall MY, Chou DL, Putney LF, Gershwin LJ, Schelegle ES, Plopper CG, Hyde DM. Airway generation-specific differences in the spatial distribution of immune cells and cytokines in allergen-challenged rhesus monkeys. Clin Exp Allergy. 2005;35:894–906. doi: 10.1111/j.1365-2222.2005.02271.x. [DOI] [PMC free article] [PubMed] [Google Scholar]
- 39.Ross MH, Pawlina W, editors. Histology: A Text and Atlas: With Correlated Cell and Molecular Biology. Lippincott Williams & Wilkins; Baltimore: 2006. [Google Scholar]
- 40.Kroll F, Karlsson JA, Persson CG. Tracheobronchial microvessels perfused via the pulmonary artery in guinea-pig isolated lungs. Acta Physiol Scand. 1987;129:445–446. doi: 10.1111/j.1365-201x.1987.tb10614.x. [DOI] [PubMed] [Google Scholar]
- 41.Sims DE, Horne MM. Heterogeneity of the composition and thickness of tracheal mucus in rats. Am J Physiol. 1997;273:L1036–1041. doi: 10.1152/ajplung.1997.273.5.L1036. [DOI] [PubMed] [Google Scholar]
- 42.Veldhuizen R, Nag K, Orgeig S, Possmayer F. The role of lipids in pulmonary surfactant. Biochim Biophys Acta. 1998;1408:90–108. doi: 10.1016/s0925-4439(98)00061-1. [DOI] [PubMed] [Google Scholar]
- 43.Doppenschmitt S, Spahn-Langguth H, Regardh CG, Langguth P. Role of P-glycoprotein-mediated secretion in absorptive drug permeability: An approach using passive membrane permeability and affinity to P-glycoprotein. J Pharm Sci. 1999;88:1067–1072. doi: 10.1021/js980378j. [DOI] [PubMed] [Google Scholar]
- 44.Troutman MD, Thakker DR. Efflux ratio cannot assess P-glycoprotein-mediated attenuation of absorptive transport: asymmetric effect of P-glycoprotein on absorptive and secretory transport across Caco-2 cell monolayers. Pharm Res. 2003;20:1200–1209. doi: 10.1023/a:1025049014674. [DOI] [PubMed] [Google Scholar]
- 45.Tubic M, Wagner D, Spahn-Langguth H, Bolger MB, Langguth P. In silico modeling of non-linear drug absorption for the P-gp substrate talinolol and of consequences for the resulting pharmacodynamic effect. Pharm Res. 2006;23:1712–1720. doi: 10.1007/s11095-006-9020-7. [DOI] [PubMed] [Google Scholar]
- 46.Shirasaka Y, Sakane T, Yamashita S. Effect of P-glycoprotein expression levels on the concentration-dependent permeability of drugs to the cell membrane. J Pharm Sci. 2008;97:553–565. doi: 10.1002/jps.21114. [DOI] [PubMed] [Google Scholar]
- 47.French MC, Wishart GN. Isolated Perfused Rabbit Lung as a Model to Study the Absorption of Organic Aerosols. J Pharmacol Method. 1985;13:241–248. doi: 10.1016/0160-5402(85)90024-5. [DOI] [PubMed] [Google Scholar]
- 48.Hamilton KO, Backstrom G, Yazdanian MA, Audus KL. P-glycoprotein efflux pump expression and activity in Calu-3 cells. J Pharm Sci. 2001;90:647–658. doi: 10.1002/1520-6017(200105)90:5<647::aid-jps1021>3.0.co;2-g. [DOI] [PubMed] [Google Scholar]
- 49.Hamilton KO, Topp E, Makagiansar I, Siahaan T, Yazdanian M, Audus KL. Multidrug resistance-associated protein-1 functional activity in Calu-3 cells. J Pharmacol Exp Ther. 2001;298:1199–1205. [PubMed] [Google Scholar]
- 50.Endter S, Francombe D, Ehrhardt C, Gumbleton M. RT-PCR analysis of ABC, SLC and SLCO drug transporters in human lung epithelial cell models. J Pharm Pharmacol. 2009;61:583–591. doi: 10.1211/jpp/61.05.0006. [DOI] [PubMed] [Google Scholar]
- 51.Wagner D, Glube N, Berntsen N, Tremel W, Langguth P. Different dissolution media lead to different crystal structures of talinolol with impact on its dissolution and solubility. Drug Dev Ind Pharm. 2003;29:891–902. doi: 10.1081/ddc-120024185. [DOI] [PubMed] [Google Scholar]
- 52.Marvin and Calculator. ChemAxon; Budapest, Hungary: 2007. [Google Scholar]
- 53.Petitjean M. Applications of the Radius Diameter Diagram to the Classification of Topological and Geometrical Shapes of Chemical-Compounds. J Chem Inf Comp Sci. 1992;32:331–337. [Google Scholar]
- 54.MOE: Molecular Operating Environment. Chemical Computing Group; Montreal, Quebec, Canada: 2007. [Google Scholar]
Associated Data
This section collects any data citations, data availability statements, or supplementary materials included in this article.


