Abstract
This paper presents model simulation results of vapor intrusion into structures built atop sites contaminated with volatile or semi-volatile chemicals of concern. A three-dimensional finite element model was used to investigate the importance of factors that could influence vapor intrusion when the site is characterized by non-homogeneous soils. Model simulations were performed to examine how soil layers of differing properties alter soil gas concentration profiles and vapor intrusion rates into structures. The results illustrate difference in soil gas concentration profiles and vapor intrusion rates between homogeneous and layered soils. The findings support the need for site conceptual models to adequately represent the site’s geology when conducting site characterizations, interpreting field data and assessing the risk of vapor intrusion at a given site. For instance, in layered geologies, a lower permeability and diffusivity soil layer between the source and building often limits vapor intrusion rates, even if a higher permeability layer near the foundation permits increased soil gas flow rates into the building. In addition, the presence of water-saturated clay layers can considerably influence soil gas concentration profiles. Therefore, interpreting field data without accounting for clay layers in the site conceptual model could result in inaccurate risk calculations. Important considerations for developing more accurate conceptual site models are discussed in light of the findings.
INTRODUCTION
Soil vapor intrusion into structures has been studied for decades, but continues to be a difficult process to characterize in the field. Until the early 1990s, most work on this topic was related to radon, a naturally occurring agent whose radioactive nature was the basis of human health risks in impacted structures. Recently, focus has shifted to intrusion of volatile organic compounds (VOCs), semi-volatile organic compounds (SVOCs), and even mercury, present as contaminants at hazardous waste sites. These contaminants are of concern both at the actual release site as well as on neighboring sites, due to subsurface migration that can involve both vapors as well as liquid phases (groundwater and free product).
Irrespective of contaminant, characterization of vapor intrusion risks typically involves sampling subsurface soil gas around and/or beneath the building of concern, and may also include collection of indoor air samples. Chemical analysis of these samples is used to evaluate the risk that vapor intrusion poses to building inhabitants. As in any characterization effort, the collected data must be properly interpreted to reliably determine the level of risk.
The research discussed herein is aimed at providing insight into the vapor intrusion process at sites with non-homogenous geologies, so that field data can be better interpreted and extrapolated to vapor intrusion risks. To date, there has been little clear guidance on how various common geological heterogeneities might impact vapor intrusion rates. Consequently, it has been difficult to establish with certainty whether or not vapor intrusion is a risk at a site that has different geological characteristics than the sometimes assumed homogeneous site conceptual vapor intrusion model.
Several field studies have identified spatial variabilities in soil gas concentrations that were not consistent with simple homogenous site conceptual models (Dawson 2006 and 2008; DiGiulio, 2006; Wertz and Anders, 2006; and Eklund and Simon, 2007). While several factors, including temporal variability and sampling inconsistency, may be responsible for the apparent variability, the purpose of our research was to investigate the role of simple geologic heterogeneities on soil gas concentration profiles and the resulting indoor air concentrations.
Pennell et al. (2008) have described the basic model used here. In general, the model is based on the conceptual understanding of the vapor intrusion process that was set forth by Nazaroff et al. (1987). Since the 1980s, this conceptual understanding has been used as the basis for many of the mathematical models developed to predict radon transport through the subsurface into structures (Nazaroff,1988; Garbesi and Sextro, 1989; Loureiro et al., 1990; Revzan et al., 1991; Wang and Ward, 2000 and 2002). Building on these previous radon efforts, many VOC vapor intrusion models have been developed (e.g. Jury et al., 1990; Johnson and Ettinger, 1991; Krylov et al., 1998; Turczynowicz and Robinson, 2001; Parker, 2003; Devaull, 2007; Mills et al., 2007; Turczynowicz and Robinson, 2007; Abreu and Johnson, 2005 and 2006; Pennell et al., 2008).
The development of more robust three-dimensional (3-D) models for contaminant vapor intrusion, such as that by Abreu and Johnson (2005 and 2006) and the model used in this research (Pennell et al., 2008) allows actual soil gas concentration profiles beneath and around a structure to be described and thus be available to aid in better understanding the implications of actual field data in vapor intrusion risk assessments. For very similar scenarios, our approach gives essentially the same results as Abreu and Johnson (2005) obtained. Hence, while there is a difference in some details of how the model is set up and solved, the same basic processes are represented and the same basic results obtained.
Model Details
A commercially available CFD package, Comsol Multiphysics, was used for the simulations presented here. The model was run using a 4 GB RAM personal computer under either a Windows-based or Macintosh-based operating system. The model used here differs from the Abreu and Johnson model (2005 and 2006) in that it uses a finite element method as compared to a finite difference numerical scheme. Finite element approaches often provide more flexibility than other numerical solving methods because they incorporate non-structured gridding, which allows for modeling complex geometries (more aspects of the choice of one computational scheme as opposed to the other are discussed in Pennell et al., 2008).
In the present paper the model has only been applied in a steady-state mode. Transient behavior will be discussed in future papers, as will the effects of other relevant processes such as biodegradation. The latter have not been included here, since the cases presented are for a chlorinated solvent in which such processes are not believed to be significant.
General Model Structure
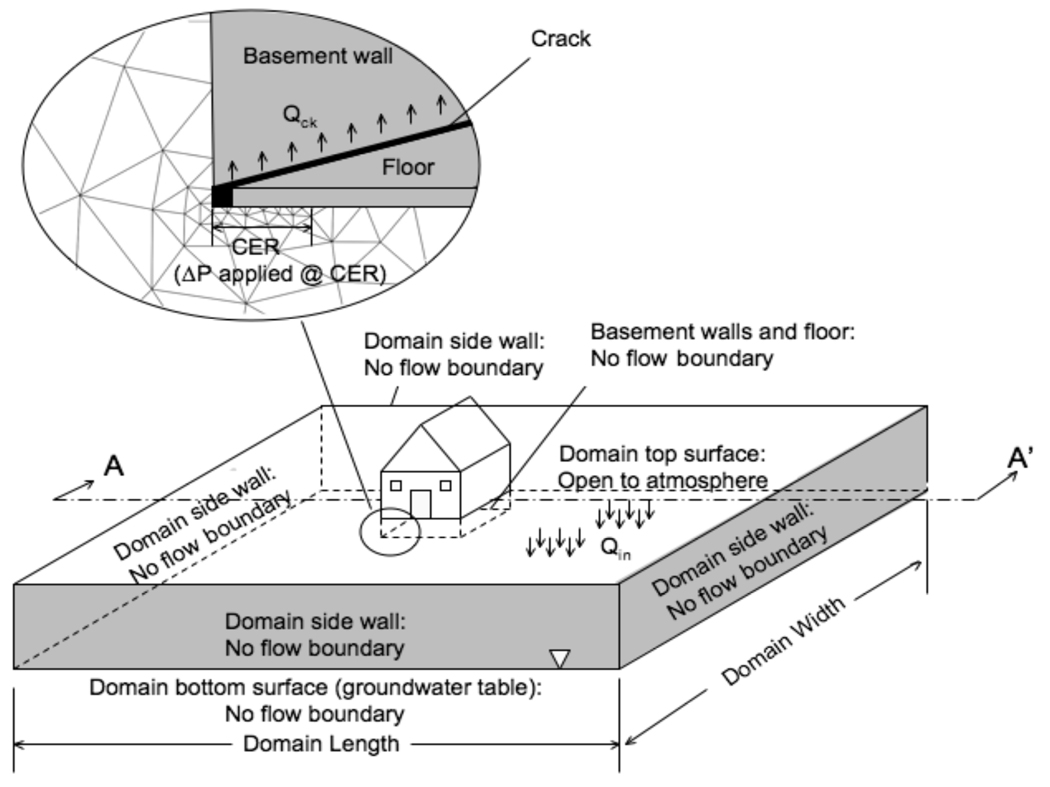
Details of this model are presented in Pennell et al. (2008). Figure 1 illustrates a typical model domain. Pressure gradients in the subsurface result from a “chimney effect” slightly depressurizing the building relative to atmosphere (USEPA, 2005). This depressurization is transmitted into the soil through the assumed breaches (cracks) in the building foundation, and results in a flow of soil gas into the structure through those breaches in the foundation. The pressure at top of the model domain (soil surface) was defined as reference gauge pressure (p = 0 ). It should be noted that all scenarios modeled herein assume the building is under negative pressure; however, the model is also suited for evaluating positive pressure scenarios.
Figure 1.
Schematic of model domain, showing typical finite element gridding. Note the fine gridding required near the foundation crack and CER (see text). The section A-A’ is shown as color concentration profiles and/or pressure profiles in Figures 3, 4, and 5.
There is a concentration gradient-driven upward diffusion of the contaminant from the subsurface source towards the ground surface and the structure. A portion of the upward diffusing contaminant is captured by and carried with the advective flow entering the structure (though diffusion through foundation cracks can also play a role in the process). The basic processes modeled here are the same as those in Johnson and Abreu (2005).
Table 1 lists the governing equations used as the basis of the model. Details of application of these in the present implementation have been given in Pennell et al. (2008). Indoor air concentrations are obtained by first solving equation (1) for a given depressurization,; and then applying equation (3) for the contaminant, finally linking the results to the indoor conditions via equations (2) and (4).
Table 1.
Summary of Model Equations
| Equation 1: Soil Gas Continuity |
Where: q⃗ = Gas velocity (L/t) k = Intrinsic permeability (L2) ρg= Density of soil gas (M/L3) μg= Dynamic Viscosity of soil gas (M/L/t) g = gravitational acceleration (L/t2) P = Pressure of soil gas (M/L/t2) z = elevation(L) Note: Equation 1 is valid for gas flow in soils where slip flow is negligible (sands and gravels). For fine-grained materials, Darcy’s Law (Equation 1) may underestimate flow.27 |
||
| Equation 2. Pressure Drop Across Crack Note: Qck=QCER |
Where: Δpck = pressure drop across crack (assumes parallel plates) (M/L/t2) wck = Width of crack (L) dck = Length of crack through foundation depth (L) QCER = Soil gas flow rate into the characteristic entrance region (L3/t) Qck= Soil gas flow rate through crack into building (L3/t) |
||
| Equation 3. Chemical Transport Millington (1959) |
Where: JT = Bulk mass flux of “i" (M/L2/t) C = Concentration of “i” in soil gas (M/L3) = effective diffusivity coefficient of “i” in soil gas phase (L2/t) Diair= molecular diffusion coefficient for “i” in air (L2/t) Diw= molecular diffusion coefficient for “i” in water (L2/t) KH = Air:water partition (Henry’s) coefficient (unitless) η= porosity; t=total, g=gas-filled, w=water-filled (L3/L3) |
||
| Equation 4. Indoor Air Concentration Note: Cck= CCER and Qck= QCER |
Special case for chemical transport across building foundation. Where: Cindoor= Concentration of “i” in the indoor air (M/L3) Cck= Concentration of “i” entering foundation crack (M/L3) CCER= Concentration of “i” entering the CER (M/L3) Ae= Air exchange rate of building (1/t) Vb= Volume of basement (L3) |
||
Figure 1 shows some of the finite elements that define the domain, and the use of the finite-element solution technique is the main difference between this work and the finite-difference approach of Abreu and Johnson (2005, 2006). The domain, as shown in Figure 1, is large enough that the effects of any pressure field disturbances near the structure are not affected by the location of the exterior model boundaries. No- flow boundary conditions are applied at the exterior domain boundaries (i,e., soil gas should not be laterally flowing into or out of the domain). In the cases presented here, a 100m × 100 m domain satisfied this condition. No flow boundary conditions (and no contaminant flux conditions) were specified at all solid foundation boundaries except at the foundation breach. For chemical transport into the building the chemical flux at the foundation crack was a function of the concentration at the crack and was calculated using eq 4. This boundary condition ensures that contaminant entry rate into the building from the crack region does not exceed chemical diffusion entering the crack from the subsurface; in other words, the transport of contaminant into and out of the crack region are equal. A water table is assumed as a lower horizontal domain boundary (at 8 m depth) and is the source of contaminant vapor (by volatilization) and is assumed infinite in extent and contaminant amount. Here, the contaminant concentration was taken as the Rhode Island nonpotable groundwater standard for TCE (0.54 mg/L). Henry’s law was assumed to apply for volatilization from the water.
Pennell et al. (2008) discusses the importance of proper meshing around areas of interest (such as the crack) when converging an accurate model solution. They also discuss the iterative approach that is taken to arrive at an accurate solution. First, mass balances on airflow are confirmed. Typically air mass balance is achieved >99.9%. In addition, mass balances on contaminant transport are verified in the absence of gas flow (typically >99% is achieved). Both mass balances, air and chemical, are determined using weak constraints. The use of weak constraints solves for one or more Lagrange multipliers. Lagrange multipliers provide accurate determinations at flux boundaries, without which finite element methods can sometimes result in inaccurate boundary integrations.
Scenarios Modeled
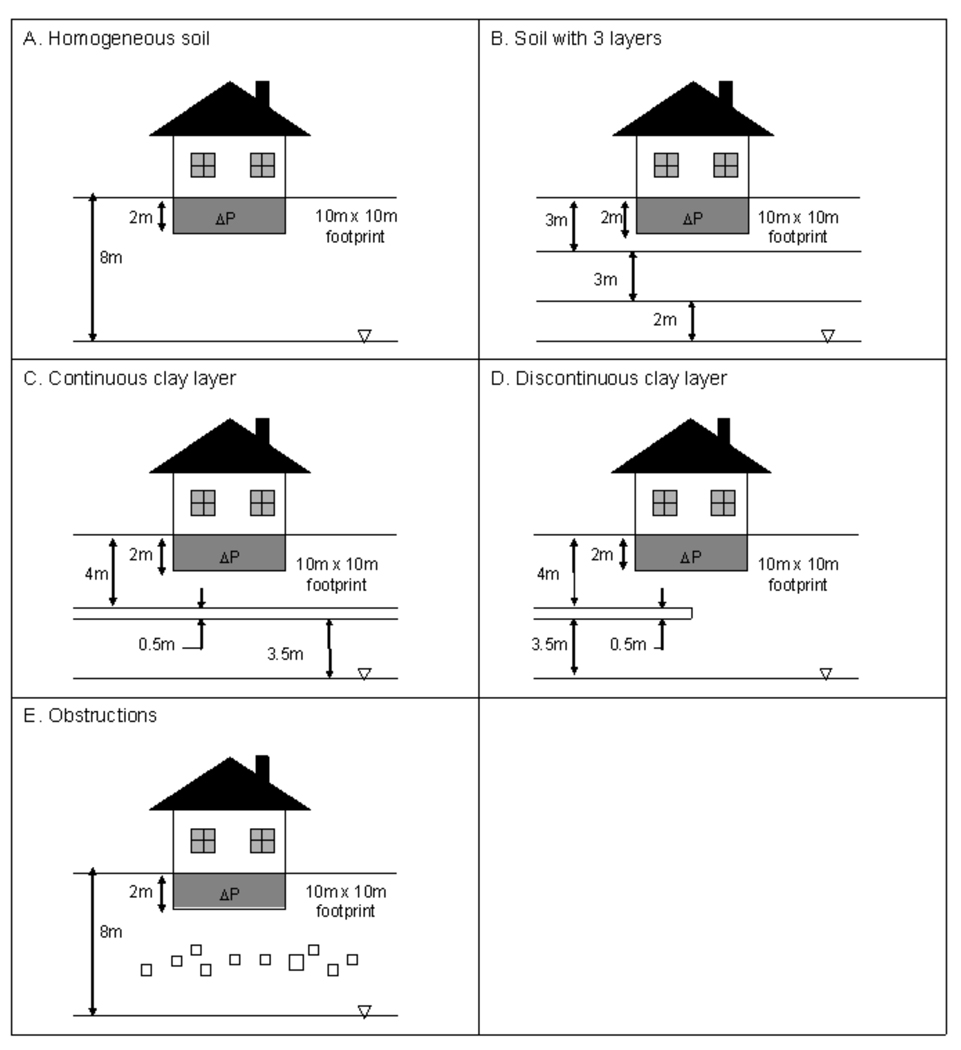
The model was implemented for the five different scenarios illustrated in Figure 2. A single building (10 m × 10 m footprint) with a basement extending 2 m below ground surface (bgs) was located in the center of the domain for each scenario. The simulations examined a nominal 5mm wide perimeter crack around the floor of the basement. All cases were modeled for a constant 5 Pa internal depressurization, except as noted. Various field studies have shown actual fluctuations in building pressurizations, as well as wind-driven advection in soils (Turk et al. 1990; Lundegard et al. 2008, Fischer et al. 1996) and depending upon the application of the model, these might need to be considered. For simplicity the building pressure was here held constant for the scenarios presented herein, though we will shortly present results on the effect that building pressurization fluctuations can have on vapor intrusion potentials. As may be seen below in comparing Figures 3 and 4, calculated soil gas concentration profiles were nearly identical whether building depressurization took place or not.
Figure 2.
Scenarios modeled. A. Homogeneous soil. B. A situation in which there are three different horizontal soil layers, each characterized by different permeability-diffusivity combinations, as outlined in Table 2. C. A situation in which there is a continuous layer of wet clay between the structure and the groundwater source. D. A situation in which there is a clay layer as in C, but in which it terminates directly beneath the structure. E. A situation in which there are scattered obstructions, such as boulders, distributed beneath the structure.
Figure 3.
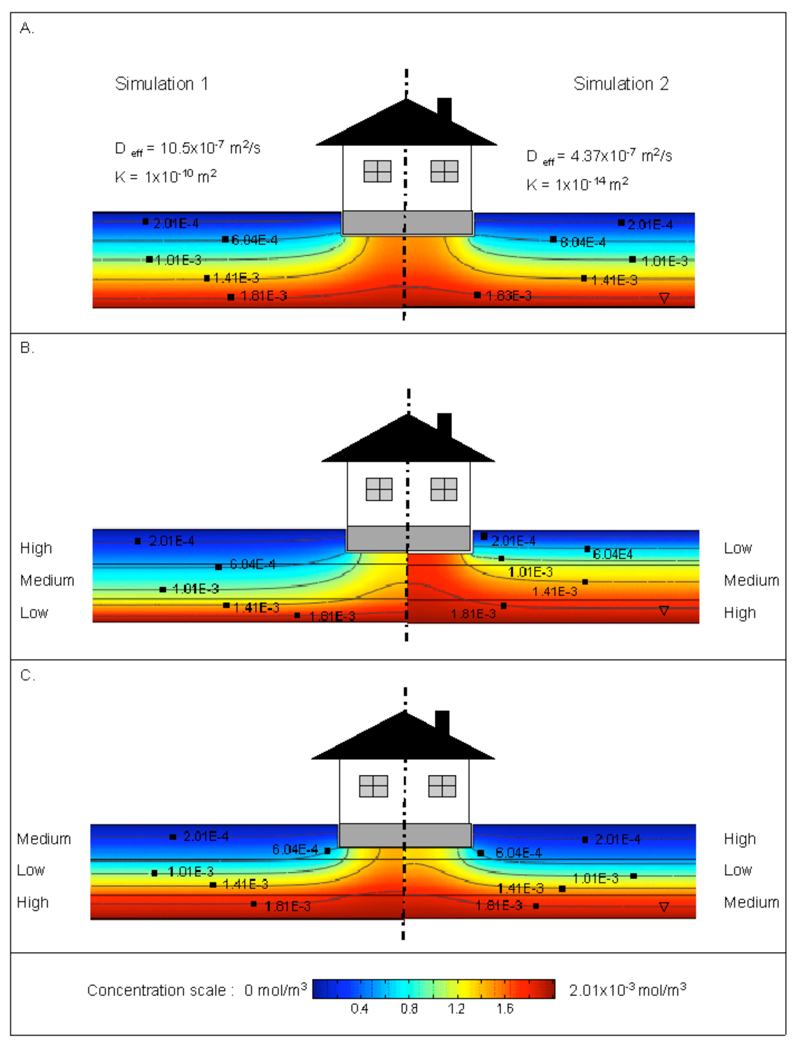
Soil gas concentration profiles for different permeability and diffusivity soils. All cases assuming no internal building depressurization (ΔP=0). A. Homogeneous soil; left hand side - high permeability and diffusivity; right hand side- low permeability and diffusivity. B. and C. multilayer soils, showing influence of different soil layer configurations.
Figure 4.
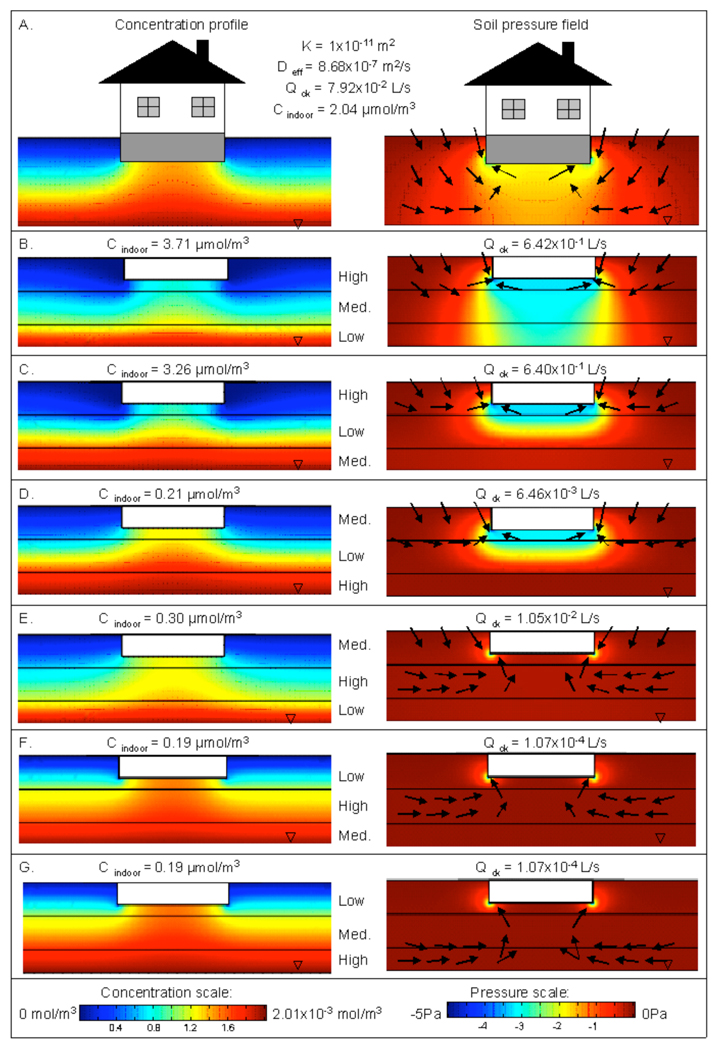
Soil gas concentration profiles (left hand side) and pressure fields (right hand side) for homogeneous and layered soil scenarios. In this case, the internal building depressurization is assumed to be 5 Pa. In the pressure field plots, qualitative soil gas velocity vectors are shown. Within the structure foundation are indicated the calculated indoor air concentrations (left hand side) and soil gas entry flowrates (right hand side). Panel A. shows results for a homogeneous soil. Panels B. through G. show results for layered soils.
Soils with five different intrinsic permeability values were considered (k = 10−10, 10−11, 10−12, 10−13, 10−14 m2), along with much lower permeability clay (see scenarios below). Other soil properties were assumed to be correlated with the permeability values, as shown in Table 2. The effective diffusivity of the soil decreased with decrease in permeability simply because of the assumption of specific porosity and soil moisture conditions and not because the two properties must be inherently correlated.
Table 2.
Summary of Model Parameters
|
Geometry Domain Size: 100 m × 100m Number of Elements: 410 000 – 630 000 Maximum Element size: 3.5 m Minimum Element size: 0.012 m Characteristic Entrance Region (CER): 0.1 m Crack Width (wck): 0.005 m Crack Depth (dck): 0.152 m Crack Area (Ack): 0.199 m2 CER Width (wCER): 0.10 m CER Area (ACER): 3.96 m2 Basement Volume: 233 m3 Chemical Properties Contaminant: Trichloroethylene (TCE) Groundwater (Source) Conc. : 0.540 mg/L Henry’s Constant: 0.49 (dimensionless) Diffusivity of TCE in Air: 7.4E-6 m2/s Density of Air: 1.16 kg/m3 Viscosity of Air: 1.86E-5 kg/m/s Miscellaneous Parameters Disturbance pressure = −5 Pa Air exchange rate: Ae = 0.5 hr−1 |
Soil Properties a Base Case Intrinsic Permeability: k = 10−11 m2 Effective Diffusivity: = 8.68E-7 m2/s Total Porosity: ηT = 0.35 Moisture Porosity: ηw = 0.07 High Permeability/Diffusivity Intrinsic Permeability: k High = 10−10 m2 Effective Diffusivity: = 1.05E-6 m2/s Total Porosity: ηT = 0.30 Moisture Porosity: ηw = 0.03 Medium Permeability/Diffusivity Intrinsic Permeability: k Medium = 10−12 m2 Effective Diffusivity: = 8.68E-7 m2/s Total Porosity: ηT = 0.35 Moisture Porosity: ηw = 0.07 Low Permeability/Diffusivity Intrinsic Permeability: k Low = 10−14 m2 Effective Diffusivity: =4.37E-7 m2/s Total Porosity: ηT = 0.45 Moisture Porosity: ηw = 0.19 Saturated Clay Layer: Intrinsic Permeability: k = 10−19 m2 Effective Diffusivity: = 6.72E-10 m2/s Total Porosity: ηT = 0.45 Moisture Porosity: ηw = 0.33 Medium Low Permeability/Diffusivity (Figs. 12–15) Intrinsic Permeability: k = 10−13 m2 Effective Diffusivity: = 6.61E-7 m2/s Total Porosity: ηT = 0.45 Moisture Porosity: ηw = 0.15 |
The porosity and moisture content values are within typical ranges as reported by Driscoll (1986) and consistent with parameters values used in previous 3-D modeling efforts (Abreu and Johnson, 2005).
The scenarios are as follows:
Homogeneous Soil (Figure 2A): This is the base case scenario with a single building in the center of an open field with homogeneous soil throughout the domain (as also described in Pennell et al., 2008).
Layered Soil (Figure 2B): The subsurface was modeled as three distinct soil layers of differing properties. The top layer extends from the ground surface to 3 m bgs, the middle layer from 3 m bgs to 6 m bgs, and the bottom layer from 6 m bgs to the groundwater table at 8 m bgs. Six different permutations of three soils were used (k=10−10m2, 10−12 m2 and 10−14 m2, with corresponding assumed effective diffusivity values).
Soil with Water-Saturated Continuous Clay Layer (Figure 2C): A 0.5 m thick clay layer was located 4 m bgs. This layer was assumed saturated, such that it was a barrier to vapor transport. Species transport was allowed to occur across the clay layer by liquid diffusion (effective diffusivity of TCE in water 6.72E-10 m2/s, and accounting separately for fraction of water-filled area). The permeability of such a clay layer is extremely low, here taken to be k = 10−19 m2.
Soil with Water-Saturated Discontinuous Clay Layer (Figure 2D): This scenario is similar to that above, except that the clay layer only extends horizontally over half of the domain (the other half domain is homogeneous soil).
Soil with Scattered Obstructions (Figure 2E): Obstructions (boulders, rocks) ranging in size from 0.25 to 0.5 m diameter were distributed throughout the domain between 3 and 5 m bgs. Approximately 1.5% of the area under the structure was occluded by impervious structures. The soil was otherwise homogeneous.
RESULTS AND DISCUSSION
Calculation results are first presented as color plots of calculated soil gas concentration profiles, in Figures 3 through 5. The dramatic differences in soil gas concentration profiles shown in these figures show the difficulty in using soil gas data by themselves to characterize vapor intrusion risks, if there is not at the same time a proper understanding of the site’s geology to help in interpreting such data.
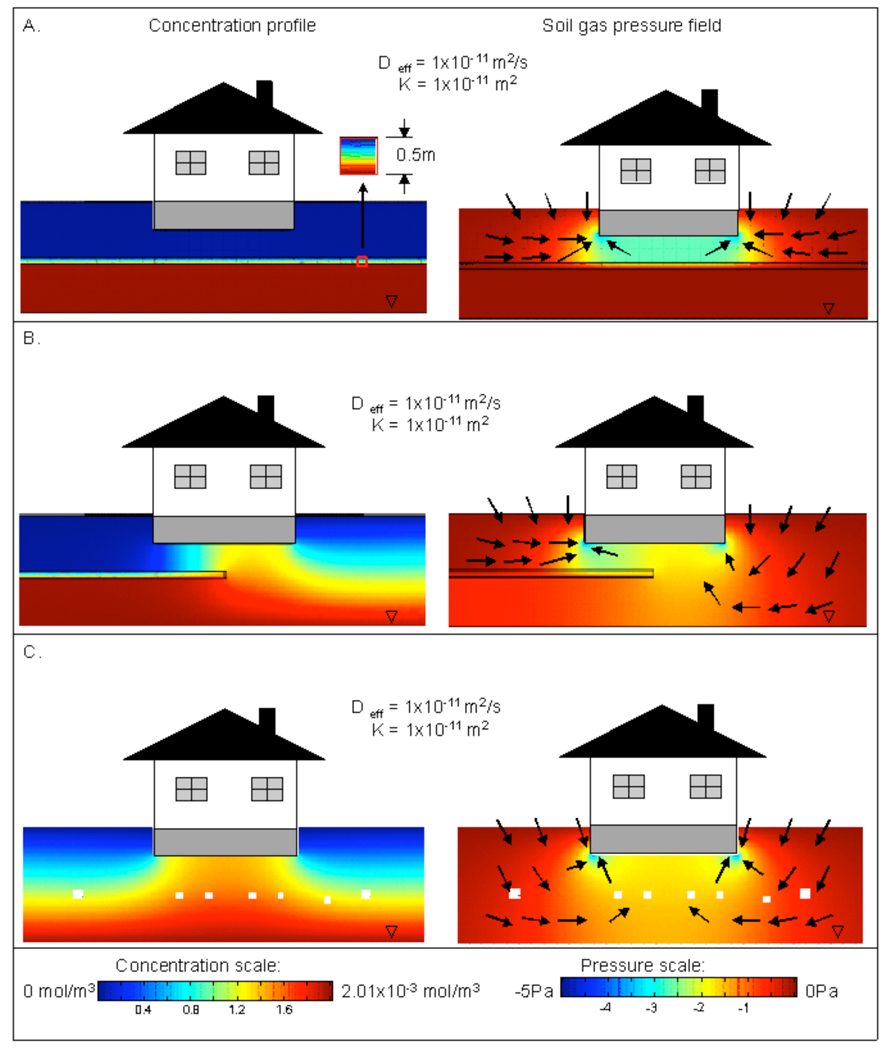
Figure 5.
Soil gas concentration profile and pressure field plots for A. a soil containing a continuous clay layer, B. discontinuous clay layer, and C. soil with miscellaneous obstructions. In pressure field plots (right hand side figures) , qualitative soil gas velocity vectors are shown.
Figure 3 was calculated for the case of no building depressurization, and thus no induced advective flow, in order to show the dominant influence of pure diffusional transport on the soil gas concentration profiles. The topmost panel of Figure 3 shows soil gas concentration profiles for different permeability/diffusivity soils, deliberately selected to show different bounds of what might be normally encountered in the field. The left hand side of Figure 3A shows the model results for a homogeneous soil with relatively high diffusivity (and permeability, though advection does not play a role here), and the right hand side the same model run for rather impermeable, low diffusivity soil. The concentration profiles on the two sides of Figure 3A are strikingly similar, as they must be, since in a steady state diffusional process in homogeneous media with no biodegradation or other reaction processes taking place, the concentration profiles must be the same, even if the diffusion rates themselves are vastly different (the rate of diffusion in the left hand panel is much higher than that in the right hand panel). Thus, it is immediately apparent that attempting to characterize a vapor intrusion situation using only soil gas measurements, or soil gas concentration profiles, will not be reliable for establishing the rate of contaminant migration, and hence, vapor intrusion potential.
It is also worth noting here how the soil gas concentration profiles always neck upwards in the shadow of the structure. These subsurface concentration profiles are similar to those shown previously for other cases by Abreu and Johnson (2005). This is also to be expected, since the structure’s foundation is a solid barrier to upward diffusion of the vapor. Thus subslab contaminant gas concentrations will always be higher than those measured at the same depth outside of the building footprint. This is true irrespective of the existence or absence of advective transport, which plays no role here (and which would affect the results only at high flowrates).
Figures 3B and 3C present layered soil computations also under pure diffusion conditions. In Figure 3B, the left hand panel shows results for when the surface soil layer is characterized by high diffusivity and the right hand panel for when the surface soil layer is of low diffusivity. Both these cases involve an intervening soil layer of intermediate diffusivity (diffusivities are those given in Table 2). As in any multilayer diffusion problem, the lowest diffusivity layer controls the overall rate of transport. The right hand panel of Figure 3B shows the “capping” effect of the topmost low diffusivity soil layer. The resistance to diffusion of contaminant to the atmosphere is greatest across this low diffusivity layer, which requires the steepest concentration gradient to be located in this layer. Concentration profiles in the higher diffusivity layers below this are much more uniform and the actual concentrations nearer the source concentration. These differences in the soil gas concentration profiles are entirely a result of the assumed diffusion process and are a consequence of the differences in the effective diffusivities for each layer, since there is no advection involved. However, these profiles do not yet by themselves speak to the indoor air concentrations, discussed below. These results by themselves do not permit reliable assessment of vapor intrusion potentials, as will be seen.
Figure 3C presents a different arrangement of the different diffusivity layers, with the low diffusivity layer being in the middle of the high and low diffusivity layers. The similarity of the profiles on both sides of this panel is notable, even though subtle differences are evident. In both cases, the presence of the middle low diffusivity layer has the effect of establishing a high contaminant concentration zone below it. Both the left and right panels of Figure 3C show relatively low contaminant concentration in the top soil layers, because the main diffusional resistance exists below those top layers. Hence, knowledge of the diffusivity of a particular soil layer will not by itself necessarily allow prediction of a contaminant concentration level in that layer, even if the distance to a source is know; it is the interplay of the properties of different diffusivity layers that can determine the observed in-ground concentration profiles.
Although the soil gas concentration profiles are different in the various scenarios of Figures 3B and 3C, the contaminant flux from source to ambient would be almost equal in all those scenarios. This is not quite true only because the bottom layer is one meter thinner than the top and middle layers (we chose the total 8 m thickness so that the results would be comparable to results in Pennell et al. 2008, while maintaining whole meter values for layer thicknesses). If the thicknesses of the soil layers were all equal the fluxes in all cases would have to be equal, because that is the requirement in a steady state series resistance diffusion (or conduction) problem such as this. An electrical analogy would consist of a series circuit of three resistors operating across a constant voltage difference - the current would be the same, regardless of the ordering of resistors, and only the voltage at the junctions between the resistors would be different (the voltage drops across the resistors are analogous to the soil gas concentration gradients in the present problem). Numerous publications highlight calculation of effective diffusivity values for layered soils (e.g. Johnson et al. 1998).
Figure 4 shows soil gas concentration profiles and pressure fields for layered soil geologies, compared with a simple base case of a homogeneous soil in Figure 4A. For the cases shown here, the building was always depressurized relative to atmospheric pressure (−5 Pa), so as distinct from Figure 3, advection does play a role. It is, however, immediately apparent in comparing Figures 3 and 4 that the basic soil gas concentration profiles are qualitatively similar. This confirms the basic nature of the phenomenon- diffusion of contaminant vapor in the soil determines the general profile around a building, but it is details of the flow in the vicinity of the building that determine the indoor air concentrations.
Arrows on the pressure field plots of Figure 4 show qualitative vectors for soil gas flow (the size of the vectors do not indicate magnitude – the arrows are only intended to convey direction). These plots show the common feature that air is drawn into the soil from the surface by the pressure gradient within the soil, and the depressurized structure is the sink for this airflow. Flow rates into the foundation crack are in the usual range, of order liters per minute. To the extent that airflow crosses a region of non-zero contaminant vapor concentration, it carries the contaminant with it, including into the structure. This is a well-established feature of the vapor intrusion problem.
Figure 4 shows the impact of different soil layer arrangements on the flow rate into the building, and resulting indoor air concentrations. It can be seen that if the soil consists of multiple layers with different soil properties, the indoor air concentration is highest when the permeability/diffusivity of the topmost layer is high, despite the fact that the soil gas concentrations beneath the building actually are then lowest. To understand why, reference is made to the air flow rates entering the building, values for which are shown inset into the basement areas in the right hand side of Figure 4. Higher permeability surface soil permits relatively higher air entry rates into the building, and this flow carries with it more mass of contaminant into the structure from the soil near the foundation. It is the product of flow rate and concentration that determines the all-important mass entry rate.
Soil gas flow field is strongly affected by the arrangement of the different soil layers. The right hand panels of Figure 4A qualitatively show the soil gas flow field for the homogeneous soil case, and Figures 4B through 4G show the flows in the layered soil cases. When a low permeability soil is beneath a high permeability soil, such as in Figures 4C and 4D, the low permeability layer creates resistance to soil gas flow through that layer, and a pressure gradient of some magnitude can be sustained. If the order of the layers is changed, as in Figures 4E, 4F, and 4G, then the pressure gradient is dissipated in the high permeability layer located beneath a low permeability layer. Thus significant soil gas flow takes place in that higher permeability layer, but there is no pressure gradient to drive flow from the lower, low permeability layers.
The indoor air concentration for the homogenous soil case with k=10−11 m2 (Figure 4A) is similar to the indoor air concentrations calculated for the layered soil cases with the high permeability/diffusivity soil at the top (Figures 4B and 4C). The value of soil permeability around the foundation has an apparent effect on indoor air concentrations, but the different soil layers that are adjacent to this high permeability layer can also influence the indoor air concentration. The presence of the lower permeability layers beneath the high permeability soil layer results in nearly an order of magnitude lower indoor air concentration, as compared to a homogenous soil with similar properties (i.e. k=10−10 m2) (comparison here is with results reported in Pennell et al. 2008). It should be noted that Pennell et al. (2008) considered the effect of porous material (10 inches thick) beneath the foundation for otherwise homogenous geology. The presence of a porous subbase resulted in slightly higher indoor air concentrations, as compared to a homogenous geology without a porous subbase. This trend is consistent with the results presented herein.
Figures 4B and 4C illustrate that due to high air flow rate in the soil around the building foundation, scenarios with high soil permeability values often show a low concentration area near the foundation breaches. Again, this does not mean that the indoor air concentration will be low, as the results from this calculation demonstrate. As already noted above, it is always the product of air inflow and concentration that determines indoor air concentration.
When the top layer of the multi-layered soil is assigned a low permeability/ diffusivity value (Figures 4F and 4G), this layer again acts as a cap, just as in the pure diffusion cases of Figure 3. Here, the low permeability limits the flow of atmospheric air into the soil, which limits dilution of the contaminant in the soil near the foundation. Concentration of the contaminant at the foundation is high in this scenario. Nonetheless, the indoor air concentration is much lower than the scenarios with high soil permeability values, due to lack of airflow carrying contaminant into the building.
For many sites, it may be possible to approximate soils at sites of concern as relatively homogeneous, save for discrete features with very different permeability and diffusivity characteristics. Some examples are shown in Figure 5. Insertion of a continuous clay layer between the source and the building is illustrated in Figure 5A. The presence of such a clay layer drastically reduces the species transport into the building. The clay layer is seen to “bottle up” the contaminant below itself. The insert on the left hand side of Figure 5A shows that there is actually a concentration gradient across the clay layer itself, but the resistance to diffusion of the contaminant across that layer is so high as to leave the soil immediately beneath the structure almost free of contaminant. The wet clay layer effectively acts as a shallow source that absorbs the contaminants from beneath and only slowly releases them to the upper soil layers. Because the contaminant concentration near the foundation is very low, then the air flowing into the building does not carry much contaminant, and indoor air concentration is low.
On the other hand, a discontinuous clay layer beneath the building footprint has far less effect in reducing indoor air concentrations (Figure 5B). The clay layer splits the domain horizontally into two regions. Beneath the clay layer contaminant concentration is almost equal to the source concentration just as for the continuous clay layer. Where there is no clay layer, the concentration profiles are similar to those for homogeneous soil (see Figure 5B).
There is often a question as to how discrete impervious zones might influence the vapor intrusion process. There are of course a great many configurations that could be examined, but here we considered a case of a number of boulders or large rocks spread out at a given depth below the structure. As seen in Figure 5C, such small obstructions in the domain do not significantly influence concentration profiles, nor do they influence the soil gas flow rate into the building. The indoor air concentration also remains as same as in the homogenous soil scenario.
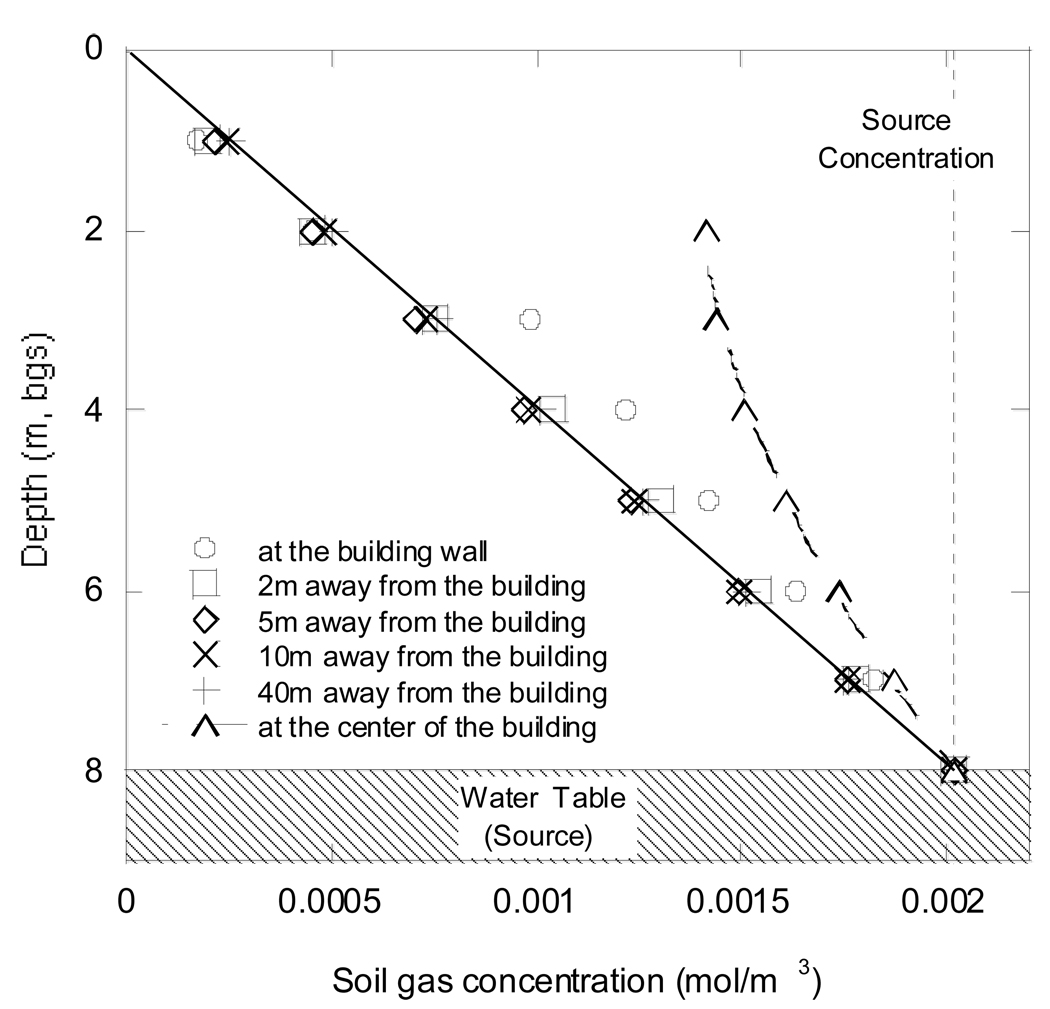
While the above color plots are useful in providing a quick, qualitative understanding of the soil gas concentrations, for many purposes more traditional graphs of concentration as a function of position better illustrate the phenomena. Figure 6 shows the soil gas concentration values for a base case of k=1×10⁻¹¹ m2, and Deff = 8.68×10⁻⁷ m2/s, at different depths and distances away from the building of interest. The line in Figure 6 connects soil gas concentration values at a distance of 40 meters away from the building. This is far from where there is any induced advective flow and where simple diffusion theory demands a linear concentration gradient for steady state diffusion. Figure 6 also shows that even at a distance of only 2 m from the foundation wall, the linear concentration profile of diffusion-dominated transport is already observable. Thus a soil gas concentration measured at two meters depth only two meters away from the foundation would be much different than a subslab concentration at essentially the same depth. Figure 6 is also a very close approximation to the calculated profiles in the case of scattered obstructions in homogeneous soil. The obstructions act locally, and when widely dispersed as assumed, their impact is not large.
Figure 6.
Soil gas concentration values at different depths and distances from building foundation for a homogeneous soil scenario. k=1×10⁻¹¹ m2, and D eff = 8.68×10⁻⁷ m2/s. Building depressurization of 5 Pa was assumed in this case. These profiles are also very similar to those generated for the case of soil with scattered obstructions (Figure 2E).
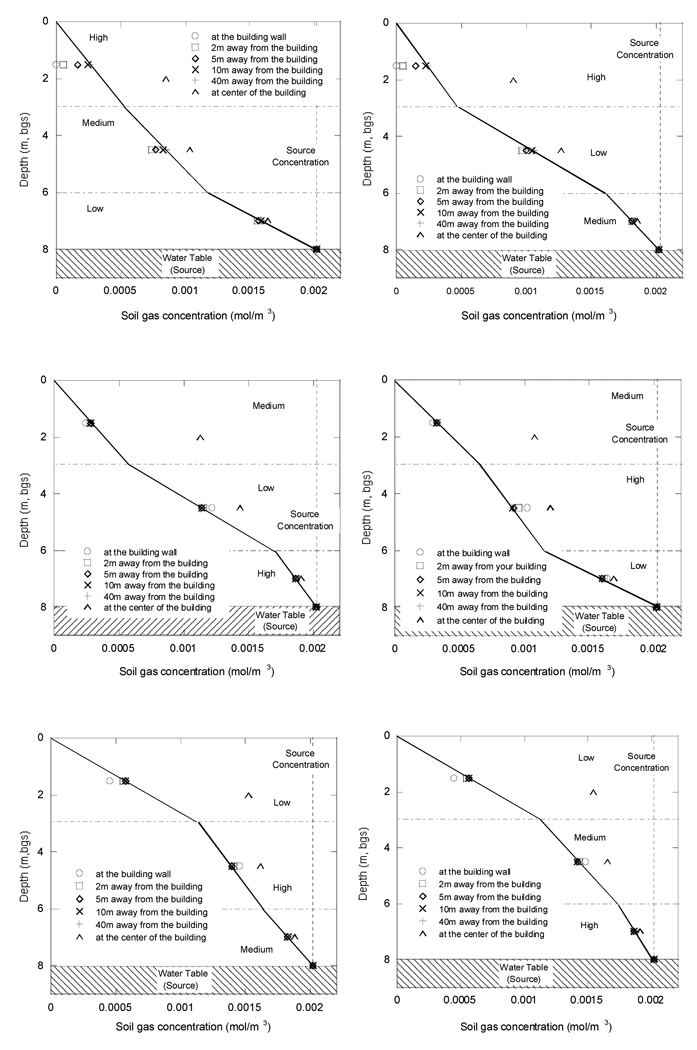
Figure 7 illustrates the concentration profiles in the different layered soil scenarios. The top two panels show the high permeability soil at the top, the middle two panels show the medium permeability soil as the surface layer, and the lowest panels show the low permeability soil at the surface. Again, it is instructive to consider the concentration profiles far from the building foundation. While the slopes of the lines connecting the points at 40 m distance remain linear within each layer, they change from one layer to another.
Figure 7.
Soil gas concentrations in layered soil scenarios.
The low diffusivity layer always has the flattest slope whereas the high diffusivity layer always has the steepest slope in Figure 7. Because of how these results are plotted, with depth as the ordinate and concentration as the abscissa, low slope actually indicates the steepest concentration gradient, i.e., low diffusivity gives the highest gradient with depth, dC/dz, and high diffusivity the lowest.
Figure 7 allows predicting what would happen in characterization of soil gas concentrations, when dealing with different soil types. One can compare soil gas concentration results for what are characterized as the “low” diffusivity soil to medium, or high, diffusivity soils (the latter two are similar to one another). It can be observed that in the higher diffusivity (and permeability) soils, subslab concentrations are closer to concentrations taken far from the building at that same depth. For example, compare the horizontal distance from the fitting line representing the concentration gradient far from the building to the subslab points (triangles) for the case of the top soil layer being low vs. high diffusivity/permeability. In low permeability/diffusivity layers, larger differences can exist between these values.
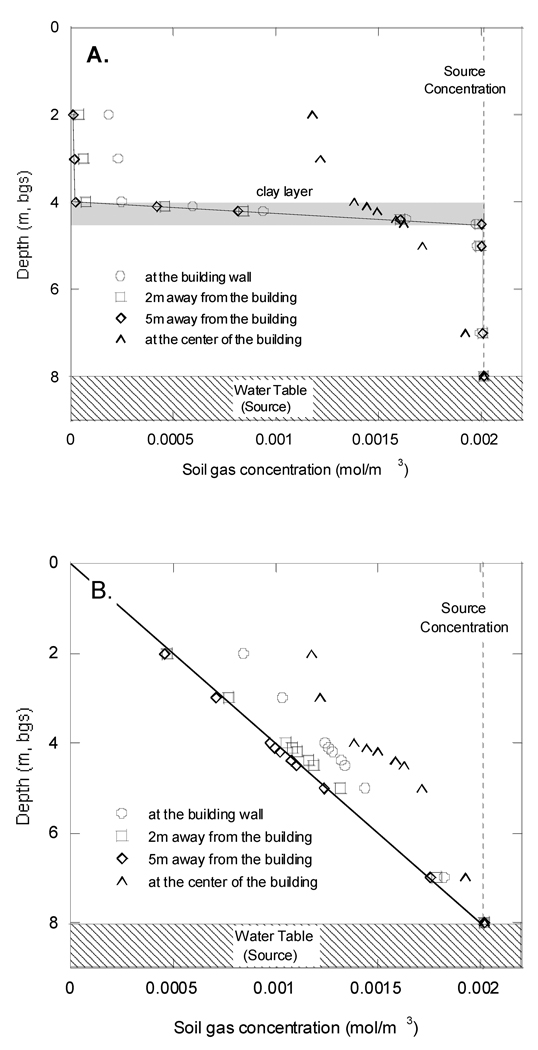
Figure 8 shows the soil gas contaminant concentration values for the discontinuous clay layer (4 m bgs) scenario. Figure 8A, shows the profile under the side of the domain that has a clay layer. At distances beyond the building wall, there is a very abrupt decline in concentration across the clay layer, identical to what is seen in the continuous clay layer case (results not shown). Immediately below the center of the building foundation, the influence of the side without a clay layer is apparent. Figure 8B shows the profiles observed on the side of the building with no clay layer. In this case, the continuous gradient associated with diffusion-dominated transport in a homogeneous medium is obtained already within 2 m of the foundation wall. This illustrates that the effect of a barrier to vertical vapor migration (such as a clay layer) dissipates at distances close to the barrier’s point of termination.
Figure 8.
Soil gas concentration values in the discontinuous clay layer scenario. Permeability of top and bottom homogeneous soil for this scenario are k=1×10⁻¹¹ m2, and D eff = 8.68×10⁻⁷ m2/s. A. Profiles beneath the side with clay layer. B., Profiles beneath the side with no clay layer. Curve in Figure 8A is the same as the concentration profile in the continuous clay layer case.
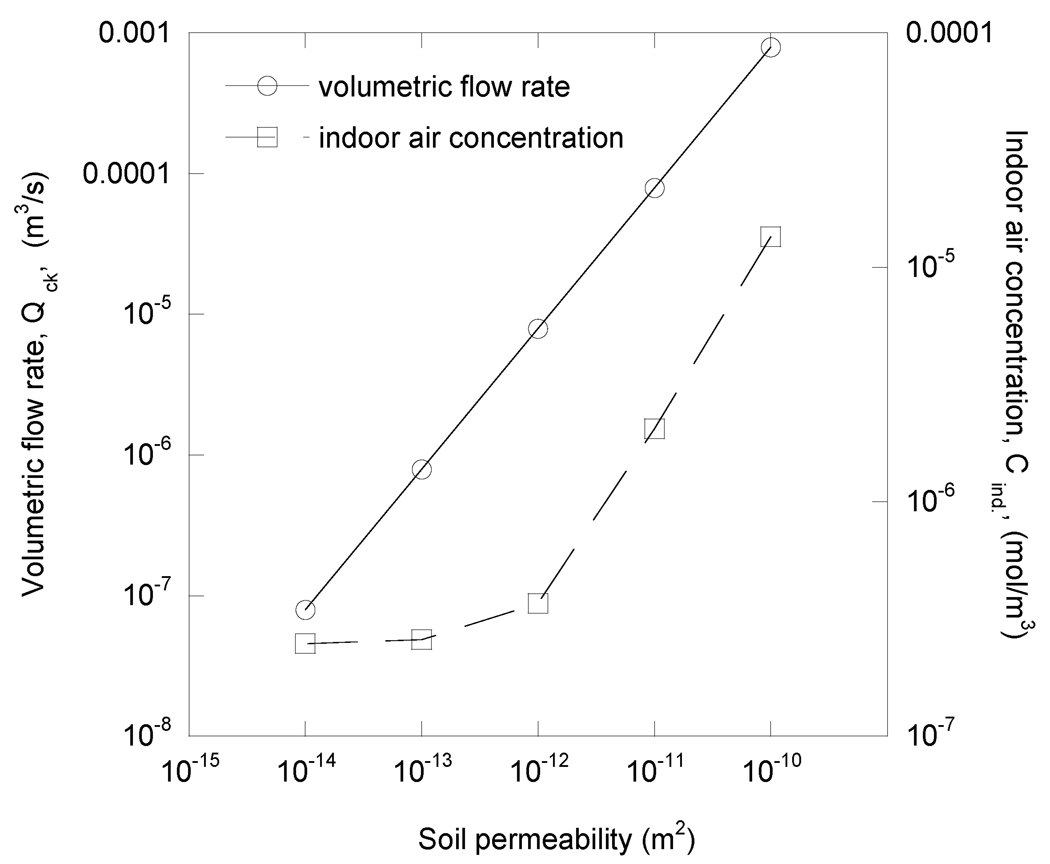
The influence of soil permeability/diffusivity was examined with respect to its effect on indoor air contaminant concentration and on soil gas flowrate into the house. Figure 9 shows the results for different soils in a homogeneous soil cases. Again, the indicated value of permeability was associated with a corresponding value of diffusivity, as shown in Table 2. It is clear that the indoor air concentration rises as the flow rate of soil gas into the building increases. The diffusional process in the soil is important for establishing the soil gas concentration profile around the building, but it is the actual entry of soil gas into the structure that determines the magnitude of the indoor air problem. Low permeability soils do not allow much airflow, and thus protect the house from high indoor air concentrations. As mentioned previously, the results of Pennell et al. 2008 illustrated that a porous subbase can result in (slightly) higher soil gas flowrates, and therefore result higher indoor air concentrations. For sites where a porous subbase is known or thought to exist, the effect that this highly permeable zone may have on vapor intrusion rates should be considered.
Figure 9.
Indoor air concentration and volumetric flowrate into building, for different soil permeabilities/diffusivities in homogeneous soil case. The results are identical for the case of homogeneous soil with scattered obstructions.
CONCLUSIONS
The model simulation results presented here illustrate the effects of geological features and soil inhomogeneity on subsurface vapor distributions and indoor air concentrations. A limited set of steady state scenarios illustrating features of potential practical importance was simulated (and biodegradation was not considered here because of its limited importance in the case of chlorinated solvents). The results illustrate that soil gas profiles and flow patterns reflect the characteristics of the subsurface. Site conceptual geologic models can be tested by looking for consistency between the proposed geology and observed soil gas profiles. Soil gas profiles themselves will not necessarily be sufficient to establish all features, and some characterization of subsurface flow or pressure distribution would also be desirable. The present results also indicate that settings having apparently similar soil gas distributions can potentially correspond to a wide range of indoor impacts, and the differences are largely linked to the permeability of the soil surrounding, and beneath, the foundation and its effect on pressure-driven soil gas entry rates through foundation cracks. The simulations suggest, consistent with other earlier published results, that measured subslab or near-foundation soil gas concentrations will not necessarily serve as an adequate predictor of indoor air concentration.
ACKNOWLEDGEMENTS
The project described was supported by Grand Number P42ES013660 from the National Institute of Environmental Health Sciences. The content is solely the responsibility of the authors and does not necessarily represent the official views of the National Institute of Environmental Health Sciences or the National Institutes of Health.
REFERENCES
- Abreu LD, Johnson PC. Effect of Vapor source --Building Separation and Building Construction on Soil Vapor Intrusion as Studied with a Three-Dimensional Numerical Model. Environmental Science and Technology. 2005;39:4550–4561. doi: 10.1021/es049781k. [DOI] [PubMed] [Google Scholar]
- Abreu LD, Johnson PC. Simulating the Effect of Aerobic Biodegradation on Soil Vapor Intrusion into Buildings: Influence of Degradation Rate, Source Concentrations. Environmental Science and Technology. 2006;40:2304–2315. doi: 10.1021/es051335p. [DOI] [PubMed] [Google Scholar]
- Dawson H. Revised Guidance on Exterior Site Specific Screening. 16th Annual AEHS West Coast Conference on Soils, Sediment and Water, Oral Presentation.2006. [Google Scholar]
- Dawson H. EPA Vapor Intrusion Database: Preliminary Analysis of Attenuation Factors. 16th Annual AEHS West Coast Conference on Soils, Sediment and Water, Oral Presentation.2008. [Google Scholar]
- Devaull GE. Indoor Vapor Intrusion with Oxygen-Limited Biodegradation for a Subsurface Gasoline Source. Environmental Science and Technology. 2007;41:3241–3248. doi: 10.1021/es060672a. [DOI] [PubMed] [Google Scholar]
- DiGiulio D. Assessment of Vapor Intrusion in Homes Near Raymark Superfund Site – Discussion of Findings Related to EPA’s Guidance. 16th Annual AEHS West Coast Conference on Soils, Sediment and Water, Oral Presentation.2006. [Google Scholar]
- Driscoll FG. Groundwater and Wells. 2nd Edition. St. Paul Minnesota: Johnson Filtration Systems; 1986. p. 67. [Google Scholar]
- Eklund BM, Simon MA. Concentration of Tetrachloroethylene in Indoor Air at a Former Dry Cleaner Facility as a Function of Subsurface Contamination: A Case Study. Journal of the Air and Waste Management Association. 2007;57:753–760. doi: 10.3155/1047-3289.57.6.753. [DOI] [PubMed] [Google Scholar]
- Fischer ML, Bentley AJ, Dunkin KA, Hodgson AT, Nazaroff WW, Sextro RG, Daisey JM. Factors Affecting Indoor Air Concentrations of Volatile Organic Compounds at a Site of Subsurface Gasoline Contamination. Environmental Science and Technology. 1996;30(10):2948–2957. [Google Scholar]
- Garbesi K, Sextro RG. Modeling and Field Evidence of Pressure-Driven Entry of Soil Gas into a House through Permeable Below-Grade Walls. Environmental Science and Technology. 1989;23(12):1481–1487. [Google Scholar]
- Jury WA, Russo D, Streile G, Abd HE. Evaluation of Volatilization by Organic Chemicals Residing Below the Soil Surface. Water Resources Research. 1990;26(1):13–20. [Google Scholar]
- Johnson PC, Ettinger RA. Heuristic Model for Predicting the Intrusion Rate of Contaminant Vapors into Buildings. Environmental Science and Technology. 1991;25(8):1445–1452. [Google Scholar]
- Johnson PC, Bruce C, Johnson RL, Kemblowski MW. In-Situ Measurement of Effective Vapor-Phase Porous Media Diffusion Coefficients. Env. Sci. Tech. 1998;32:3405–3409. [Google Scholar]
- Krylov VV, Ferguson CC. Contamination of Indoor Air by Toxic Soil Vapors: the Effects of Subfloor Ventilation and Other Protective Measures. Building and Environment. 1998;33:331–347. [Google Scholar]
- Loureiro CO, Abriola LM, Martin JE, Sextro RG. Three-Dimensional Simulation of Radon Transport into Houses with Basements under Constant Negative Pressure. Environmental Science and Technology. 1990;24:1338–1348. [Google Scholar]
- Lundegard PD, Johnson PC, Dahlen P. Oxygen Transport From the Atmosphere to Soil Gas Beneath a Slab-on-Grade Foundation Overlying Petroleum-Impacted Soil. Environmental Science and Technology. 2008;42(15):5534–5540. doi: 10.1021/es070607g. [DOI] [PubMed] [Google Scholar]
- McHugh TE, DeBlanc PC, Pokluda RJ. Indoor Air as a Source of VOC Contamination in Shallow Soils Below Buildings. Soil and Sediment Contamination. 2006;15:103–122. [Google Scholar]
- Mills WB, Liu S, Rigby MC, Brenner D. Time-Variable Simulation of Soil Vapor Intrusion into a Building with a Combined Crawl Space and Basement. Environmental Science and Technology. 2007;41:4993–5001. doi: 10.1021/es061747d. [DOI] [PubMed] [Google Scholar]
- Nazaroff WW, Lewis SR, Doyle SM, Moed BA, Nero AV. Experiments on Pollutant Transport from Soil into Residential Basements by Pressure-Driven Airflow. Environmental Science and Technology. 1987;21(5):459–466. doi: 10.1021/es00159a006. [DOI] [PubMed] [Google Scholar]
- Nazaroff WW. Predicting the Rate of 222Rn Entry from Soil into the Basement of a Dwelling Due to Pressure-Driven Air Flow. Radiation Protection Dosimetry. 1988;22(1/4):199–202. [Google Scholar]
- Parker JC. Modeling Volatile Chemical Transport, Biodecay, and Emission to Indoor Air. Ground Water Monitoring and Remediation. 2003;23:107–120. [Google Scholar]
- Pennell KG, Bozkurt O, Suuberg EM. Development and Application of a 3-D Finite Element Vapor Intrusion Model. [Accepted September 2008];Journal of the Air and Waste Management Association. doi: 10.3155/1047-3289.59.4.447. [DOI] [PMC free article] [PubMed] [Google Scholar]
- Revzan KL, Fisk WJ, Gadgil AJ. Modeling Radon Entry into Houses with Basements: Model Description and Verification. Indoor Air. 1991;2:173–189. [Google Scholar]
- Turk B, Prill R, Grimsurd DT, Moed BA, Sextro RG. Characterizing the Occurrence, Sources, and Variability of Radon in Pacific Northwest Homes. Journal of the Air Waste Management Association. 1990;40(4):498–506. doi: 10.1080/10473289.1990.10466705. [DOI] [PubMed] [Google Scholar]
- Turczynowicz L, Robinson N. A Model to Derive Soil Criteria for Benzene Migration from Soil to Dwelling Interior in Homes with Crawl Spaces. Human and Ecological Risk Assessment. 2001;7:387–415. [Google Scholar]
- Turczynowicz L, Robinson N. Exposure Assessment Modeling for Volatiles – Towards an Australian Indoor Vapor Intrusion Model. Journal of Toxicology and Environmental Health A. 2007;70:1619–1634. doi: 10.1080/15287390701434711. [DOI] [PubMed] [Google Scholar]
- Wang F, Ward IC. The Development of a Radon Entry Model for a House with a Cellar. Building and Environment. 2000;35:615–631. [Google Scholar]
- Wang F, Ward IC. Radon Entry, Migration and Reduction in Houses with Cellars. Building and Environment. 2002;37:1153–1165. [Google Scholar]
- Wertz W, Anders K. Near-Building and Sub-slab Sampling at the Endicott (NY) Site, Implications for Site Screening Approaches. 16th Annual AEHS West Coast Conference on Soils, Sediment and Water, Oral Presentation.2006. [Google Scholar]
- United States Environmental Protection Agency (USEPA) Draft Guidance for Evaluating the Vapor Intrusion to Indoor Air Pathway from Groundwater and Soils. EPA; 2002 530-D-02-004.
- United States Environmental Protection Agency (USEPA) IAQ Reference Guide: Tools for Schools. EPA; 2005 402-K-95-001.


