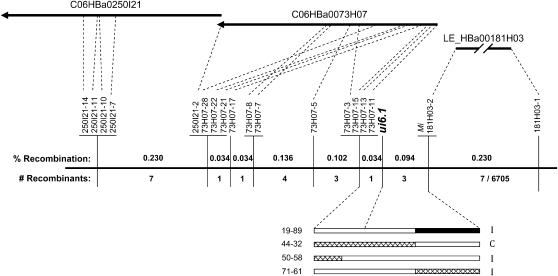
Figure 8.—
Fine-scale genetic and physical map of the ui6.1 region and phenotypes of recombinants with crossovers in the flanking intervals. The position of three BACs is shown relative to a fine-scale map of the region based on the analysis of recombinants. For each marker interval, the percentage of recombination and the number of recombinants obtained from all mapping populations are shown. Markers were derived from the S. lycopersicum BAC sequences. The genotypes of four recombinants (solid, homozygous S. pennellii; hatched, heterozygous; and open, homozygous S. lycopersicum) and their pollen phenotypes on pistils of the allotriploid (I, incompatible; C, compatible) are shown.

