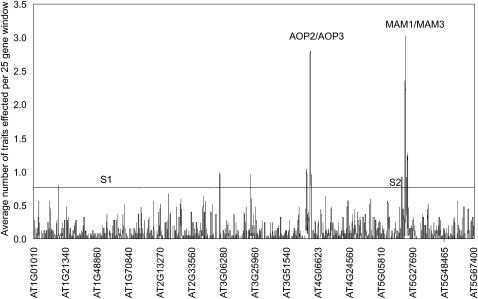
Figure 5.—
Genomic clusters of significant associations. A 25-gene sliding window analysis surveys the genomic distribution of genes associated with GSL traits. The sliding window took the average number of traits identified across every 25 genes such that if the value crosses 1, the average for that 25-gene window is that each gene is significantly associated with one GSL trait. Results for the 2007 and 2008 data sets were combined. The horizontal line represents the 95% percentile value for a 25-gene window from 1000 random bootstrap analyses that randomly shuffled gene position within the genome. The y-axis shows the order of genes on a given chromosome such that 5.1 is the position of At5g10000. “S1” and “S2” indicate the position of previously identified selective sweeps on chromosomes I and V.

