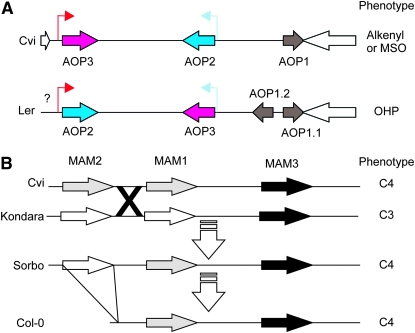
Figure 9.—
Structure of the MAM and AOP loci. (A) A diagram of AOP structure in A. thaliana accessions representing the two major haplotype classes. White arrows show the flanking genes in the reference Col-0/Cvi genome for this locus. The color shows the combination of promoters and ORF for the Cvi/Col genomic fragment: AOP2 ORF and promoter are blue while the AOP3 ORF and promoter are red. An inversion and duplication led to the generation of the Ler sequence. The question mark indicates that there is an insertion of an unknown size in this region. (B) A diagram of the GSL.Elong (MAM) region in A. thaliana accessions (Kroymann et al. 2003). Genes are shaded as most similar to Sorbo MAM1 (gray) or Sorbo MAM2 (white). The triangle from Sorbo to Col-0 indicates a large deletion and the X indicates a putative crossover between Cvi and Kondara. Predominant GSL side chain length is indicated on the right as either C3 or C4.

