Abstract
This paper presents a new algorithm for constrained intensity-modulated radiotherapy (IMRT) planning, made tractable by a dimensionality reduction using a set of plans obtained by fast, unconstrained optimizations. The main result is to reduce planning time by an order of magnitude, producing viable five field prostate IMRT plans in about 5 min. Broadly, the algorithm has three steps. First, we solve a series of independent unconstrained minimization problems based on standard penalty-based objective functions, ‘probing’ the space of reasonable beamlet intensities. Next, we apply principal component analysis (PCA) to this set of plans, revealing that the high-dimensional intensity space can be spanned by only a few basis vectors. Finally, we parameterize an IMRT plan as a linear combination of these few basis vectors, enabling the fast solution of a constrained optimization problem for the desired intensities. We describe a simple iterative process for handling the dose–volume constraints that are typically required for clinical evaluation, and demonstrate that the resulting plans meet all clinical constraints based on an approximate dose calculation algorithm.
1. Introduction
Intensity-modulated radiotherapy (IMRT) plans can precisely irradiate a target while simultaneously protecting normal tissues (Ling et al 2004, Palta et al 2004). In common clinical practice, IMRT plans are obtained by minimizing an unconstrained objective function formed as a weighted sum involving several competing clinical objectives specified by the physician. While modern algorithms can minimize such objective functions quickly, there is no guarantee that the desired constraints will be exactly satisfied for a given set of objective function parameters. This results in an iterative loop of optimization with a given set of parameters, dose calculation, planner evaluation and new parameter selection that may take an hour for a simple site such as the prostate, and upwards of 5 h for a head and neck case. A more natural formulation would be a constrained optimization problem that explicitly produces a plan satisfying all the clinical constraints; however, the number of variables in such problems is typically huge, and the optimization process is typically very slow.
This paper presents a new algorithm for constrained IMRT planning that leverages the speed and ease of unconstrained optimizations, and introduces a dimensionality reduction step that makes true constrained optimization tractable. Broadly, the algorithm has three steps. First, we solve a series of independent unconstrained minimization problems based on standard penalty-based objective functions. The resulting plans can be viewed as ‘probing’ the space of reasonable beamlet intensities (though it is unlikely that any individual plan will satisfy all the constraints). Next, we apply principal component analysis (PCA) to this set of plans, revealing that the high-dimensional intensity space can be spanned by only a few basis vectors. Finally, we parameterize an IMRT plan as a linear combination of these few basis vectors, enabling the fast solution of a constrained optimization problem for the desired intensities. We describe a simple iterative process for handling the dose–volume constraints that are typically required for clinical evaluation.
The main benefit of the proposed approach is to reduce the time to produce a viable plan in a principled manner that should extend to more difficult sites. Our results show that only about 50 unconstrained plans need to be explored in the probing phase, requiring about 5 min of computation on a standard desktop computer. The principal component analysis results in a constrained optimization problem over 20 or fewer coefficients that requires only a few seconds to solve. We present results for the prostate site here, with the expectation that the framework will be generally applicable to sites such as the head and neck where the planning process is much more time consuming. In a busy clinic, long planning times place a severe stress on available resources, and can result in treatment delays, acceptance of sub-optimal plans or—in the worst case—errors due to time pressure. Thus, reduction of planning times is an important clinical goal.
The paper is organized as follows. We first review related work in section 2. In section 3.1, we describe our mathematical formulation for unconstrained optimization in prostate IMRT planning. We focus on the clinical planning procedure applied at Memorial Sloan-Kettering Cancer Center (MSKCC). In section 3.2, we apply Monte Carlo (MC) simulation and principal component analysis (PCA) to decrease the dimensionality of the intensity space. In section 3.3, we formulate the objective function for constrained optimization in the reduced-order space, and describe our special considerations for dose–volume constraints (DVCs). Sections 4.1 and 4.2 present the results of dimensionality reduction and constrained optimization on a 36 patient dataset using approximate dose calculations. A 10 patient subset is then evaluated clinically for acceptability following full dose calculation in section 4.3. Section 5 concludes the paper with discussion and ideas for future work.
2. Related work
A widely used approach for the IMRT optimization problem is to combine all the clinical criteria specified by the physician into a scalar value using a weighted sum that reflects the relative penalty for not satisfying each criterion. Each weighted term in the scalar objective is a soft constraint, meaning that it can be violated during optimization. Such an unconstrained formulation is easy to implement and can be optimized quickly using gradient information. Newton’s methods (Wu and Mohan 2000) and conjugate gradient (CG) algorithms (Spirou and Chui 1998) are the two prevalent gradient methods for optimizing IMRT objective functions, which can be dose based (Wu and Mohan 2000, Bortfeld et al 2004), dose–volume based (Wu and Mohan 2000, Bortfeld et al 2004, Langer 1990), or biology based (Bortfeld et al 2004, Wu et al 2002). However, the result of a single unconstrained optimization is not guaranteed to satisfy the clinical criteria. Planners need to choose an appropriate set of parameters (e.g., weight factors), usually by trial and error, to represent the compromises between competing objectives. The inverse planning process of obtaining a clinically acceptable IMRT plan for a difficult site can take several hours, largely due to the manual process of adjusting the parameters in the objective function (Bedford and Webb 2003, Bortfeld et al 2004, Spirou and Chui 1998).
Explicitly formulating the criteria as constraints provides more direct control and a higher degree of ‘steerability’ of the treatment plans (Palta et al 2004). The constrained approach optimizes one criterion while keeping all others within constraints; hence, no artificial parameters are required. Researchers have reported the application of linear programming (Wu et al 2000, Rosen 1991), mixed integer programming (Lee et al 2002, Langer 1996) and simulated dynamics (Hou and Wang 2003) in radiotherapy. However, due to the fact that IMRT optimization typically involves thousands of intensity variables and constraints, these techniques require large numbers of iterations to search for feasible regions, and are too slow to be used in the clinic. Wilkens et al (2007) proposed a faster technique based on pre-emptive goal programming that followed a user-defined hierarchy for successively adding lower priority constraints; however, defining the constraint order and hierarchy for a given site and set of planning goals is a challenging task. Furthermore, dose–volume constraints (DVC) that require ‘no more than q% of the volume may exceed a dose Ddv’ are difficult to deal with in constrained optimization, since they do not specify which particular voxels should have the dose limit Ddv. Lee et al (2002) introduced binary integer variables (0 or 1) to flag violating voxels for DVCs. While this approach rigorously defines the constraint, it is extremely time consuming to solve. Hou and Wang (2003) imposed dose limits for certain voxels according to the dose distribution obtained by a previous optimization. The method was applied using a differential-equations-based approach called simulated dynamics, the extensive application of which is still to be evaluated in routine treatment planning.
A third approach to IMRT planning poses the problem as a multi-objective optimization problem, allowing the planner to choose from a family of Pareto-optimal plans (that is, plans in which no criterion can be improved without worsening the others). Monz et al (2008) described how the space of such plans could be navigated using an intuitive interface. Halabi et al (2006) showed that dose–volume constraints could be accommodated in a multi-criteria framework using a good heuristic approximation that enabled a linear programming approach. While multi-criteria optimization frameworks still require a reasonably large number of pre-computed plans to be generated on the Pareto front (each of which takes several minutes to compute), recent results indicate that the Pareto front is spanned by a relatively small number of plans (Craft and Bortfeld 2008).
One common problem in IMRT planning is the large number of degrees of freedom involved in optimization, and the reduction of this dimensionality has been addressed by several researchers. Markman et al (2002) parameterized the set of beamlet intensities using a smaller number of radial basis functions. It is unclear how to choose an appropriate set of basis functions for any given case, or how the approach would scale up to IMRT planning problems with a large number of beamlets. Carlsson et al (2006) parameterized the intensities using a few dominant eigenvectors from the Hessian matrix of the objective function. As we show below, the eigenvector decomposition of the Hessian matrix is not a highly effective tool for dimensionality reduction, and hence the quality of the resulting dose distribution may be compromised. In our own previous work (Lu et al 2007), we applied sensitivity analysis to identify key parameters of an unconstrained IMRT objective function that have a strong impact on the resultant dose distribution. We then applied an outer loop over the sensitive parameter set to find the parameters such that the minimizer of the corresponding objective function gave the best score of a scalar function of plan quality. While this method quickly produced plans that generally satisfied the clinical constraints, it still suffered from (1) using a scalar-valued objective function to approximate a fundamentally hard-constrained problem, and (2) requiring training data to identify the sensitive set, assuming a generalizable class solution for the treatment site. The algorithm described below has neither shortcoming.
3. Materials and methods
We obtained clinical five field, 86.4 Gy IMRT plans for 36 prostate cancer patients from MSKCC, all created by experienced planners; the access to these data was approved by the MSKCC Privacy Review Board. The five beam directions are shown in figure 1; this class solution was used for all the cases we analyzed. These hand-tuned clinical plans were referred to as ground truth. Our reduced-order constrained optimization used the same CT data and beam directions. All dose calculations described in this section used a truncated pencil beam calculation to reduce computation time, as we previously described in Lu et al (2007). The approximate dose calculation uses the same truncated kernel in use at MSKCC during optimization. This differs from the dose calculation used for clinical evaluation chiefly in that the long-range scattered dose is not included. While the full dose calculation was not available at RPI, an estimate of the contribution of the long-range scattered dose was derived from the ratio of the approximate dose calculation to the full doses for the intensities in the clinical plan, and this correction applied for subsequent optimizations. The approximate and full dose calculations therefore agree for the clinical intensities.
Figure 1.
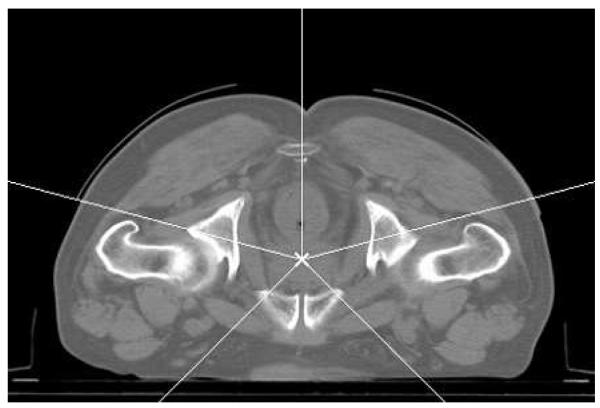
The five beam directions for the analyzed plans.
The current MSKCC clinical evaluation protocol requires that the plan satisfies the following conditions; (1) for the PTV, V95 ≥ 87% and Dmax ≤ 111%, (2) for the rectal wall, V87 ≤ 30%, V54 ≤ 53% and Dmax ≤ 99%, and (3) for the bladder wall, V54 ≤ 53%. All doses are expressed as percentage of the prescription dose, and the notation Vx means the structure volume percentage receiving at least x% of the prescription dose.
3.1. Unconstrained optimization
To ‘probe’ the space of intensities for a given patient, we initially use a quadratic dosebased objective function subject to unconstrained optimization (Spirou and Chui 1998, Ling et al 2004). For the kth target, the corresponding objective function term is
| (1) |
where Nk is the number of points in the target, and Di is the dose to the ith point in the target. Dpresk is the prescription dose, and Dmink and Dmaxk are the minimum and maximum dose allowed without penalty. wmink and wmaxk are the penalties (weights) for under- and over-dosing, and Θ (x) is the Heaviside function. The choice of the parameter set Pk = {Dpresk, Dmink, Dmaxk, wmink, wmaxk} completely specifies the objective function for target k. A similar objective function term is defined for each organ at risk (OAR), which also includes parameters Ddvk and wdvk that define the dose–volume-histogram (DVH) constraints:
| (2) |
where the sum in the second term is carried out over the lowest Ndvk doses that are greater than Ddvk, and Ndvk is the minimum number of point dose changes required to bring the kth organ into compliance with the DVH constraint (Spirou and Chui 1998).
The overall unconstrained intensity optimization problem is thus formulated as
| (3) |
where P = {Pj, j = 1,…, Ntarget, Pk, k = 1, …, NOAR} is the set of about 20 dose limits and weights for all the optimization structures that defines the objective function3. The optimized dose distribution uses a linear model:
| (4) |
where Aij is the dose coefficient from the jth beamlet to the ith voxel.
Given a fixed set of parameters P, the CG algorithm can effectively optimize (3) by utilizing gradient information. For the objective function specified in (1), the derivative of F with respect to the jth beamlet Ij is
| (5) |
where .
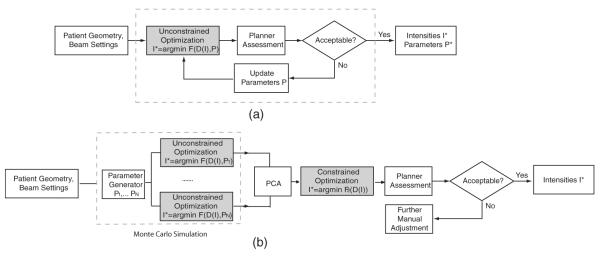
Using the CG algorithm, the unconstrained optimization usually converges in 5 s on a Pentium 4 2.66 GHz, 4 GB RAM PC. However, as described in section 2, the optimized dose distribution does not necessarily satisfy the clinical criteria. The parameters P have to be carefully chosen, usually by trial and error, since they are inherently imprecise and un-intuitive. Figure 2(a) illustrates the typical clinical planning process using unconstrained optimization. Automatic methods of parameter selection have been proposed in Xing et al (1999), Lu et al (2007). The problem is that the optimized dose distribution D* in (3) and (4)is not differentiable with respect to P; thus, stochastic algorithms are usually used for parameter optimization, which are relatively inefficient in terms of speed.
Figure 2.
Clinical planning and our proposed method. (a) In the clinic, a planner manually adjusts a set of patient-specific parameters P defining an unconstrained cost function F, and optimizes F using an automatic algorithm (shaded box). (b) Our approach consists of three steps: Monte Carlo simulation, principal component analysis and constrained optimization. Monte Carlo simulation generates multiple samples of parameters P1, …, Pn for an unconstrained cost function F. The resulting optimized intensities lie in the space of possible solutions. Using PCA, we identify a reduced space, which is subsequently explored by constrained optimization (no parameters involved) for the final solution.
In our new approach, the parameter-based unconstrained optimization is used for constructing an intensity space that contains possible solutions, as illustrated in figure 2(b). We then apply PCA to find the true embedding of solutions in this space, i.e., to decrease its dimensionality. The final solution is obtained by constrained optimization, which is computationally feasible when searching in the reduced space.
3.2. Dimension reduction in the optimized intensity space
In current clinical practice, after several trial-and-error guesses, the planner reaches a set of parameters such that optimizing the corresponding unconstrained cost function results in a clinically acceptable plan. Here, we are interested in the effect of changing P on the resulting optimized intensity I* in (3). Intuitively, the number of degrees of freedom for I* should be much less than the total number of beamlets.
After minimizing using a fixed parameter setting Pi, we stack the resulting intensities from all the beamlets into a column vector Ii. Given N optimized intensity distributions {I1, I2, …, IN} resulting from different combinations of P, the dimensionality of the intensity space can be reduced by linear or nonlinear feature extraction methods. Here, we use principal component analysis (PCA) (Shawe-Taylor 2004) for the reduced-order approximation. Mathematically, PCA is an orthogonal linear transformation that maps the data to a new coordinate system, such that the dimension with the kth greatest variance is oriented to lie on the kth coordinate (i.e., the kth principal component). The projection directions are obtained from the eigenvalue decomposition of the covariance matrix defined by C = IIT, where I [I1 I2 … IN]; that is
| (6) |
.
If we normalize the eigenvectors to have unit length and project I into a subspace UK spanned by the first K eigenvectors v1, …, vK, the variance of the projection can be shown to satisfy
| (7) |
Since the total variance in the data is ΣNi=1 λi, we can then choose the K eigenvectors that capture a desired percentage T of the total variation:
| (8) |
The linear transformation that projects the M-dimensional Ii into the K-dimensional subspace UK is simply
| (9) |
where V = [v1 v2 … vK], and ξi contains the transformed coordinates.
We note that although traditional PCA approaches usually center the data to have zero mean before analysis, the derivation above does not necessarily require centering (Shawe-Taylor 2004). We directly apply PCA to the un-centered data, so that the mapping between two spaces in (9) is exactly linear, without any translation.
To generate the set of N optimized intensity distributions for PCA, we use Monte Carlo simulation based on random sampling. First, we determined the natural range of parameters P in (3) from the values observed over the database of 36 plans. Then, N sets of parameters from this range are generated by Latin hypercube sampling, which is a particular case of stratified sampling that achieves a better coverage of the space of input parameters (Saltelli et al 2004). The selection of N is discussed in section 4.2. For each set of parameters, we minimize the corresponding IMRT cost function (3) using the CG algorithm. The resulting intensity profiles are grouped together and reduced in dimensionality using PCA.
Related dimensionality reduction methods to our approach have been proposed recently. Alber et al (2002) studied the second-order properties of the unconstrained objective function F. The Hessian matrix H is defined as
| (10) |
where I* is the optimized intensity, and Ii refers to the ith beamlet. The IMRT degeneracy problem (i.e., the phenomenon that different intensity distributions can lead to nearly identical dose statistics) is related to the small eigenvalues of H. Also, the eigenvectors for the large eigenvalues span the subspace of I where F(I) changes rapidly, which corresponds to difficult trade-offs between targets and OARs. Carlsson et al (2006) further parameterized the intensities I by a few dominant eigenvectors from the Hessian, i.e., I = Vp ξ, which is the to (5), the same as (9) except that Vp contains p dominant eigenvectors from H. According Hessian in (10) can be written in the matrix form:
| (11) |
which depends on the dose coefficients Aij, the current dose distribution Di and the parameter settings (wmin, wmax, etc). Hence, the lengthy Monte Carlo simulation is avoided, but the Hessian may vary as the unconstrained optimization proceeds or the parameters are altered. Due to the difficulty in computing the volatile D, both papers suggest a simplification that only considers the eigenvectors from AT A, the covariance of the dose coefficient matrix. We will compare our approach to these alternatives in section 4.1.
3.3. Constrained optimization in the reduced space
Given the reduced space that captures the effective degrees of freedom in the intensity variables, our next task is to find a clinically acceptable solution. A natural formulation is to minimize the deviations from the prescription dose in the target (PTV), while keeping other dose statistics within the constraints specified by the clinical criteria. Without dose–volume constraints, the constrained optimization is defined as
| (12) |
subject to
| (13) |
| (14) |
| (15) |
where the minimization is taken over the K-d coordinates in the reduced space: ξ1, ξ2, …, ξK. T, O and B are the sets of target voxels, OAR voxels and original N-d beamlet intensity variables, respectively. Constraint (15) specifies that the back-projected intensities in the original space should be non-negative.
To accommodate the dose–volume constraints, e.g., V87 ≤ 30% and V54 ≤ 53% for the rectal wall, we use a similar idea proposed by Hou and Wang (2003) for simulated dynamics, i.e., we iteratively perform constrained optimization with different dose limits. The DVC that V87 ≤ 30% can be enforced by applying hard constraints at 87% of the prescription dose on a set of voxels that make up 70% of the structure. Initially, we have no idea about which particular voxels should be limited to 87%, and the first run of optimization is free of DVCs. We then determine a particular voxel set by sorting the optimized dose distribution. The DVC is imposed as a hard constraint on the coldest 70% volume of voxels, and the second optimization proceeds. An underlying assumption is that the relative low-to-high dose ordering does not change substantially between two runs of optimization. This procedure is described in algorithm 1 for an OAR with a maximum dose limit and several DVCs.
To solve the constrained problem, we use the commercial solver CPLEX, well suited for large-scale implementations of linear programming algorithms.
Algorithm 1. Imposing a set of dose–volume constraints
Input: maximum dose Dmax for OAR, dose–volume constraints VD1 ≤ V1%, …, VDm ≤ Vm%. Di and Vi are sorted so that D1 ≥ ⋯… ≥ Dm, V1 ⋯… ≤ Vm.
Process: in the first iteration, set the dose limit for each OAR voxel to Dmax.
   repeat
     Solve the constrained problem.
     Calculate and sort the doses in descending order.
     if dose–volume constraints are already satisfied then
         break;
     else
         Update the dose limit for each voxel according to the dose–volume constraints.
	 Dmax is assigned to the voxels currently in the volume percentage of 0–V1% (i.e.,
	 the hottest voxels), D1 to the voxels currently in V1–V2%, and so on.
     end if
 until between two iterations, the intensities or dose limits stay unchanged or differ by a
 small amount.
4. Results
4.1. Dimensionality reduction
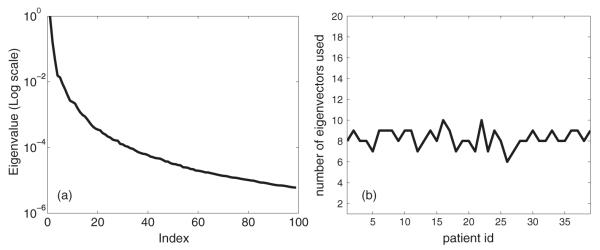
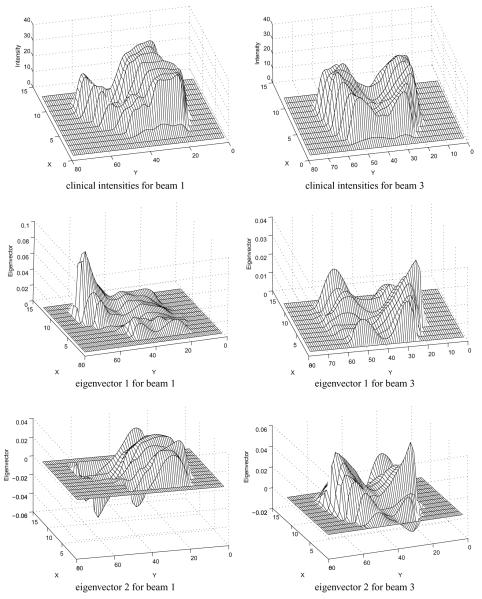
For each patient, we first randomly generated N = 500 parameter combinations as described above, minimized the corresponding unconstrained cost function and obtained the value of the intensity variables. Figure 3(a) shows the eigenvalue distribution for patient 1 after applying PCA to the combined intensity space. The first eigenvalue is omitted since it mainly relates to the sample average in un-centered PCA. The remaining eigenvalues are normalized by the maximum eigenvalue and visualized in the log scale. We can see that only a few (< 20) eigenvalues were well distinguished (with a relative value greater than 0.1%) in the spectrum, indicating that the number of degrees of freedom was much less than the number of samples. Figure 4 visualizes the eigenvectors corresponding to the two greatest eigenvalues, as well as the clinical intensity distributions. We note that these principal eigenvectors are qualitatively different from those generated by Alber et al since in our case the entire plan is built up from combinations of these modes, while in Alber et al (2002), the eigenvectors represented changes from a nominal plan and could be more easily visually identified with aspects of target–OAR competition.
Figure 3.
(a) The normalized eigenvalue distribution for patient 1, in the log scale. (b) The number of eigenvectors required to capture the major variance (≥ 99%).
Figure 4.
The clinical intensities and eigenvectors belonging to the two largest eigenvalues. Only beams 1 and 3 are visualized.
Next, for each patient we selected the number of eigenvectors so that over 99% of the variance is captured:
| (16) |
Figure 3(b) illustrates the result for all 36 patients. Generally, 7–10 principal components were required to describe most of the variance. Therefore, in the following section, we safely used a 20-dimensional space for constrained optimization. We note that while this paper was being prepared for publication, Craft and Bortfeld (2008) made a similar observation—i.e., that viable intensities lie in a relatively low-dimensional subspace.
To compare our approach with other dimensionality reduction techniques in the literature, we minimized the unconstrained cost functions with two sets of parameters: the default setting defined in the protocol template and the clinical setting after trial-and-error adjustment. Using (10), two different Hessians were computed from the optimized dose distributions. A third simplified Hessian was computed as AT A, i.e., it only depended on the interactions between the beams and the patient’s geometry. For each patient, we applied the PCA approach to each of these matrices, as well as the Monte Carlo covariance matrix that forms the basis for our algorithm. After eigenvalue decomposition, the K dominant eigenvectors were used to span a reduced space UK. We projected each clinical intensity vector I into the different spaces, and measured the quality of approximation in terms of the projection residual:
| (17) |
where Dim(I refers to the dimensionality of I.
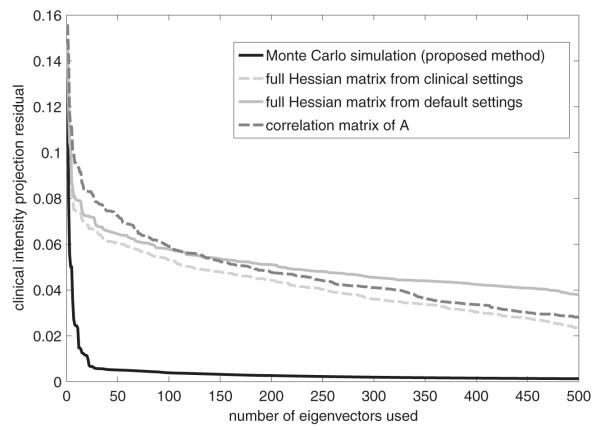
Figure 5 compares the projection residuals for the four dimensionality reduction methods. In all cases, as we include more eigenvectors in UK, the projection becomes more similar to the original intensity vector. Using Monte Carlo simulation and PCA, the projection residual decreased much faster and to a much smaller level than any of the other approaches, indicating that our method is most effective for dimensionality reduction. Comparing the two Hessians with different parameter settings, we found that the eigenvectors from the ‘clinical Hessian’ seem better suited to reconstructing intensities that meet the clinical constraints, indicating the importance of parameter selection for Hessian-based methods. The simplified Hessian (AT A) has interesting properties. For the first 100 eigenvectors it behaved the worst, but the performance gradually approached that of the ‘clinical Hessian’ as more modes were included. It appears to be a fair alternative method for dimensionality reduction, since neither Monte Carlo simulation nor parameter selection is required. However, a much larger number of eigenvectors would be required for acceptable performance, compared to the Monte Carlo approach.
Figure 5.
Comparison of the four dimensionality reduction methods based on projection residual.
4.2. Constrained optimization
Considering that all the clinical plans at MSKCC are obtained through minimization of (3) with a suitable parameter set, we can reasonably assume that sampling the intensity space obtained from unconstrained optimization provides a good basis for the search for a clinically acceptable solution. The constrained optimization drives the solution toward the protocol goals, while the search space for intensities has a very limited number of degrees of freedom due to the reduced-dimensional PCA. We note that the intensities from constrained optimization might not coincide with those from the clinical plans (e.g., due to IMRT degeneracies). For the purpose of the experiment, we assume that the quality of the plan is defined entirely by the degree to which the clinical constraints are satisfied.
In the first part of this experiment, we generated 100 samples from Monte Carlo simulation, and approximated the intensity space using 20 eigenvectors. For a typical prostate case and a Dell PC workstation (Pentium 4 2.66G, 4G RAM), the constrained optimization converged in 15 s on average, after 5 min spent in dimensionality reduction.
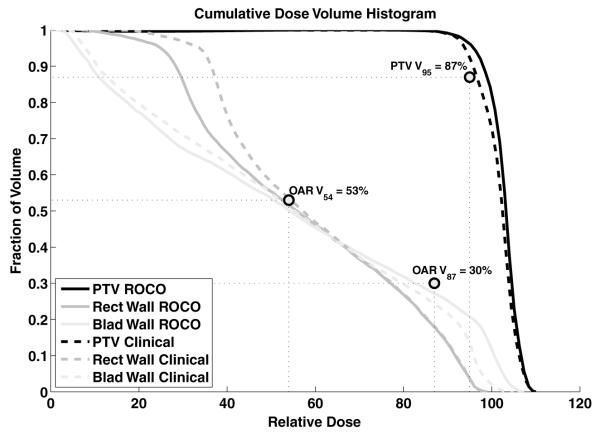
Figure 6 shows dose–volume histograms resulting from both the clinical and proposed reduced-order constrained optimization for patient 15, for whom we had full dose calculations for both methods. We show DVHs for the three constrained structures—the PTV, rectal wall and bladder wall, together with the six DVH evaluation points that determine the constraints applied through (13) and (14). All six constraints—V95 and Dmax for the PTV, Dmax, V87 and V54 for the rectal wall, and V54 for the bladder wall—are met.
Figure 6.
Comparison of dose–volume histograms for the clinical plan and the plan from constrained optimization, both for patient 15.
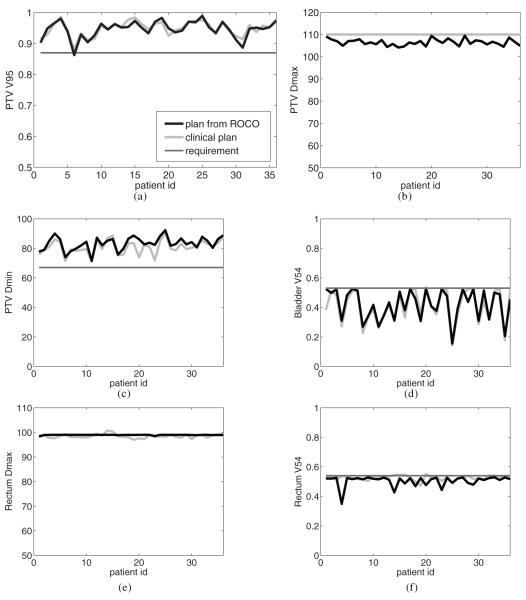
Figure 7 summarizes the results for all 36 patients based on these evaluation points as well as the PTV minimum dose. The corresponding results of the clinical planning process are also plotted. These plan statistics were all computed using the approximate dose calculation method described in Lu et al (2007) that was used throughout the algorithm. Note that the planner almost always normalizes the clinical plan so that the PTV Dmax is 110%. Compared to the clinical plans, the constrained optimization significantly decreased DPTVmax while keeping a slightly higher DPTVmin; that is, PTV homogeneity was improved by our method. Across all the patients, the mean value of DPTVmax decreased from 110 (clinical) to 106.5, and the mean value of DPTVmin increased from 80.9 to 83.3. The overall statistics of PTV coverage (i.e., VPTV95) in both cases were similar (94.4 and 94.8, respectively). For OAR protection, an interesting result is that our method pushed Drectwallmax to the exact protocol limit of 99, while human planners usually normalize the plan to approximately achieve this goal. This observation shows the power of constrained optimization: the plan’s outcome is directly related to the choice of clinical criteria. As discussed in section 3.3, we maximize the PTV coverage while keeping the OAR doses under constraints. After optimization, certain OAR constraints are fully active, so that the PTV doses can reach far beyond the clinical goals. If the roles of PTV and OAR were reversed in the problem formulation, we would expect VPTV95 and DPTVmin to be straight lines around the clinical limits. We also observe that the dose–volume constraints, e.g., Vrectwall54 and Vbladwall54, can be effectively imposed by algorithm 1. The Vrectwall54 was pushed to the limits of 53% in 30 out of 36 cases, and the remaining 6 had low rectum doses without compromising the PTV coverage.
Figure 7.
Comparisons of dose evaluation statistics for the clinical plans and the plans from constrained optimization (ROCO). (a) VPTV95. (b) DPTVmax. (c) DPTVmin. (d) Dbladwall54. Drectwallmax.
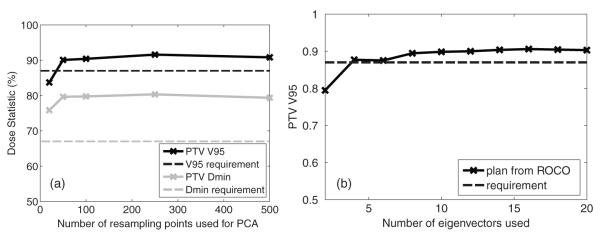
The second part of this experiment varied the number of samples used for Monte Carlo simulation, and the number of eigenvectors used in optimization. Since most of the computational time is spent in repeated runs of unconstrained optimization, whether a large number of samples is required or not becomes critical in evaluating our approach. Figure 8(a) compares VPTV95 and DPTVmin resulting from constrained optimization using different numbers of samples. For patient 1, we took 20, 50, 100, 250 and 500 samples, respectively. With 20 samples, VPTV95 failed to meet the clinical requirement. However, starting from the next level (50), the two PTV constraints were fully satisfied, and the optimization did not benefit significantly by increasing the number of samples. This indicates the value of our approach: only a very limited number of runs of unconstrained optimization is required to extract the search space. Another issue is how the dimensionality of the search space affects the constrained optimization. Figure 8(b) compares VPTV95 using different numbers of eigenvectors. The PTV coverage generally increased as more degrees of freedom were allowed, and the improvement became insignificant after K = 10, which corresponds to the previous observation that 7–10 eigenvectors were enough to describe most of the variance. In our experiments, we used K = 20 since no additional increase of computational cost was observed.
Figure 8.
(a) Comparison of optimized VPTV95 and DPTVmin using different numbers of samples from Monte Carlo simulation. (b) Comparison of optimized VPTV95 using different numbers of eigenvectors.
4.3. Clinical validation
The constrained optimization described here delivers plans that meet clinical constraints as precisely as possible according to the dose calculation algorithm used within the optimization. To evaluate the efficacy of the optimization using a different dose calculation method is in principle inconsistent. While our constrained optimization and the steps (sections 3.1 and 3.2) that determine the input PCA modes employ an approximate dose calculation method (Lu et al 2007), clinical plans at MSKCC are assessed using the more accurate in-house dose calculation algorithm that fully accounts for scatter.
There are two other differences between our automated optimization and the plannerdriven methods that produce the ground-truth clinical plans. First, in determining whether a plan is clinically acceptable, the planner or physician may apply unstated constraints; for example, they may reject a plan with a hot spot in unspecified normal tissue. Additionally, even without such manual supervision, the unconstrained optimization based on (1)–(3) combined with the class solution beam directions may naturally meet the tolerance limits for a particular normal tissue, making it unnecessary for (2) to include a term for that tissue in almost all situations. However, it is important to check that our automated planning methods do not violate clinical requirements that are either unstated or normally satisfied during ‘manual’ planning.
To examine this possibility, the incident beam intensity was calculated using the fluence matrices generated by the automated method, and the resulting patient dose distribution was calculated with the full dose calculation and reviewed by an expert treatment planner. This experiment was performed for 10 of the 36 plans described above. After the first four patients, we found that two constraints used for plan evaluation but not explicitly stated in the clinical optimization guidelines were violated: that the maximum femoral head dose be less than 68 Gy and that the mean PTV dose be greater than 100%. The femoral head maximum dose was exceeded in three cases and the mean PTV dose requirement was violated in all of them. In manual planning with unconstrained, weight-based optimization, the maximum femur dose is almost always satisfied without including an OAR term for the femurs in the score function. The constrained optimization including constraints on the maximum femur dose and mean PTV dose was performed for these and an additional six patients. The dose distributions determined with the approximate dose calculation algorithm satisfied the new as well as the original constraints. Upon applying the full dose calculation with new fluence matrices, five cases were found to be acceptable, while violations by 0.5–1.5% of one or two clinical evaluation criteria were found for the other five patients. We attribute these problems to the differences in dose calculation algorithms.
5. Discussion and conclusions
In this paper, we combined the advantages of two different optimization approaches to find a clinically acceptable solution for prostate IMRT. Fast unconstrained optimizations are used to probe a small number of samples in the parameter space. By applying PCA, the low number of degrees of freedom in the parameters is converted into a low number of degrees of freedom in the intensities, and the latter are much easier to deal with when solving the constrained problem. The constrained optimization enables the planner to directly control the dose limits and dose–volume constraints, and becomes computationally feasible in the reduced intensity space. The impact is that a true constrained optimization problem over the intensity values can be solved very quickly—in about 15 s—after spending about 5 min per patient in the ‘probing’ phase. We believe that the methodology can be straightforwardly applied to other sites and has high potential for making constrained optimization a viable clinical planning tool.
Our experiments have shown that the principal eigenvectors spanning the space of feasible plans cannot be directly predicted for a given patient’s geometry; therefore, Monte Carlo simulation and PCA must be applied for every patient. This does not necessarily weaken our approach: only a very limited number of samples are required, and the computational cost is minor compared to hours of manual adjustment. We note that the number of samples we use to construct the space is generally small enough that it is unlikely that the ‘best’ sample will fulfill the clinical constraints and provide an immediate solution. However, we showed that these Monte Carlo samples do a good job of constructing a space that can be effectively explored by constrained optimization. If the constrained optimization cannot arrive at a feasible solution for a given patient, there may be no alternative but to tune some of the constraint parameters to obtain a clinically acceptable plan. However, this adjustment is much simpler and faster than the typical adjustment in unconstrained optimization, since only dose limits and not importance factors need to be investigated, and the constrained optimization algorithm itself is very fast given the PCA modes.
We wish to stress that additional constraints, over and above those used at present in weight-based optimization, may be necessary. Our experience with the femoral head maximum doses indicates that the constrained and weight-based optimizations distribute dose differently. One cannot assume that a normal tissue limit that is ‘accidentally’ satisfied without requiring an explicit term in the objective function for weight-based optimization will be similarly satisfied by constrained optimization. Ultimately, the planner should try to encapsulate measures of clinical acceptability as explicit dose or dose–volume constraints whenever possible. A further area of future work is to investigate and improve the character of the dose distributions produced by the proposed method. Figure 6 reveals that the constrained optimization makes different trade-offs about dose—especially for the OARs—than a human planner would, although both plans satisfy the clinical constraint points on the DVH curves and would be acceptable by the physician. It may be necessary to impose additional DVH constraints as reliable complications models that cover the whole DVH become available.
When using constrained optimization, it is important to use the same method of dose calculation for both optimization and evaluation, as the full scatter dose can contribute several percent to a small, centrally located structure such as the urethra. Further work is needed to determine if a full dose calculation is needed at the level of the Monte Carlo sampling procedure, where it would have strong implications for speed, or only at the point of constrained optimization in the reduced parameter space. If it is only required at the optimization phase, it might be possible to employ a two-loop strategy such as that described by Lu et al (2007) to reduce optimization time.
A key advantage of the proposed approach (e.g., in contrast to our previous work Lu et al (2007)) is that no training data are required, and that the space of probed plans is customized to a given patient. We are hopeful that this approach will produce greater clinical impact in sites that are more difficult to plan than the prostate (such as head and neck cancers) due to non-standard beam arrangements and highly variable target/OAR shapes and positions.
Acknowledgments
This work was supported by the National Cancer Institute under grant 5P01CA59017-13, and CenSSIS, the NSF Center for Subsurface Sensing and Imaging Systems, under the award EEC-9986821.
Footnotes
We note that in this phase of the algorithm and the PCA analysis discussed in section 3.2, we use expanded PTV and rectal wall structures that are slightly larger than the corresponding anatomical structures. These ‘dummy’ structures are used by MSKCC planners to guide their particular optimization algorithm to a more clinically desirable solution. The main constrained optimization problem discussed in section 3.3, and evaluation of the resulting plans are computed based on dose to the true PTV and rectal wall.
References
- Alber M, Meedt G, Nüusslin F. On the degeneracy of the IMRT optimization problem. Med. Phys. 2002;29:2584–9. doi: 10.1118/1.1500402. [DOI] [PubMed] [Google Scholar]
- Bedford JL, Webb S. Elimination of importance factors for clinically accurate selection of beam orientations, beam weights, and wedge angles in conformal radiation therapy. Med. Phys. 2003;30:1788–804. doi: 10.1118/1.1582471. [DOI] [PubMed] [Google Scholar]
- Bortfeld T, Kufer K-H, Monz M, Trofimov A, Niemierko A. Problems with current IMRT prescription practices and planning systems (abstract) Med. Phys. 2004;31:1761. [Google Scholar]
- Carlsson F, Forsgren A, Rehbinder H, Eriksson K. Using eigenstructure of the Hessian to reduce the dimension of the intensity modulated radiation. Ann. Oper. Res. 2006;148:81–94. [Google Scholar]
- Craft D, Bortfeld T. How many plans are needed in an IMRT multi-objective plan database? Phys. Med. Biol. 2008;53:2785–96. doi: 10.1088/0031-9155/53/11/002. [DOI] [PubMed] [Google Scholar]
- Halabi T, Craft D, Bortfeld T. Dose volume objectives in multi-criteria optimization. Phys. Med. Biol. 2006;51:3809–18. doi: 10.1088/0031-9155/51/15/014. [DOI] [PubMed] [Google Scholar]
- Hou Q, Wang J. An optimization algorithm for intensity modulated radiotherapy, the simulated dynamics with dose volume constraints. Med. Phys. 2003;30:61–8. doi: 10.1118/1.1528179. [DOI] [PubMed] [Google Scholar]
- Langer M. Large-scale optimization of beam weights under dosevolume restrictions. Int. J. Radiat. Oncol. Biol. Phys. 1990;18:887–93. doi: 10.1016/0360-3016(90)90413-e. [DOI] [PubMed] [Google Scholar]
- Langer M. Comparison of mixed integer programming and fast simulated annealing for optimizing beam weights in radiation therapy. Med. Phys. 1996;23:957–64. doi: 10.1118/1.597857. [DOI] [PubMed] [Google Scholar]
- Lee E, Fox T, Crocker I. Integer programming applied to intensity-modulated radiation therapy treatment planning. Ann. Oper. Res. 2002;119:165–81. [Google Scholar]
- Ling CC, et al. A Practical Guide to Intensity-Modulated Radiation Therapy. Medical Physics Publishing; Madison, WI: 2004. [Google Scholar]
- Lu R, Radke R, Happersett L, Yang J, Chui C, Yorke E, Jackson A. Reduced-order parameter optimization for simplifying prostate IMRT planning. Phys. Med. Biol. 2007;52:849–70. doi: 10.1088/0031-9155/52/3/022. [DOI] [PubMed] [Google Scholar]
- Markman J, Low DA, Beavis AW, Deasy JO. Beyond bixels: generalizing the optimization parameters for intensity modulated radiation therapy. Med. Phys. 2002;29:2298–304. doi: 10.1118/1.1508799. [DOI] [PubMed] [Google Scholar]
- Monz M, Küfer K, Bortfeld T, Thieke C. Pareto navigation—algorithmic foundation of interactive multi-criteria IMRT planning. Phys. Med. Biol. 2008;53:985–98. doi: 10.1088/0031-9155/53/4/011. [DOI] [PubMed] [Google Scholar]
- Palta JR, et al. Intensity-Modulated Radiation Therapy: The State of the Art. Medical Physics Publishing; Madison, WI: 2004. [Google Scholar]
- Rosen II. Treatment plan optimization using linear programming. Med. Phys. 1991;18:141–52. doi: 10.1118/1.596700. [DOI] [PubMed] [Google Scholar]
- Saltelli A, Tarantola S, Campolongo F, Ratto M. Scientific Models. Wiley; New York: 2004. Sensitivity Analysis in Practice: A Guide to Assessing. [Google Scholar]
- Shawe-Taylor J. Kernel Methods for Pattern Analysis. Cambridge University Press; Cambridge: 2004. [Google Scholar]
- Spirou S, Chui C. A gradient inverse planning algorithm with dose–volume constraints. Med. Phys. 1998;25:321–33. doi: 10.1118/1.598202. [DOI] [PubMed] [Google Scholar]
- Wilkens JJ, Alaly JR, Zakarian K, Thorstad WL, Deasy JO. IMRT treatment planning based on prioritizing prescription goals. Phys. Med. Biol. 2007;52:1675–92. doi: 10.1088/0031-9155/52/6/009. [DOI] [PubMed] [Google Scholar]
- Wu QW, Mohan R. Algorithms and functionality of an intensity modulated radiotherapy optimization system. Med. Phys. 2000;27(701):226–11. doi: 10.1118/1.598932. [DOI] [PubMed] [Google Scholar]
- Wu Q, Mohan R, Niemierko A, Schmidt-Ullrich R. Optimization of intensity-modulated radiotherapy plans based on the equivalent uniform dose. Int. J. Radiat. Oncol. Biol. Phys. 2002;52:224–35. doi: 10.1016/s0360-3016(01)02585-8. [DOI] [PubMed] [Google Scholar]
- Wu XG, Zhu YP, Luo LM. Linear programming based on neural networks for radiotherapy treatment planning. Phys. Med. Biol. 2000;45:719–28. doi: 10.1088/0031-9155/45/3/310. [DOI] [PubMed] [Google Scholar]
- Xing L, Li J, Donaldson S, Le Q, Boyer A. Optimization of importance factors in inverse planning. Phys. Med. Biol. 1999;44:2525–36. doi: 10.1088/0031-9155/44/10/311. [DOI] [PubMed] [Google Scholar]


