

Abstract
Purpose
Model evaluation is an important issue in population analyses. We aimed to perform a systematic review of all population PK and/or PD analyses published between 2002 and 2004 to survey the current methods used to evaluate a model and to assess whether those models were adequately evaluated.
Methods
We selected 324 papers in MEDLINE using defined keywords and built a data abstraction form (DAF) composed of a checklist of items to extract the relevant information from these articles with respect to model evaluation. In the DAF, evaluation methods were divided into 3 subsections: basic internal methods (goodness-of-fit plots [GOF], uncertainty in parameter estimates and model sensitivity), advanced internal methods (data splitting, resampling techniques and Monte Carlo simulations) and external model evaluation.
Results
Basic internal evaluation was the most frequently described method in the reports: 65% of the models involved GOF evaluation. Standard errors or confidence intervals were reported for 50% of fixed effects but only 22% of random effects. Advanced internal methods were used in approximately 25% of models: data splitting was more often used than bootstrap and cross-validation; simulations were used in 6% of models to evaluate models by visual predictive check or by posterior predictive check. External evaluation was performed in only 7% of models.
Conclusions
Using the subjective synthesis of model evaluation for each paper, we judged models to be adequately evaluated in 28% of PK models and 26% of PD models. Basic internal evaluation was preferred to more advanced methods, probably because the former are performed easily with most software. We also noticed that when the aim of modelling was predictive, advanced internal methods or more stringent methods were more often used.
Keywords: Animals; Databases, Factual; Humans; Models, Statistical; Monte Carlo Method; Pharmacokinetics; Population
INTRODUCTION
Population pharmacokinetic (PK) and/or pharmacodynamic (PD) analyses are increasingly used in drug development to analyze dose-concentration-effects relations in clinical studies (1–3), to help identify differences in drug safety, efficacy, and pharmacokinetics among population subgroups, and to simulate clinical trials (4–8). Population approaches require only a few measurements per patient and allow for quantification of inter- and intra-individual variabilities, with the possibility of identifying clinically relevant covariates for inter-individual variability.
Population analyses rely on the use of non-linear mixed effect models. In view of the complex statistical methodology involved in the use of such models and the key role of population analyses for drug development, model evaluation is an important issue.
Model evaluation has been called by different terms such as model evaluation, validation, qualification, adequacy, assessment, checking, appropriateness and performance. In 1997, Mentré and Ebelin (9) defined model validation in population pharmacokinetics as the assessment of the predictability of the model. The same definition is used in the guidance on Population Pharmacokinetics of the Food and Drugs Administration (FDA) published in 1999 (10), in which there is a section devoted to model validation. In 2001, Yano, Beal and Sheiner gave their definition of model evaluation: “The goal of model evaluation is objective assessment of the predictive ability of a model for domain-specific quantities of interest, or to determine whether the model deficiencies (the final model is never the ‘true model’) have a noticeable effect in substantive inferences.” (11). Therefore, model evaluation depends on the objective of the analysis i.e. PK and/or PD models can be used to summarize data (descriptive approach) or to predict trial outcomes (predictive approach). A descriptive model may be used for interpolation purposes within the range of observed values, while a predictive model may be used for simulation clinical trials as it allows interpolation and extrapolation. In the guideline of the European Agency for the Evaluation of Medicinal products (EMEA) on reporting the results of population pharmacokinetic analyses (2006), it is stated that model evaluation procedures should be presented to demonstrate that the final model is a sufficiently good description of the data so that the goal(s) of the analysis can be met (12, 13). When a model is used to simulate clinical trial, the methods applied for model evaluation must show that this model can allow reasonable extrapolation beyond the observed outcome range. In contrast, more simple evaluation methods can be used for a model that is developped to explain variability with no dosage adjustement recommendation.
Two general approaches can be used to evaluate a population model. The first is internal evaluation, which involves basic or more advanced methods such as data splitting and/or resampling techniques (14). The second is external evaluation, which requires the availability of an external study (referred to as “validation dataset”) to evaluate the model. External evaluation consists of a comparison between the validation dataset and the predictions obtained by applying the model built on the learning dataset.
(déjà dit plus haut, on se répète). Je propose”Although regulatory authorities stress the need for model evaluation (10, 12, 13)”,, no consensus exists to date on a general approach to evaluate a model for population PK or PD analyses, and the FDA even encourages some new approaches to evaluation.
The objectives of the present study were thus to perform a systematic review of published population analyses to survey the different methods currently used to evaluate a PK and/or PD model and assess whether those models were adequately evaluated. This review was done on a large number of articles reporting population PK and/or PD analyses and published between 2002 and 2004 (n=324).
The present paper describes the process of article selection from MEDLINE, the building of the data abstraction form (which corresponds to a checklist of items used to extract the relevant information from the articles) and finally the results of the review related to model evaluation.
METHODS
Search strategy
We searched MEDLINE (Pubmed) on April 2005 for all population PK, PK/PD, or PD studies published from 2002 to 2004 by using appropriate keywords (provided in the appendix). The search was additionally limited to “English language” and “human data”. Then based on the abstract, or if necessary, on the full article, papers were further limited to those dealing with medications or analyses performed on original clinical data. Reviews and methodology articles were excluded.
Data abstraction form building
The methodology used for building the data abstraction form (DAF) was based on the work of Boutron et al (15), who published several systematic reviews using a checklist of items. The DAF was constructed around a single statistical unit defined as a PK, PD or PK-PD model, rather than the paper itself. The rational was based on the fact that our work mainly focused on describing the quality of published models and techniques used to qualify them, rather than on the quality of published papers.
Several meetings between the 9 co-authors of the paper (who are PK/PD modelers with different backgrounds) were required to establish the DAF. A draft was then tested by the report readers, KB and CD, who used a distinct set of 20 articles selected following the criteria defined above and published before 2002 or after 2004. The articles were examined by both readers, which assisted them in agreeing on the interpretation of different questions and resolving differences in answers. The final version of the DAF used to extract the data is available at: http://www.bichat.inserm.fr/equipes/Emi0357/mentre.html
The DAF was implemented in HTML and PHP languages. PhpMyAdmin (version 2.5.3) software was used, which is a tool written in PHP intended to handle the administration of a Mysql database server. In this way, it was possible to enter interactively the items in the DAF while reading the papers through a clear and easily usable local web interface. Then, at the end of reading, answers were directly transmitted to the Mysql database. All coding was defined in the PHP script. The selected articles were randomly assigned by year of publication to the 2 readers, who then reviewed them with use of the interactive DAF.
The DAF was divided into three different sections in relation with the three types of model evaluation that can be performed: basic internal evaluation, advanced internal evaluation and external evaluation.
Basic internal evaluation
For basic internal evaluation, we examined whether the authors of the article used goodness-of-fit (GOF) plots, evaluated uncertainty of the parameter estimates and/or studied model sensitivity to outliers.
Goodness-of-fit
Basic internal evaluation of a model consists mainly of GOF plots, which allow for detecting potential bias or problems in the structural model and/or the random effects models. Readers examined whether standard diagnostic plots were performed and/or reported in the articles.
GOF plots include population predictions (PRED) overlaid on observations (OBS) versus time, PRED versus OBS or time, population residuals (RES) versus PRED, population weighted residuals (WRES) versus PRED or time, individual predictions (IPRED) versus OBS or time, and individual weighted residuals (IWRES) versus IPRED or time.
Uncertainty on parameter estimates
Reliability of the results of the analysis can also be determined by evaluating the precision of parameter estimates from standard errors (SE) or confidence intervals (CI). Readers examined whether SEs and/or CIs were reported for fixed and/or random effects in models. Readers also examined which methods were used to calculate the SEs and whether SEs were obtained from the Fisher information matrix (the default method in NONMEM and most software) or with log-likelihood profiling (16) or bootstrap methods.
Model sensitivity
Reliability of a model can also be assessed by a sensitivity analysis. Because outliers may have a great impact on population parameter estimates, readers examined whether a sensitivity analysis to outlier data points was conducted. We also checked whether the authors evaluated model sensitivity with respect to some parameters.
Advanced internal evaluation
Advanced internal evaluation of models involves the use of complex techniques such as data splitting, resampling techniques (bootstrap, cross-validation) or Monte Carlo (MC) simulations.
Data splitting
This technique consists of dividing the original dataset into a learning dataset and a validation dataset. The former is used to build the model, while the latter is for validation purposes. The learning dataset can also be called an index or building dataset. For articles that reported data splitting, readers examined whether the allocation of individuals to one dataset or the other involved randomization and whether stratification on covariates was performed to minimize the possible differences between the learning and validation datasets. Readers then determined whether the model was refined by pooling learning and validation datasets.
Resampling techniques
Bootstrapping is a method of resampling with replacement that has the advantage of using the entire dataset (17) (in contrast to data splitting, which uses only part of a dataset). For articles describing bootstrapping, readers examined the type of bootstrap technique performed (such as on individuals using the vector of observations and/or with stratification on covariates). Cross-validation can be viewed as a method with repeated data splitting but, like bootstrapping, takes into account all available data (18). For reports describing cross-validation, readers examined whether a stratification on covariates was described and taken into account for the cross-validation.
Monte Carlo (MC) simulations of datasets
For reports describing MC simulations, readers examined whether the design used to simulate the data produced data consistent with the original dataset. They examined how simulations were performed and whether the uncertainty in population parameter estimates was taken into account and how (i.e., from SE only, from the full covariance matrix or by bootstrap techniques). Readers also examined whether authors used visual predictive check (VPC) or posterior predictive check (PPC) based on simulations. VPC graphically compares the observations with their predictive distribution according to the model, while PPC implies the calculation of a given statistic, which compares the observations with their posterior predictive distribution according to the model. PPC has been proposed by Bayesian statisticians (19, 20). As stated by the name, PPC requires to simulate from the posterior distribution of model parameter estimates. Unless a full Bayesian model has been used, this distribution is generally not available, in particular when parameter estimates are obtained via maximum likelihood (ML). To overcome this, Girard et al. initially suggested to use a parametric bootstrap distribution as posterior distribution (21). Briefly, this consisted in three steps: (i) new data set with identical design and input variables was simulated according to final model; (ii) simulated data set from step (i) were fitted with the model; (iii) parameters estimated in step (ii) were used to simulate a new data set from which relevant statistic is computed. In the field of pharmacokinetic-pharmacodynamic, Yano et al. (11) have extensively evaluated PPC, comparing three different techniques for simulating posterior distribution: (i) a degenerate distribution which simply uses point estimate with probability 1; (ii) the parametric bootstrap described above (21); (iii) a multivariate normal distribution with mean set to ML estimate and variance to asymptotic covariance matrix provided by the modelling software. Coupled with ML, VPC and PPC have been applied to several different types of PK-PD models, using one of those different techniques described above for simulating posterior distribution (22–30). As stated above, since calculation of metrics for PPC may require that simulated data are re-fitted with the model, the readers also checked that last point.
External evaluation
External validation of a model refers to the comparison between a new validation dataset and the predictions obtained with the model built on the learning dataset. The readers examined the differences between the learning dataset used to build the model (sometimes “index” or “building” dataset) and the external validation dataset. More precisely, readers checked whether inclusion criteria, dose regimen or sampling scheme were the same between the two datasets. They also reported the number of subjects in the validation dataset. Readers checked whether the model was refined, by pooling learning and validation datasets to assess the final model. They also examined whether MC simulations were performed with the model built on the learning dataset to calculate CI or to perform PPC for the evaluation.
Metrics used for model evaluation
The last part of the DAF concerned the metrics used for PK and/or PD model evaluation. These metrics were classified into those based on observations, individual parameters or population parameters. The metrics involved prediction error (PE), PE = OBS − PRED; standardized prediction error (SPE), SPE=PE/standard deviation (SD); absolute prediction error (APE), APE = |PE|; mean square prediction error (MSE), MSE = mean(PE2); and root mean square prediction error (RMSE), RMSE = MSE1/2 (31, 9). Readers also reported other metrics used to evaluate models and examined whether graphs and/or test results were included in the reports.
Subjective synthesis
A global subjective score was defined to assess the overall quality of the model evaluation for each article. Readers gave a subjective appreciation of three aspects of model evaluation: (1) “Was there an attempt to evaluate the model?”, (2) “Was the choice of the metrics appropriate?”, and (3) “Was the model evaluated?”, with four possible answers (“No”, “Poor”, “Good”, “Excellent”). Each article was read thoroughly and all other items in the DAF were recorded before answering these three questions. As these questions constitute a subjective score, it was not possible to have an exact criteria to answer them. However the scoring was performed by the two reviewers using the following guidelines:
For question (1), they answered “Poor” when only goodness-of-fit graphs (GOF) were performed. They answered “Good” when basic internal methods (at least GOF and uncertainty on parameter estimates) or advanced internal methods with metrics were used. Finally, they answered “Excellent” when advanced methods and external model evaluation were used.
Regarding question (2) about the appropriateness of metrics, the reviewers answered “Poor” for the use of PE, APE, MSE and RMSE, “Good” for the SPE and “Excellent” when graphs and/or tests were performed on the metrics. When the aim of model was to predict concentrations and the metrics were calculated for concentrations, they answered “Excellent” regardless of the metrics used.
Regarding question (3), the reviewers considered the purpose of modelling, descriptive or predictive, before giving any judgement. If only basic internal methods were performed, they answered “Poor” if the aim of modelling was predictive and “Good” if the objective was descriptive. They also answered “Good” when advanced internal methods with metrics were perfomed and “Excellent” when external model evaluation with metrics was performed. For all the three questions, the answer “No” was given when no related item was found in the report.
Statistical analysis
Once the survey was completed, we exported the mysql database for data mining and statistical analysis in SAS (version 8) and Splus (version 6.2). We used descriptive statistics (mean, median, SD, minimum and maximum values) for continuous variables and frequencies and percentages for categorical variables.
Reproducibility between readers was assessed only for the subjective items of the DAF by use of a random sample of 30 selected articles, which were examined by both readers. We calculated a weighted kappa coefficient (K) for each of the 4 subjective questions. This coefficient takes into account agreement that could occur by chance (expected agreement) and compares it to the observed agreement (32, 33). Usually, K scores range from < 0.2 (poor agreement), 0.2 to 0.4 (fair agreement), 0.4 to 0.6 (moderate agreement), 0.6 to 0.8 (good agreement) and > 0.8 (very good agreement) (31).
RESULTS
General results
Among the 482 articles initially selected, 158 were excluded, resulting in a total of 324 selected articles at the end (Fig. 1). Since articles could describe more than one PK or PD model, 360 PK models and 118 PD models were available for analysis from the 324 articles selected. A total of 161 and 163 articles were assigned to the two readers (KB and CD, respectively). Among all the models, 68% were PK models, 23% PK-PD models and 9% PD models.
Figure 1.
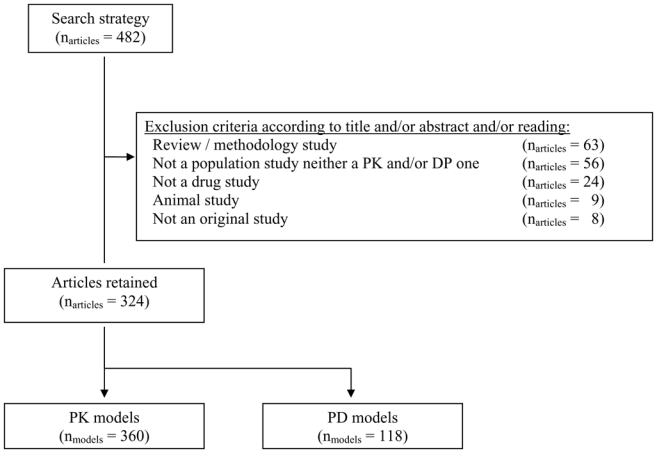
Screening of the articles selected in Pubmed using exclusion criteria.
In 45% of the PK models and 62% of the PD models, model evaluation involved only basic internal methods. Advanced internal evaluation with or without basic internal evaluation was reported for 28% of the PK models versus 16% of the PD models. External validation was performed for only 7% of the PK models and 8% of the PD models. Figure 2 displays these results by year of publication. No trend in evaluation method was observed from 2002 to 2004.
Figure 2.
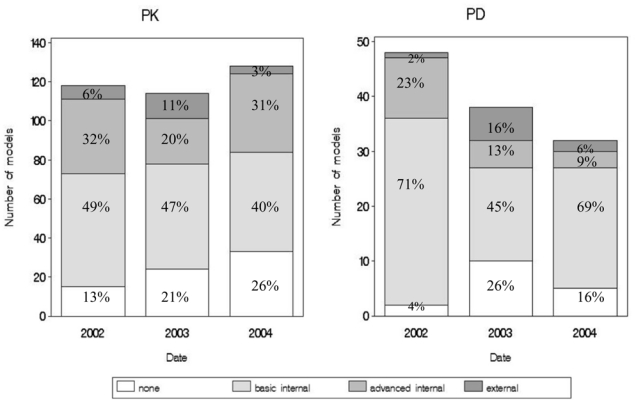
Different types of evaluation (none, basic internal only, advanced internal, or external) per date, applied to PK models (left panel) and PD models (right panel).
Basic internal evaluation
All results reported for basic internal evaluation are shown in Table I.
Table I.
Methods used in 268 out of 360 pharmacokinetic (PK) and 90 out of 118 pharmacodynamic models for which basic internal evaluation was performed. Data are number of models and, in brackets, percentage of the corresponding category.
| Basic internal evaluation | PK models | PD models |
|---|---|---|
| 268 (74) | 90 (76.3) | |
| Goodness-of-fit plots (graphs shown) | 233 (87) | 71 (79) |
| PRED overlaid on observations versus time | 92 (40) | 41 (58) |
| PRED vs OBS | 129 (55) | 30 (42) |
| PRED vs TIME | 4 (2) | 5 (7) |
| RES vs PRED | 7(3) | 1(1) |
| WRES vs PRED | 39 (17) | 3 (4) |
| WRES vs TIME | 19 (8) | 3 (4) |
| Distribution of RES | 8 (3) | 0 (0) |
| IPRED vs OBS | 103 (44) | 16 (23) |
| IPRED vs TIME | 2 (1) | 1 (1) |
| IWRES vs IPRED | 9 (4) | 2 (3) |
| IWRES vs TIME | 3 (1) | 0 (0) |
| Distribution of fixed and/or random effects | 5 (2) | 1 (1) |
| Other | 19 (8) | 9 (13) |
| Uncertainty on parameter estimates | 191 (71) | 47 (52) |
| SE on fixed effects | 191 (100) | 47 (100) |
| SE on random effects | 94 (49) | 13 (28) |
| Methods used to obtain SE | ||
| Fisher information matrix | 149 (78) | 41 (87) |
| Profile likelihood | 3 (2) | 0 (0) |
| Bootstrap | 6 (3) | 2 (4) |
| Bayesian approach | 14 (7) | 2 (4) |
| Not reported | 19 (10) | 2 (4) |
| Model sensitivity | 12 (5) | 0 (0) |
| Sensibility analysis to data outliers | 6 (50) | - |
| Sensibility analysis with respect to some parameters | 6 (50) | - |
For each category, the percentages in a column might not total 100 % because several methods could be used for the same model. See text for abbreviations.
Goodness-of-fit
GOF plots were said to be used for internal evaluation in 250 (69.%) of the 360 PK models and 77 (65%) of the 118 PD models. However, graphs were shown for only 233 (65%) PK models and 71 (60%) PD models. The three graphs most often shown were the same for PK and PD models (Table I): PRED vs. OBS, IPRED vs. OBS and OBS vs. time, with a curve of mean prediction overlaid.
Uncertainty on parameter estimates
Concerning reliability of the analyses, SE or CI were reported only for 191 (53%) of the 360 PK models and 47 (40%) of the 118 PD models. SE or CI were less often reported for random effects (< 30% for the PK or the PD models) than for fixed effects. SE were mainly obtained from the Fisher information matrix. The other techniques Bayesian method, bootstrap and profile likelihood were less often reported (< 10% for each method for the PK or for the PD models).
Model sensitivity
Model sensitivity to data outliers was seldom described for the PK models and never for PD models. When such sensitivity analysis was conducted, the different methods applied were well described. Case deletion diagnostic, allowing computation of studentized residuals and Cook’s distance, or Jack-knife analysis, were found in 3 articles (34–36). In 2 articles, observations defined as outliers with WRES diagnostic plots were reported deleted. Observations were considered as outliers when absolute WRES was above 5 (37, 38). Model sensitivity analysis with respect to some parameters was reported for 6 PK models for study of the impact of sensitivity of a parameter estimate (34, 39–43).
Advanced internal evaluation
All results reported for advanced internal evaluation are shown in Table II. Data splitting was more often used than bootstrap and cross-validation. The learning dataset was pooled with the validation dataset to derive a refined model for predictive purposes in about half of the cases. The median ratio between number of subjects in the validation dataset and number in the learning dataset was 0.5 (range 0.02–2.2) for the PK models versus 0.4 (range 0.3–0.4) for the PD models.
Table II.
Evaluation methods used in 101 out of 360 pharmacokinetic (PK) and 19 out of 118 pharmacodynamic (PD) models for which advanced internal evaluation was performed. Data are the number of models and, in brackets, the percentage referring to the corresponding category.
| Advanced internal evaluation | PK models | PD models |
|---|---|---|
| 101 (28) | 19 (16) | |
| Data splitting | 45 (45) | 4 (21) |
| With randomization | 24 (53) | 1 (25) |
| Covariate distribution compared between index and validation datasets | 15 (33) | 0 (0) |
| Data reanalyzed by pooling index and validation datasets | 22 (49) | 2 (50) |
| Number of subjects in the index dataset, median (min;max) | 60 [7; 580] | 152 [102; 634] |
| Number of subjects in the validation dataset, median (min;max) | 31 [6; 161] | 51 [43; 232)] |
| Bootstrap | 31 (31) | 6 (32) |
| Wild bootstrap (on individual) | 27 (87) | 6 (100) |
| Number of bootstrap samples, median (min;max) | 500 [100; 1100] | 200 [200; 1000] |
| Cross validation | 11 (11) | 5 (26) |
| Number of groups, median (min;max) | 10 (3; 40) | 13 (3; 21) |
| Monte Carlo simulation | 30 (30) | 7 (37) |
| Design identical to the original dataset | 16 (53) | 2 (29) |
| Simulated datasets fitted | 14 (47) | 5 (71) |
| Aim of simulation | ||
| Visual predictive check | 12 (40) | 4 (57) |
| Posterior predictive check | 8 (27) | 0 (0) |
| Other | 10 (33) | 3 (43) |
For each category, the percentages in a column might not total 100% because several methods could be used for the same model.
Among the resampling techniques, bootstrap was more frequently performed than cross-validation for the PK models (almost 3 times more), but the two methods were reported in the same proportions for the PD models.
About one-third of the models were evaluated with MC simulations. Twelve PK models and 4 PD models involved VPC; PPC was used for 8 PK models but not for PD models.
External evaluation
All results concerning external evaluation are shown in Table III. External validation was rarely reported as being performed; it was reported for only 24 out of 360 of PK models and 9 out of 118 of PD models. Re-analysis of all data after the validation step, by pooling the learning and validation datasets, was reported for only 3 PK models. The validation dataset included fewer than 50 patients for 13 PK models and for 6 PD models evaluated this way.
Table III.
Evaluation methods used in the 24 pharmacokinetic out of 360 (PK) and 9 out of 118 pharmacodynamic (PD) models for which external evaluation was performed. For each method, we report the number of models and in brackets, the percentage referring to the corresponding category.
| External evaluation | PK models | PD models |
|---|---|---|
| 24 (7) | 9 (8) | |
| Same inclusion criteria | 9 (38) | 7 (78) |
| Same dose regimen | 7 (29) | 1 (11) |
| Same sampling scheme | 5 (21) | 6 (67) |
| Data reanalyzed by pooling index and validation datasets | 3 (13) | 0 (0.0) |
| Number of subjects in the index dataset, median (min;max) | 86 [6; 585] | 271 [6; 635] |
| Number of subjects in the external validation dataset, median (min;max) | 36 [8; 319] | 172 [24; 319] |
| Monte Carlo simulations | 3 (0.1) | 1 (0.1) |
| Aim of simulation | ||
| Visual predictive check | 1 (33) | 1 (100) |
| Posterior predictive check | 1 (33) | 0 (0) |
| Other | 1 (33) | 0 (0) |
For each category, the percentages in a column might not total 100% because several methods could be used for the same model.
MC simulations were used in only 3 PK models: for VPC (44), for PPC (42) and with a methodology not clearly reported. VPC was reported for one PD model.
Metrics used for model evaluation
Internal evaluation (basic and/or advanced methods) was reported for 287 PK models versus 100 PD models. The reported metrics for observations were PE for 67 (23%), SPE for 63 (22%), MSE (and/or RMSE) for 40 (14%) and APE for 24 (8%) of the 287 PK models. Tests were performed on metrics for observations for 20 (7%) of the 287 PK models, and graphs were created for 81 (28%) of these. PE was also the most-used metric for individual parameters and population parameters for 15 (5%) and 8 (3%) of the PK models. Other original metrics based on observations were reported. One of these metrics consisted of computing, for each time point, prediction discrepancies as the percentile of the observation in the whole distribution of predictions (45). Another approach was to use a criterion called geometric performance error (46). In another paper, authors used the median population values of WRES as an estimate of model bias, and the median population value of the absolute weighted residuals was used as an estimate of model precision (47).
PE based on observations was reported for internal evaluation in only 5 out of 100 PD models. Another metric based on observations was the coefficient of determination, which measures the agreement between the predictions and the observations weighted by the variance and, like the coefficient of determination in linear regression, tends toward 1 as the fit improves (48).
External evaluation was reported in 24 PK models. Only metrics for observations were used, mostly PE for 9 (38%) of the 24 PK models. Tests were performed and graphs shown in 5 (38%) and 14 (58%) of the 24 PK models, respectively.
Subjective synthesis
The answers to the three questions of the subjective synthesis are displayed in Figure 3. The two readers (KB and CD) considered that in most cases, authors attempted to evaluate the PK and/or PD models. However, the answers to the questions confirmed that the methodology chosen to evaluate the model was often inadequate. Finally, the readers considered that model qualification was good or excellent in 28% of the PK models and 26% of the PD models.
Figure 3.
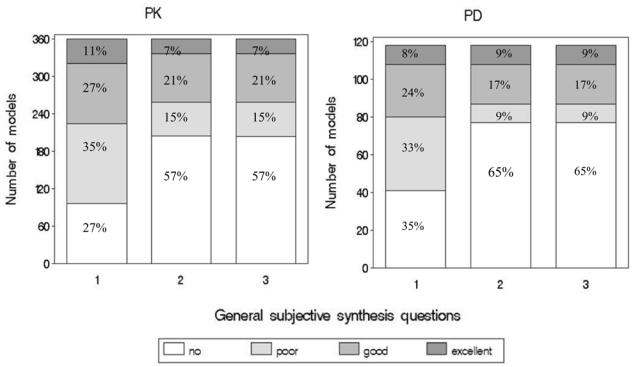
Answers to the subjective synthesis questions about PK models (left panel) and PD models (right panel) evaluation. The subjective questions were: (1) “Was there an attempt to evaluate the model?”; (2) “Was the choice of the metrics appropriate?”; (3) “Was the model evaluated?”.
From the 30 articles examined by the two readers, inter-observer reproducibility was satisfactory for all three questions, with Kappa coefficients of 0.68 (95% CI, 0.54–0.83) for question (1) “Was there an attempt to evaluate the model?”, of 0.77 (95% CI, 0.62–0.93) for question (2) “Was the choice of the metrics appropriate?” and of 0.76 (95% CI, 0.60–0.92) for question (3) “Was the model evaluated?”.
DISCUSSION
Because evaluation of population PK or and/or PD models is an important issue in population modeling, we decided to perform a systematic review of population analyses published between 2002 and 2004 to focus on the different methods used to evaluate such models and to assess whether the models were adequately evaluated.
An exhaustive survey of literature is the only way to obtain an overview of a specific research area. We applied a DAF we developed to extract the relevant information from the selected articles. Because the data abstraction form was implemented in PHP and HTML language, we could perform analysis grid keying while reading through a local web interface, which made the whole process very easy and the extraction of data more reliable.
The results of the survey indicate that authors made no attempt to qualify 27% of the PK models and 35% of the PD models. Since basic internal evaluation is the simplest approach for model evaluation, it was unsurprisingly the most frequently used (in 74% of the PK models vs. 76.3% of the PD models). Such evaluation involved largely GOF plotting, especially graphing of predictions versus observations.
Among the results of a population analysis, the SEs or CIs of the estimated population parameters are important because they indicate the precision with which the parameters have been estimated. The guideline on reporting the results of population pharmacokinetic analyses of the EMEA recommended that the parameter estimates should be presented for all model parameters, together with their SEs and/or confidence intervals (12). Similarly, the FDA guideline recommends to check the parameter estimates and their SEs (10). Despite this, SEs or CIs were reported in only about half of the articles and even less papers reported the variance of the random effects (less than one third). When SEs were given in the articles, they were usually obtained from the Fisher information matrix (as it is implemented in most estimation software, especially NONMEM (11)). Standard errors expected from the Fisher information matrix with NONMEM have been shown to be close to the empirical SE obtained by simulation (49). However, it is not the purpose of the present paper to discuss whether one method (Fisher information matrix, profile likelihood, bootstrap…) is better than another to calculate the SEs or the CIs.
Sensitivity analysis was rarely described for PK models and never for PD models in our articles published between 2002 and 2004. Some robust methods of population analysis that allow outliers to be retained without giving them undue weight have been suggested in more general methodology papers (50, 51).
Among the advanced methods for internal model evaluation, data splitting was more often described than resampling techniques. Data splitting is useful for creating a validation dataset to test the predictive performance of the model when it is not practical to collect new data to be used as a validation dataset. However, the predictive accuracy of the model is, in general, a function of the sample size of the learning dataset resulting from data splitting (52), and some datasets are too small to be effectively split. In the articles we investigated, about two-thirds of the entire dataset was used as the learning dataset and the remaining third was used as the validation dataset. The FDA recommends pooling the index and validation datasets to determine a final model if the learning dataset passes the validation procedure (10). This pooling was done in only half of cases. With respect to evaluation techniques based on resampling, bootstrapping was used in about one-third of the models evaluated with advanced methods, whereas cross-validation was seldom used. When the type of bootstrap was indicated, bootstrap on the individual was applied in most cases.
New methods based on MC simulations were proposed to evaluate models. The simplest approach, VPC, is a subjective method that graphically compares observations to model predictions. Evaluation of model adequacy thus depends on the appreciation of the modeller. A recent tool used for model evaluation, PPC (11), evaluates the adequacy between the data and the model by comparing a given statistic, computed with the observed data, to its posterior predictive distribution according to the model. Different metrics can be applied with PPC (27). One method consists of using PPC on observations, by computing for each observation, prediction discrepancies as the percentile of the observation in the whole distribution of predictions (53). In the present review, VPC and PPC were not often performed for internal model evaluation. Except when posterior distribution is included via a parametric bootstrap which implies refitting simulated datasets, then simulating using parameters estimated on those bootstrapped datasets, this technique is not computationally intensive, so the computational burden is probably not the issue explaining this under-use of PPC since most of the time people chose a degenerate distribution. More likely, the apparent conceptual complexity of PPC and the programming efforts needed to post-process the simulated datasets may still be an obstacle for this method.
External evaluation provides the most stringent method for testing the predictive ability of a developed model (10, 53). However, this method was rarely described in the articles we reviewed. External validation datasets were often obtained from small studies with less than 50 patients. When external validation was performed, learning and validation datasets were less often pooled to perform a global analysis for external evaluation compared with data splitting. This finding could be expected, since external validation datasets are often different from learning datasets.
Although innovative approaches have been strongly encouraged by the U.S. FDA, few original metrics were reported in our articles. Evaluation through prediction errors on observations and parameters were the most frequently used metrics for internal and external evaluation of PK and/or PD models. The mean square prediction error and the mean prediction error are indeed easily computed and give an indication of precision and bias, respectively. Few metrics were reported on parameters.
A previous review of 136 articles published between 1977 and 1991 (9) showed that 26 articles (19%) described a validation process on a separate dataset resulting from data splitting (7 of the 26 articles) or from an independent study (external validation; in 3 of the 26 articles. As in the present study, metrics used for model evaluation were performed mainly through concentrations by computing prediction errors or standardized prediction errors.
We observed no differences between the evaluation of parametric and nonparametric methods. However nonparametric methods were only used in 19 models in this survey, which may not be enough to draw meaningful conclusions.
Model evaluation depends on the objective of the analysis. If the purpose of modeling is descriptive (estimation of PK and/or PD parameters, parameter variability, etc.), at least basic internal model evaluation should be performed and GOF plots and SE on the fixed and random effects should be reported. If the aim of modeling is predictive (predictions of concentrations or effects, similar to that used in trial simulation), we recommended advanced internal methods (data splitting, bootstrap, cross-validation, visual predictive check or posterior predictive check), or even better the same methods applied to external datasets.
In our study, inter-observer reproducibility was good for the subjective analysis, irrespective of the question. Both readers considered that model qualification was good or excellent in 28% of the PK models and 26% of the PD models. These results were due to the fact that advanced internal and external methods were not sufficiently used to evaluate the PK and/or PD models.
CONCLUSION
In conclusion, it is the first time such a large review of the literature has been done. This survey provides new information on the way PK/PD models are evaluated and shows some possible problems (infrequent reporting of SE for random effects as example). We are however aware that the process of publishing work of PK/PD modeling serves as a filter itself. For example, editorial review or publication acceptance may lead to the disappearance of any trace of GOF plots in certain manuscripts. Therefore in some cases, the adequacy of model evaluation might reflect the publication process more than the modeling process.
Supplementary Material
Appendices
Key words used in Pubmed for Article selection
((population AND model*) OR (non AND linear AND mixed AND effect*) OR bayesian OR hierarchical OR NONMEM OR nlme OR NLMIXED OR P-PHARM OR WinNonMix OR *bugs OR NPLM OR NPEM OR Kinetica OR ADAPT OR ITRLS OR MP2) AND (PK-PD OR PK-PD OR PBPK OR pharmacokinetic* OR pharmacodynamic*)
References
- 1.Sheiner LB, Steimer JL. Pharmacokinetic/pharmacodynamic modeling in drug development. Annu Rev Pharmacol Toxicol. 2000;40:67–95. doi: 10.1146/annurev.pharmtox.40.1.67. [DOI] [PubMed] [Google Scholar]
- 2.Aarons L, Karlsson MO, Mentre F, Rombout F, Steimer JL, van Peer A. Role of modelling and simulation in Phase I drug development. Eur J Pharm Sci. 2001;13:115–22. doi: 10.1016/s0928-0987(01)00096-3. [DOI] [PubMed] [Google Scholar]
- 3.Jochemsen R, Laveille C, Breimer DD. Application of pharmacokinetic/pharmacodynamic modelling and population approaches to drug development. International J of Pharmaceutical Medicine. 1999;13:243–51. [Google Scholar]
- 4.Holford NH, Kimko HC, Monteleone JP, Peck CC. Simulation of clinical trials. Annu Rev Pharmacol Toxicol. 2000;40:209–34. doi: 10.1146/annurev.pharmtox.40.1.209. [DOI] [PubMed] [Google Scholar]
- 5.Lesko LJ, Rowland M, Peck CC, Blaschke TF. Optimizing the science of drug development: opportunities for better candidate selection and accelerated evaluation in humans. Pharm Res. 2000;17:1335–44. doi: 10.1023/a:1007574217260. [DOI] [PubMed] [Google Scholar]
- 6.Kimko HC, Duffull SB. Simulation for designing clinical trials: a pharmacokinetic-pharmacodynamic modeling prospective. New York: Marcel Dekker; 2003. [Google Scholar]
- 7.Girard P. Clinical trial simulation: a tool for understanding study failures and preventing them. Basic Clin Pharmacol Toxicol. 2005;96:228–34. doi: 10.1111/j.1742-7843.2005.pto960313.x. [DOI] [PubMed] [Google Scholar]
- 8.Girard P, Cucherat M, Guez D. Clinical trial simulation in drug development. Therapie. 2004;59:287–95. 297–304. doi: 10.2515/therapie:2004056. [DOI] [PubMed] [Google Scholar]
- 9.Mentré F, Ebelin ME. Validation of population pharmacokinetic/pharmacodynamic analyses: review of proposed approaches. In: Balant LP, Aarons L, editors. The population approach: measuring and managing variability in response concentration and dose. Commission of the european communities, european cooperation in the field of scientific and technical research; Brussels: 1997. [Google Scholar]
- 9.Ette EI. Stability and performance of a population pharmacokinetic model. J Clin Pharmacol. 1997;37:486–95. doi: 10.1002/j.1552-4604.1997.tb04326.x. [DOI] [PubMed] [Google Scholar]
- 10.Food and Drug Administration. Guidance for Industry: population pharmacokinetics. 1999. (available at htpp://www.fda.gov/cder/guidance/index.html.
- 11.Yano Y, Beal SL, Sheiner LB. Evaluating pharmacokinetic/pharmacodynamic models using the posterior predictive check. J Pharmacokinet Pharmacodyn. 2001;28:171–92. doi: 10.1023/a:1011555016423. [DOI] [PubMed] [Google Scholar]
- 12.European agency for the evaluation of medicinal products. Guideline on reporting the results of population pharmacokinetic analyses. 2006. (available at htpp://www.emea.eu.int/pdfs/human/ewp/18599006en.pdf.
- 13.Wade JR, Edholm M, Salmonson T. A guide for reporting the results of population pharmacokinetic analyses: a swedish perspective. Aaps J. 2005;7:456–460. doi: 10.1208/aapsj070245. [DOI] [PMC free article] [PubMed] [Google Scholar]
- 14.Ette EI. Stability and performance of a population pharmacokinetic model. J Clin Pharmacol. 1997;37:486–95. doi: 10.1002/j.1552-4604.1997.tb04326.x. [DOI] [PubMed] [Google Scholar]
- 15.Boutron I, Tubach F, Giraudeau B, Ravaud P. Methodological differences in clinical trials evaluating nonpharmacological and pharmacological treatments of hip and knee osteoarthritis. J Am Stat Assoc. 2003;290:1060–1070. doi: 10.1001/jama.290.8.1062. [DOI] [PubMed] [Google Scholar]
- 16.Sheiner LB. Analysis of pharmacokinetic data using parametric models. 3 Hypothesis tests and confidence intervals. J Pharmacokinet Biopharm. 1986;14:539–55. doi: 10.1007/BF01059660. [DOI] [PubMed] [Google Scholar]
- 17.Efron B. Bootstrap methods: another look at the jackknife. Ann Stat. 1979;7:1–26. [Google Scholar]
- 18.Efron B, Gong G. A leisurely look at the bootstrap, the jakknife and cross-validation. American Statistician. 1983;37:36–48. [Google Scholar]
- 19.Belin TR, Rubin DB. The analysis of repeated-measures data on schizophrenic reaction times using mixture models. Stat Med. 1995;14:747–68. doi: 10.1002/sim.4780140805. [DOI] [PubMed] [Google Scholar]
- 20.Gelman A, Carlin JB, Stern HS, Rubin DB. Bayesian data analysis. London: Chapman and Hall; 2004. [Google Scholar]
- 21.Girard P, Blaschke TF, Kastrissios H, Sheiner LB. A Markov mixed effect regression model for drug compliance. Stat Med. 1998;17:2313–33. doi: 10.1002/(sici)1097-0258(19981030)17:20<2313::aid-sim935>3.0.co;2-v. [DOI] [PubMed] [Google Scholar]
- 22.Cox EH, Veyrat-Follet C, Beal SL, Fuseau E, Kenkare S, Sheiner LB. A population pharmacokinetic-pharmacodynamic analysis of repeated measures time-to-event pharmacodynamic responses: the antiemetic effect of ondansetron. J Pharmacokinet Biopharm. 1999;27:625–44. doi: 10.1023/a:1020930626404. [DOI] [PubMed] [Google Scholar]
- 23.Duffull SB, Chabaud S, Nony P, Laveille C, Girard P, Aarons L. A pharmacokinetic simulation model for ivabradine in healthy volunteers. Eur J Pharm Sci. 2000;10:285–94. doi: 10.1016/s0928-0987(00)00086-5. [DOI] [PubMed] [Google Scholar]
- 24.Friberg LE, Freijs A, Sandstrom M, Karlsson MO. Semiphysiological model for the time course of leukocytes after varying schedules of 5-fluorouracil in rats. J Pharmacol Exp Ther. 2000;295:734–40. [PubMed] [Google Scholar]
- 25.Chabaud S, Girard P, Nony P, Boissel JP. Clinical trial simulation using therapeutic effect modeling: application to ivabradine efficacy in patients with angina pectoris. J Pharmacokinet Pharmacodyn. 2002;29:339–63. doi: 10.1023/a:1020953107162. [DOI] [PubMed] [Google Scholar]
- 26.Duffull SB, Kirkpatrick CM, Green B, Holford NH. Analysis of population pharmacokinetic data using NONMEM and WinBUGS. J Biopharm Stat. 2005;15:53–73. doi: 10.1081/bip-200040824. [DOI] [PubMed] [Google Scholar]
- 27.Jadhav PR, Gobburu JV. A new equivalence based metric for predictive check to qualify mixed-effects models. Aaps J. 2005;7:E523–31. doi: 10.1208/aapsj070353. [DOI] [PMC free article] [PubMed] [Google Scholar]
- 28.Shi J, Kovacs SJ, Wang Y, Ludden TM, Bhargava VO. Population pharmacokinetics of the active metabolite of leflunomide in pediatric subjects with polyarticular course juvenile rheumatoid arthritis. J Pharmacokinet Pharmacodyn. 2005;32:419–39. doi: 10.1007/s10928-005-0049-8. [DOI] [PubMed] [Google Scholar]
- 29.van Kesteren C, Zandvliet AS, Karlsson MO, Mathot RA, Punt CJ, Armand JP, Raymond E, Huitema AD, Dittrich C, Dumez H, Roche HH, Droz JP, Ravic M, Yule SM, Wanders J, Beijnen JH, Fumoleau P, Schellens JH. Semi-physiological model describing the hematological toxicity of the anti-cancer agent indisulam. Invest New Drugs. 2005;23:225–34. doi: 10.1007/s10637-005-6730-3. [DOI] [PubMed] [Google Scholar]
- 30.Zingmark PH, Kagedal M, Karlsson MO. Modelling a spontaneously reported side effect by use of a Markov mixed-effects model. J Pharmacokinet Pharmacodyn. 2005;32:261–81. doi: 10.1007/s10928-005-0021-7. [DOI] [PubMed] [Google Scholar]
- 31.Williams PJ, Ette EI. Determination of model appropriateness. New York: Marcel Dekker; 2003. [Google Scholar]
- 32.Cohen L. A coefficient of agreement for nominal scales. Educational and Psychological Measurement. 1960:37–46. [Google Scholar]
- 33.Fleiss J. Statistical methods for rates and proportions. 2. New York: 1981. [DOI] [PubMed] [Google Scholar]
- 34.Kloft C, Graefe EU, Tanswell P, Scott AM, Hofheinz R, Amelsberg A, Karlsson MO. Population pharmacokinetics of sibrotuzumab, a novel therapeutic monoclonal antibody, in cancer patients. Invest New Drugs. 2004;22:39–52. doi: 10.1023/b:drug.0000006173.72210.1c. [DOI] [PubMed] [Google Scholar]
- 35.Shen M, Schilder RJ, Obasaju C, Gallo JM. Population pharmacokinetic and limited sampling models for carboplatin administered in high-dose combination regimens with peripheral blood stem cell support. 2002;50:243–50. doi: 10.1007/s00280-002-0490-y. [DOI] [PubMed] [Google Scholar]
- 36.Bonate PL, Floret S, Bentzen C. Population pharmacokinetics of APOMINE: a meta-analysis in cancer patients and healthy males. Br J Clin Pharmacol. 2004;58:142–55. doi: 10.1111/j.1365-2125.2004.02111.x. [DOI] [PMC free article] [PubMed] [Google Scholar]
- 37.Rajagopalan P, Gastonguay MR. Population pharmacokinetics of ciprofloxacin in pediatric patients. J Clin Pharmacol. 2003;43:698–710. [PubMed] [Google Scholar]
- 38.Meagher AK, Forrest A, Rayner CR, Birmingham MC, Schentag JJ. Population pharmacokinetics of linezolid in patients treated in a compassionate-use program. Antimicrob Agents Chemother. 2003;47:548–53. doi: 10.1128/AAC.47.2.548-553.2003. [DOI] [PMC free article] [PubMed] [Google Scholar]
- 39.Ishibashi T, Yano Y, Oguma T. Population pharmacokinetics of platinum after nedaplatin administration and model validation in adult patients. Br J Clin Pharmacol. 2003;56:205–13. doi: 10.1046/j.1365-2125.2003.01871.x. [DOI] [PMC free article] [PubMed] [Google Scholar]
- 40.El Desoky ES, Fuseau E, El Din Amry S, Cosson V. Pharmacokinetic modelling of valproic acid from routine clinical data in Egyptian epileptic patients. Eur J Clin Pharmacol. 2004;59:783–90. doi: 10.1007/s00228-003-0699-7. [DOI] [PubMed] [Google Scholar]
- 41.Rajagopalan P, Pelz RK, Lipsett PA, Swoboda SM, Rinaldi MG, Hendrix CW. Enteral fluconazole population pharmacokinetics in patients in the surgical intensive care unit. Pharmacotherapy. 2003;23:592–602. doi: 10.1592/phco.23.5.592.32202. [DOI] [PubMed] [Google Scholar]
- 42.Sale M, Salder BM, Stein DS. Pharmacokinetic modeling and simulations of interaction of amprenavir and ritonavir. Antimicrob Agents Chemother. 2002;46:746–54. doi: 10.1128/AAC.46.3.746-754.2002. [DOI] [PMC free article] [PubMed] [Google Scholar]
- 43.Pfister M, Martin NE, Haskell LP, Barrett JS. Optimizing dose selection with modeling and simulation: application to the vasopeptidase inhibitor M100240. J Clin Pharmacol. 2004;44:621–31. doi: 10.1177/0091270004265365. [DOI] [PubMed] [Google Scholar]
- 44.Ambrose PG, Bhavnani SM, Cirincione BB, Piedmonte M, Grasela TH. Gatifloxacin and the elderly: pharmacokinetic-pharmacodynamic rationale for a potential age-related dose reduction. J Antimicrob Chemother. 2003;52:435–40. doi: 10.1093/jac/dkg370. [DOI] [PubMed] [Google Scholar]
- 45.Comets E, Ikeda K, Hoff P, Fumoleau P, Wanders J, Tanigawara Y. Comparison of the pharmacokinetics of S-1, an oral anticancer agent, in Western and Japanese patients. J Pharmacokinet Pharmacodyn. 2003;30:257–83. doi: 10.1023/a:1026142601822. [DOI] [PMC free article] [PubMed] [Google Scholar]
- 46.Butterworth J, Lin YA, Prielipp R, Bennett J, James R. The pharmacokinetics and cardiovascular effects of a single intravenous dose of protamine in normal volunteers. Anesth Analg. 2002;94:514–22. doi: 10.1097/00000539-200203000-00008. [DOI] [PubMed] [Google Scholar]
- 47.Knibbe CA, Melenhorst-de Jong G, Mestrom M, Rademaker CM, Reijnvaan AF, Zuideveld KP, Kuks PF, van Vught H, Danhof M. Pharmacokinetics and effects of propofol 6% for short-term sedation in paediatric patients following cardiac surgery. Br J Clin Pharmacol. 2002;54:415–22. doi: 10.1046/j.1365-2125.2002.01652.x. [DOI] [PMC free article] [PubMed] [Google Scholar]
- 48.Olofsen E, Sleigh JW, Dahan A. The influence of remifentanil on the dynamic relation between sevoflurane and surrogate anesthetic effect measures derived from the EEG. Anesthesiology. 2002;96:555–64. doi: 10.1097/00000542-200203000-00009. [DOI] [PubMed] [Google Scholar]
- 49.Retout S, Mentré F, Bruno R. Fisher information matrix for non-linear lixed-effects models: evaluation and application for optimal design of enoxaparin population pharmacokinetics. Statist Med. 2002;21:2623–39. doi: 10.1002/sim.1041. [DOI] [PubMed] [Google Scholar]
- 50.Mallet A. A maximum likelihood estimation method for random coefficient regression models. Biometrika. 1986;73:645–56. [Google Scholar]
- 51.Wakefield J. The bayesian analysis of population parmacokinetic models. J Am Stat Assoc. 1996;91:62–75. [Google Scholar]
- 52.Roecker EB. Prediction error and its estimation for subset-selected models. Technometrics. 1991;33:316–31. [Google Scholar]
- 53.Mentré F, Escolano S. Prediction discrepancies for the evaluation of nonlinear mixed-effects Models. J Pharmacokinet Pharmacodyn. 2005;33:345–67. doi: 10.1007/s10928-005-0016-4. [DOI] [PMC free article] [PubMed] [Google Scholar]
Associated Data
This section collects any data citations, data availability statements, or supplementary materials included in this article.