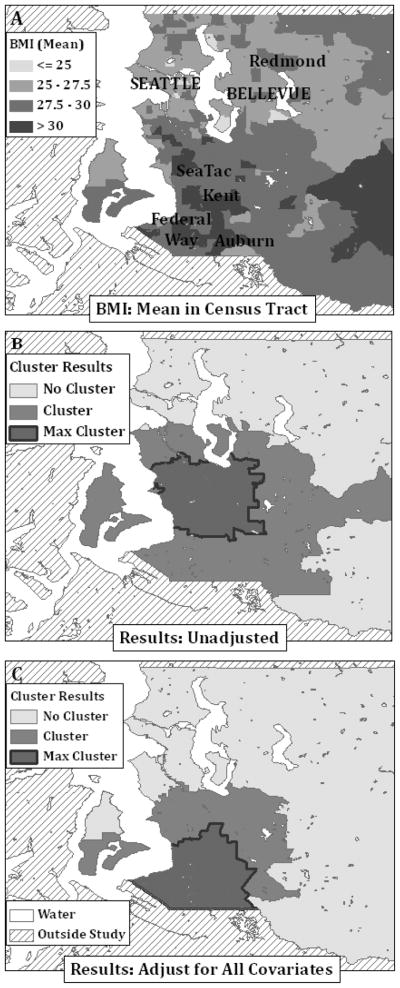
Figure 1.
Assessing spatial clustering of female BMI cluster in King County WA. Part A displays the raw mean census tract BMI and Part B and C display displays the areas with statistically significant spatial clustering from the unadjusted analyses and then adjusting for all individual and area-level covariates.

