

Abstract
Breast cancer is the second leading cause of cancer deaths among women in the US. Several treatment options exist, with different side effects. To alleviate the side effects several research groups have studied chemotherapeutic effects of plant compounds on cancer cells. These could be used as an alternative treatment option either alone or in combination with other chemotherapeutic drugs. The aim of the study was to evaluate the activity of a combination of perillyl alcohol (POH), methyl jasmonate (MJ) with cisplatin to define the most effective schedule and to investigate the mechanism of action in breast cancer cells. POH and MJ treatment (IC20 concentration) enhanced the cytotoxicity for subsequent exposure to cisplatin in MDA-MB-435 and MDA-MB-231 cells. Combination treatment of POH and MJ blocked cells at the G0/G1 phase of the cell cycle and the addition of cisplatin forced the cells to progress through the cell cycle and induced apoptosis. Apoptotic mechanistic studies indicated that POH and MJ treatment activated TNFR1 and this was further increased by the addition of cisplatin. It was also found that mitochondrial membrane potential decreased with POH and MJ treatment, this effect was further enhanced by cisplatin treatment. These findings contributed to a better understanding of molecular mechanism of apoptosis in combination treatment of POH, MJ and cisplatin. Results also demonstrated that combination treatment of three drugs is more effective than single drug or two drugs together.
Introduction
Breast cancer, patients have several treatment options including surgery, chemotherapy, radiation therapy and a combination of these therapies. Due to disadvantages with single agent chemotherapy drug combinations at tolerable doses are administered to increase efficacy [1]. New strategies for breast cancer treatment such as the use of plant compounds in combination with chemotherapeutic drugs will improve the efficacy of current therapeutic regimens.
Perillyl alcohol (POH) and Methyl jasmonate (MJ) are plant compounds that can be used for combination therapy [2-11]. POH is a naturally occurring monoterpne that inhibited growth of cancer cells and induced apoptosis [2, 4, 5]. A recent report indicated that POH sensitized human myeloid U937 cells to pentoxifylline. Combination treatment of POH with pentoxyfylline increased Bcl2 and Bax expression as well as induced apoptosis [6]. POH has been reported to sensitize prostate and malignant glioma cells to cisplatin/radiation via Fas mediated death receptor pathway [7, 8]. Malignant glioma cells preincubation with POH demonstrated a dose dependent sensitivity to cisplatin and doxorubicin [8]. MJ is a plant stress hormone that inhibited growth of lung, breast and leukemia cells [9-11]. MJ enhances ATP depletion in the presence of glycolysis inhibitor, 2DG in CT26 (murine colon carcinoma) and D122 (murine lung carcinoma) cells [11]. Methyl jasmonate has been shown to affect mitochondria by disrupting hexokinase (HK) and voltage dependent anion channel (VDAC) association, causing glycolysis inhibition and inducing mitochondrial outer membrane permeabilization (MOMP) (12). MOMP results in cytochrome-c release, activation of Bcl2 family of proteins, caspases and eventually leads to cell death (13). Combination studies of MJ with cisplatin, adriamycin, taxol, 1,3bis {2-chloroethyl}-1-nitusourea (BCNU) showed superadditive effects with BCNU and cisplatin in human pancreas carcinoma MIA PaCa-2 cells [11]. MJ in combination with taxol showed cooperative effects in MCF-7 cells but not in combination with cisplatin [11]. These studies indicate that research on plant compounds in combination with chemotherapeutic agents will provide new avenues for breast cancer treatment.
Cisplatin has antitumorigenic activities against wide variety of cancers but its nephrotoxicity limits the amount given to patients. Several groups have shown that cisplatin caused nephrotoxicity is a result of TNF-α release [14–16]. TNF-α is a proinflamatory cytokine, involved in diseases such as arthritis and multiple sclerosis. Its binds to two receptors, tumor necrosis factor receptor 1 (TNFR1) and tumor necrosis factor 2 (TNFR2) [17-21]. In B6 PTC (proximal tubular cells) cells (from C57BL/6 (B6) mice) cisplatin treatment increases TNF-α production and Fas expression [14]. TNF-α release in cell culture medium and Fas activation led to cell death in mice proximal tubular cells [14]. Hence, agents that sensitize cells to low dose of cisplatin will result in fewer side effects for the patient.
This study demonstrated that POH inhibited the growth of human breast cancer cells (MDA-MB-231, MDA-MB-435 and MCF-7) and induced apoptosis. The novel finding in the study is that POH (IC20), MJ (IC20) and cisplatin (1μM) in combination showed synergistic effects in growth inhibition in MDA-MB-435 and MDA-Mb-231 cells. The IC50 for cisplatin is 600 μM and in combination with POH and MJ it decreases to 1 μM which is a 600 fold in increase in sensitivity to cisplatin. In MDA-MB-231 cells in the presence of POH and MJ 1200 fold increase in sensitivity to cisplatin was observed. It was determined that combination treatment increased TNFR1 expression and decreased mitochondrial membrane potential in MDA-MB-435 and MDA-MB-231 cells.
Materials and methods
Chemicals and reagents
Cell culture media (MEM), fetal bovine serum (FBS) and penicillin (1000 units/ml) and streptomycin (1000 μg/ml) (P/S) were purchased from GIBCO (Grand Island, NY). Cis-jasmone (CJ), methyl jasmonate (MJ), cisplatin, propidium iodide (PI) and ribonuclease were obtained from Sigma Chemical Company (St. Louis, MO). Phosphate buffered saline (PBS, lacking Ca2+ and Mg2+) was purchased from Invitrogen Corporation (Grand Island, NY). All other reagents and chemicals were of the purest grade and were obtained from reputable vendors.
Cell culture
Breast cancer cell lines (MDA-MB-231, MDA-MB-435, and MCF7) were obtained from ATCC (Manassas, VA). All cultures were maintained in MEM supplemented with 10% FBS, 1% of penicillin and streptomycin (1000units/ml) and HEPES buffer. All the cultures were maintained at 37°C in humidified 5% CO2 atmosphere. During exposure to the compounds medium was replaced with treatment medium containing various agents while control cells received medium with DMSO (0.1%-0.3%).
Cytotoxicity assay
Cells (5000) were plated in a 96-well plate and incubated overnight to adhere to the plate. Cells were exposed to varying concentrations of cisplatin and POH for 24hr. For combination treatments MDA-MB-435 and MDA-MB-231cells were exposed to either two or three compounds for 24 hr. The concentration of POH or MJ was always at a dose that resulted in 20% decrease in cell viability (IC20) by the individual compound. Two agent combinations included: cisplatin and POH, cisplatin and MJ as well as POH and MJ, while the three agent combinations included POH, MJ and cisplatin. At termination the medium was replaced with 100μl of fresh medium, 10μl of alamarBlue was added and incubated for 4 hr. After 4 hr fluorescence was measured at 530 nm excitation and 590 nm emission wavelengths with Genios fluorescence plate reader (PHENIX Research Products, Hayward, CA). Cell viability was calculated as percentage of control (100%).
Colony formation assay
The long-term (delayed) cytotoxic effects of agents on the breast cancer cells were determined using the colony formation assay (CFA). The cells were exposed to 0.5, 1.0 and 2.0 mM concentrations for 24 hr. The treatment medium was poured off and the cells were washed with 1× PBS, harvested with trypsin EDTA, counted and replated into 60mm dishes. Cells were incubated in humidified CO2 atmosphere at 37°C for 11 days. The medium was decanted and cells were stained with crystal violet (0.5g/100ml in 95% ethanol). Colonies (>50 cells/colony) were counted and the percentage survival was calculated relative to the control (100%) group.
Cell cycle analysis by propidium iodide
Cells (0.5×10⁶) were plated in 100mm tissue culture plates, incubated overnight to adhere to the plate. Cells were exposed to 2mM POH for 24hr and washed with 1× PBS. Fresh complete medium was added and incubated for 24hr. For combination treatments cells were exposed to either two or three compounds for 24 hr. The concentration of POH or MJ was always at a dose that resulted in 20% decrease in cell viability (IC20) by the individual compound. Two agent combinations included: cisplatin and POH, cisplatin and MJ as well as POH and MJ, while the three agent combinations included POH, MJ and cisplatin. Cells were harvested with trypsin EDTA, washed with PBS, counted, fixed with 100μl of PBS and 900μl of absolute ethanol and stored at 4°C prior to DNA content analyses. Samples were stained with DNA staining solution containing 150μg/ml of PI, 0.1% Triton x-100 and 1mg/ml of RNase-A (DNase free) (1:1:1 by volume) and incubated in the dark for an hour. Acquisition of the data was carried out with a FACSCalibur flow cytometer (Becton Dickinson, Sanjose, CA) and analyzed with ModfitLT 3.0 software (Verity Software House, Topsham, ME).
Detection of apoptosis by Hoechst
Cells (1×10⁴) were plated in 4-well slides and incubated for 24hr before treatment. Cells were exposed to 2mM POH for 24hr, at termination medium was aspirated off and stained with Hoechst (2μg/ml Hoechst) for 15min. Morphological changes indicative of apoptosis were observed and the images were acquired with fluorescence microscopy (Nikon Instruments Inc. Melville, NY). The number of cells in the bright field and Hoechst stained cells were counted and percentage of apoptotic cells was calculated as: % apoptosis = (Number of Hoechst positive cells/Number of cells in bright field) × 100.
TNFR1 expression and TNF- α detection
TNFR1 expression was measured by flow cytometry [20]. MDA-MB-435 and MDA-MB-231 cells were plated and incubated for 48 hr. Cells were exposed to different combinations of cisplatin, POH and MJ (IC20 POH and MJ or IC20 POH and cisplatin (1μM) or IC20 MJ and cisplatin as well as combination of IC20POH, IC20MJ and cisplatin) for 24 hr. Following exposure cells were harvested by scraping in PBS-EDTA, counted and 1× 10⁶ cells were incubated in 50% FBS at 4°C for 15 min. Cells were washed with PBS-FBS (PBS with 1% FBS added) and incubated with 25μg/ml anti-human TNFR1 antibodies (R&D Systems, Emeryville CA) at 4°C for 60 min. Subsequently cells were washed three times in PBS-FBS and incubated with FITC- conjugated goat anti-rat IgG (1:40 dilution) at 4°C for 2 hr. Cells were washed in PBS-FBS three times and analyzed with FACS Calibur flow cytometer. Fluorescence data was collected and background fluorescence was determined using unstained cells. TNF- α release was measured by ELISA according to manufacturer's protocol (BD Biosciences, SanJose CA). MDA-MB-435 cells were plated and incubated for 48 hr. Cells were exposed to different combinations of cisplatin, POH and MJ (IC20 POH and IC20MJ or IC20 POH and cisplatin (1μM) or IC20 MJ and cisplatin as well as combination of IC20POH, IC20MJ and cisplatin) for 24 hr. Medium was collected and TNF-α release was measured.
Mitochondrial membrane potential studies
Mitochondrial membrane potential was measured as described in manufacturer's protocol (Cell technology, Mountain View CA). Mitochondrial membrane potential detection kit, uses a fluorescent cationic dye, JC-1 (5,5′, 6,6′-tetrachloro-1,1′,3,3′ tetraethylbenzimidazolylcarbo-cyanine iodide) to signal the loss of mitochondrial membrane potential. In non-apoptotic cells, the dye accumulates in the mitochondrial matrix stains the mitochondria bright red and in apoptotic cells, due to mitochondrial membrane potential collapse JC-1 cannot accumulate with in the mitochondria and hence it remains in the cytoplasm in a green fluorescent monomeric form. MDA-MB-435 and MDA-MB-231 cells were plated and incubated for 48 hr. Cells were exposed to different combinations of cisplatin, POH and MJ. Two drug combination included IC20 POH and MJ or IC20 POH and cisplatin (1μM) or IC20 MJ and cisplatin. Three drug combinations included IC20POH, IC20MJ and cisplatin (1μM) for 24 hr. At termination cells were harvested, counted, washed with PBS, 0.5 × 10⁶ cells were stained with JC-1 reagent and incubated for 15 min at 37° C. Cells were washed twice with assay buffer (provided by manufacturer) and membrane potential was measured by flow cytometry.
Statistical analyses
The results were presented as Mean ± SEM of replicate analyses accompanied by the number of independent experiments. Statistical analyses were performed using one or two tailed t-test (Graphpad Software Inc., San Diego CA and Microsoft Excel). Differences at p<0.05 or better were considered statistically significant.
Results
POH inhibited the proliferation of breast cancer cells
The proliferation inhibition of breast cancer cells was determined by cytotoxicity assay using almarBlue dye. POH inhibited breast cancer cell growth in vitro. MDA-MB-231 and MDA-MB-435 were the most sensitive to POH (Figure 1A). The concentration of POH at which 20% of MDA-MB-231 cells growth (IC20) was inhibited after 24 hr treatment was 0.76 mM, 0.6 mM for MDA-MB-435 and 0.8 mM for MCF-7 cells (Figure 1A). Long-term proliferation inhibition of breast cancer cells by POH was evaluated by clonogenic survival assay (Figure 1B). The concentration of POH at which 50% of MDA-MB-231 cells proliferation was inhibited after 24 hr treatment was 1.5 mM, 1.5 mM for MDA-MB-435 and 0.8 mM for MCF-7 cells (Figure 1B). At 1mM POH MCF-7 cells showed 25% survival whereas MDA-MB-231 and MDA-MB-435 cells showed 95% survival. POH at 2mM resulted in 2% survival in all three cell lines (Figure 1B).
Figure 1.
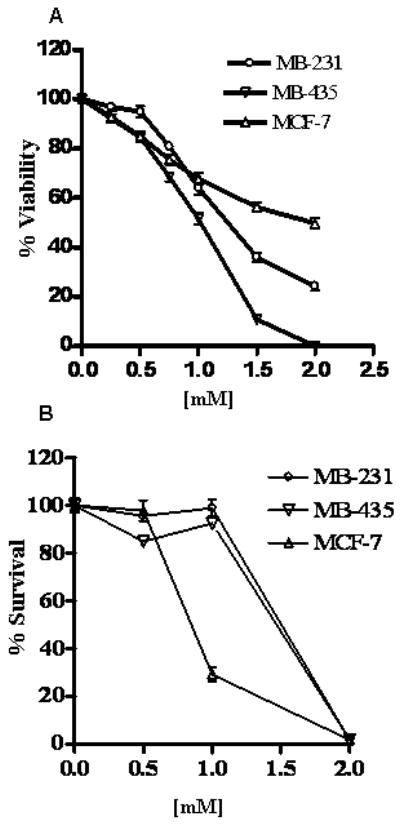
Cytotoxicity of POH on human breast cancer cells MDA-MB-231, MDA-MB-435 and MCF-7. Panel A: MDA-MB-231, MDA-MB-435 and MCF-7 cells were exposed to varying concentrations of POH for 24 hr and viability was measured by mitochondrial dehydrogenase assay as explained in the methods section. Cell viability was calculated as a percentage of untreated cells (100%). Values were Mean±SEM (n=6); results are representative of three independent experiments. A one tailed t-test was carried out and at concentrations of 1 mM and above a statistically significant (p < 0.0001) decrease in viability was observed. Panel B: POH inhibited the long-term proliferation of breast cancer cells. Cells were exposed to varying concentrations of POH and percent survival was determined as explained in the methods section. MDA-MB-231 and MDA-MB-435 cells showed significant decrease in survival at 2mM POH (p<0.001) whereas in MCF-7 cells both 1 and 2 mM POH caused significant decrease in survival (one tailed t-test, p<0.001). Values were Mean±SEM (n=3); results are representative of two independent experiments.
Combination studies were conducted in MDA-MB-435 and MDA-MB-231 cells. Three drug combination (POH, MJ and cisplatin) showed lowest growth compared to two drug combination in both cell lines (Figure 3A and 3B). POH and MJ together showed only 39% growth inhibition in MDA-MB-435 cells and 57% in MDA-MB-231 cells (supplemental file). However three drug combination at lowest cisplatin concentration studied (IC20POH, IC20MJ and 1μM cisplatin) showed 68% growth inhibition in MDA-MB-435 and 98% growth inhibition in MDA-MB-231 cells (Figure 3A and 3B). The combination index (CI) value was calculated to determine drug interactions. CI value significantly lower than 1(CI<1) indicates synergy, CI value higher than 1(CI>1) indicates antagonism and CI value not higher or lower than one indicates additive (CI=1). In both MDA-MB-435 and MDA-MB-231 cells POH and cisplatin treatment CI value indicated antagonism, where as MJ and cisplatin treatment resulted in additive effect. In addition to that three drug combination (POH, MJ and cisplatin) treatment showed synergism.
Figure 3.
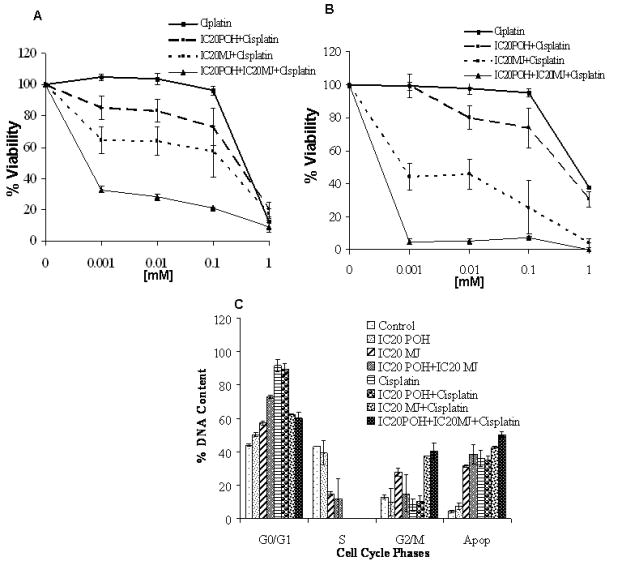
Panel A: MDA-MB-435 Cells were exposed to cisplatin alone, cisplatin with IC20 POH, cisplatin with IC20 MJ and cisplatin with IC20POH and IC20MJ. Combination of POH, MJ and cisplatin enhanced growth inhibition compared to the drugs in combination of two. Values are Mean±SEM; results are representative of duplicate analyses of two separate experiments. Panel B: MDA-MB-231 Cells were exposed to cisplatin alone, cisplatin with IC20 POH, cisplatin with IC20 MJ and cisplatin with IC20POH and IC20MJ. Combination of POH, MJ and cisplatin enhanced growth inhibition compared to the drugs in combination of two. Values are Mean±SEM; results are representative of duplicate analyses of two separate experiments. Panel C: Cells were exposed to POH, MJ and cisplatin as explained in methods section. A significant G0/G1 block was observed at all combinations that were studied with increasing the sub-diploid populations. (Two tailed t-test, p<0.05)
POH induced cell cycle arrest and apoptosis in breast cancer cells
To investigate the cell cycle arrest, DNA content analyses was carried out by propidium iodide staining using flow cytometry. POH showed a block in the cell cycle and also induced apoptosis in breast cancer cell lines (Figure 2). POH induced G0/G1 arrest with increasing the sub-diploid population (apoptotic population) in MDA-MB-231 (Figure 2A and 2B), MDA-MB-435 (Figure 2C and 2D) and MCF-7 (Figure 2E and 2F) cells. Studies with combination treatments showed a G0/G1 block at all combinations that were studied with increasing sub-diploid population (Figure 3C).
Figure 2.
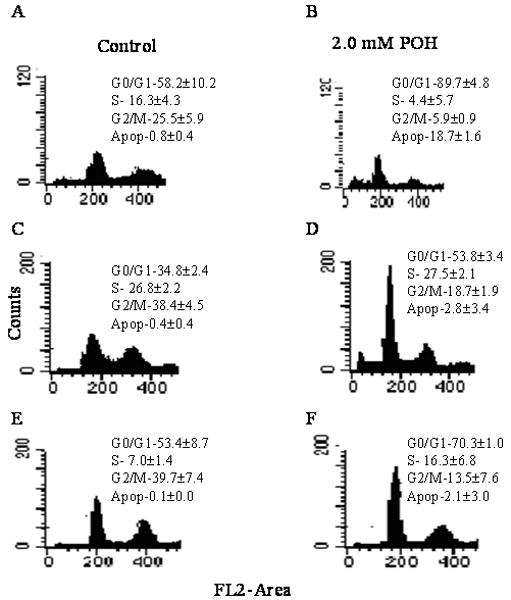
Representative histograms of breast cancer cell lines exposed to 2mM POH. Panel A: MDA-MB231 cells were exposed to 0.2% DMSO for 24 hr to compensate for the DMSO present in cisplatin treated cells. Panel B: MDA-MB-231 cells were exposed to 2 mM POH for 24 hr. Panel C: MDA-MB-435 cells were exposed to 0.2% DMSO for 0, 24 hr. Panel D: MDA-MB-435 cells were exposed to 2 mM POH for 24 hr. Panel E: MCF-7 cells were exposed to 0.2% DMSO for 24 hr Panel F: MCF-7 cells were exposed to 2 mM POH for 24 hr. POH induced significant G0/G1 (two tailed t-test, p<0.01) arrest in all three cell lines studied. Values are Mean±SEM; results are representative of duplicate analyses of two separate experiments
POH induced apoptosis in breast cancer cells (Table 1). To further confirm apoptosis induction cells were stained with Hoechst, images were acquired with fluorescence microscopy and percent of apoptotic cells was calculated as explained in methods. POH showed significant increase in apoptosis with breast cancer cell lines (Table 1). POH induced 33.7% apoptosis in MDA-MB-231, 12.1% in MDA-MB-435 and 12.6% in MCF-7 respectively (Table 1)
Table 1.
POH induced apoptosis in breast cancer cells
| Cell lines | Control | 2.0mM POH |
|---|---|---|
| MDA-MB-231 | 9.84±0.16 | 33.7±5.71 |
| MDA-MB-435 | 2.2±0.87 | 12.1±2.14 |
| MCF-7 | 2.0±2.0 | 12.6±2.33 |
POH showed significant increase in apoptotic population compared to the control in all three breast cancer cells (one tailed t-test; p<0.01).
TNFR1 activation and TNF-α detection
TNFR1 activation was measured by flow cytometry. TNFR1 activation was observed in combination treatments in MDA-MB-435 and MDA-MB-231 cells. A shift in fluorescence intensity of histograms was observed in POH and MJ, POH and cisplatin, MJ and cisplatin as well as in POH, MJ and cisplatin treatments (Figure 4 and 5). The largest increase in fluorescence intensity was observed with the combination treatment of POH, MJ and cisplatin in both cell lines (Figure 4 and 5). The results indicated that three drugs (POH, MJ and cisplatin) in combination activated larger amounts of TNFR1 in MDA-MB-435 and MDA-MB-231 cells compared to drugs in combination of two (POH and MJ, POH and cisplatin as well as MJ and cisplatin) (Figure 4 and 5). A shift in fluorescence intensity was quantitated and shown in Figure 4I and 5I. However in MDA-MB-231 cells POH and MJ treatment as well as POH, MJ and cisplatin (1μM) showed similar increase in TNFR1 expression. TNF- α release was measured by ELISA as described in materials and methods. Though TNFR1 expression was increased in combination treatments (POH, MJ and cisplatin), compared to the control TNF- α release was not significant (Figure 5B).
Figure 4.
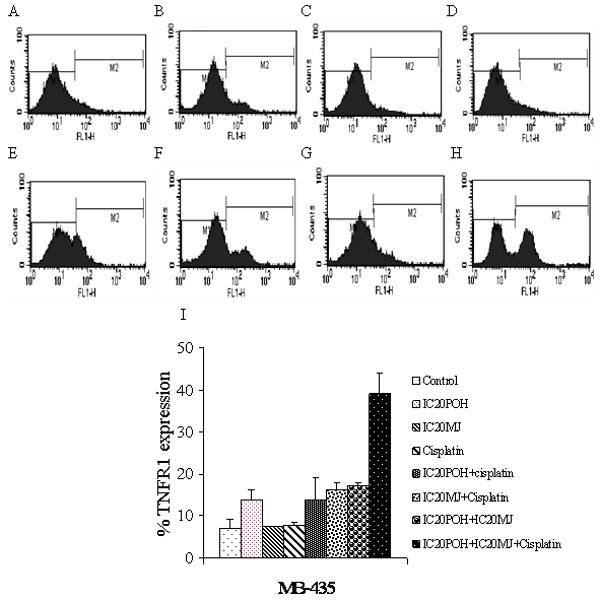
In MDA-MB-435 cells activation of TNFR1 was measured by flow cytometry. Panel A: Cells were exposed to 0.2% DMSO to compensate for the DMSO present in cisplatin treated cells. Panel B: Cells were exposed to IC20 POH for 24 hr. Panel C: Cells were exposed to IC20 MJ for 24 hr. Panel D: Cells were exposed to cisplatin (1μM) for 24 hr. Panel E: Cells were exposed to IC20 POH and IC20 MJ for 24 hr. Panel F: Cells were exposed to IC20 POH and cisplatin (1μM). Panel G: Cells were exposed to IC20 MJ and cisplatin (1μM). Panel H. Cells were exposed to IC20 POH, IC20 MJ and cisplatin (1μM) for 24 hr. Panel I. FACS results quantitation of M2 peak (shift in fluorescence) from A-H. Increased TNFR1 expression was observed only in combination treatments (POH and MJ, POH and cisplatin, MJ and cisplatin as well as in POH, MJ and cisplatin treated cells) which was determined by a shift in fluorescence intensity of histograms. Results are representative of two independent experiments.
Figure 5.
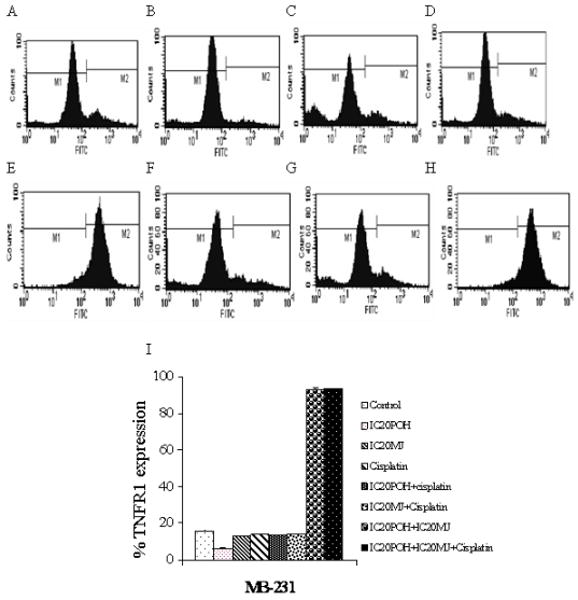
In MDA-MB-231 cells expression of TNFR1 was measured by flow cytometry. Panel A: Cells were exposed to 0.2% DMSO to compensate for the DMSO present in cisplatin treated cells. Panel B: Cells were exposed to IC20 POH for 24 hr. Panel C: Cells were exposed to IC20 MJ for 24 hr. Panel D: Cells were exposed to cisplatin (1μM) for 24 hr. Panel E: Cells were exposed to IC20 POH and IC20 MJ for 24 hr. Panel F: Cells were exposed to IC20 POH and cisplatin (1μM). Panel G: Cells were exposed to IC20 MJ and cisplatin (1μM). Panel H. Cells were exposed to IC20 POH, IC20 MJ and cisplatin (1μM) for 24 hr. Panel I. FACS results quantitation of M2 peak (shift in fluorescence) from A-H. Increased TNFR1 expression was observed only in combination treatments (POH and MJ, as well as in POH, MJ and cisplatin treated cells) which was determined by a shift in fluorescence intensity of histograms. Results are representative of two independent experiments.
Mitochondrial membrane potential detection
To determine the involvement of mitochondria in combination treatment of POH, MJ and cisplatin mitochondrial membrane potential was measured by flow cytometry. It was demonstrated that mitochondrial membrane potential was decreased in combination treatments compared to the control. The highest decrease in mitochondrial membrane potential was observed with combination treatments of POH and MJ as well as with POH, MJ and cisplatin. This is consistent in both breast cancer cell lines (MDA-MB-435 and MDA-MB-231).
Discussion and conclusion
Combination therapies will provide an alternate treatment option to reduce the toxicity and increase the efficacy of single agent therapy. To the best of our knowledge this is the first report to demonstrate that POH, MJ and cisplatin in combination resulted in growth inhibition. DNA content analysis with combination treatments showed a G0/G1 block with increasing hypo-diploid population (apoptosis). Studies on the mitochondrial membrane potential and TNFR1 indicated decreased mitochondrial membrane potential and activation of TNFR1 in POH and MJ, POH and cisplatin, MJ and cisplatin as well as POH, MJ and cisplatin treatments. The results are consistent in two different breast cancer cell lines studied (MDA-MB-435 and MDA-MB-231).
Previous studies reported that POH inhibited the growth of lung, prostate and colon cancer cells [2, 4, and 5]. It has been reported that POH induced G0/G1 block in lung and colon cancer cells as well as G2/M block in prostate cancer cells with increasing the apoptotic population [2, 4, and 7]. Along similar lines this study demonstrated that POH inhibited growth, induced a G0/G1 block and caused apoptosis in breast cancer cells. Previous studies on MJ showed cytotoxic effects at 1- 5 mM range in lung and leukemia cells [9-11]. Cisplatin at 6.6μM inhibited 48% cell growth and combination with 50-100μM silibinin resulted in 63-80% growth inhibition of prostate cancer cells [22]. Current study demonstrated that cisplatin at 1μM concentration showed 2 % growth inhibition whereas with IC20POH and IC20 MJ showed 68 % growth inhibition in MDA-MB-435 cells (Figure 3A). In MDA-MB-231 cells 1μM cisplatin does not show growth inhibition but with IC20POH and IC20MJ 98% growth inhibition was observed (Figure 3B). The IC50 (50% growth inhibition) value of cisplatin in MDA-MB-435 cells was 0.6 mM and in MDA-MB-231 cells 0.7 mM (Figure 3A and 3B). Cisplatin in combination with IC20POH and IC20MJ the IC50 was decreased to 1 μM in MDA-MB-435 cells which is a 600 fold shift in IC50 (Figure 3B). In MDA-MB-231 cells the IC50 has reduced to 0.5 μM, 1200 fold shift in IC50 (Figure 3B). This indicated that treatment of breast cancer cells with plant compounds increased cisplatin cellular toxicity.
Earlier reports on combination studies with POH and cisplatin demonstrated that POH sensitized prostate cancer cells to cisplatin and activated the Fas mediated death pathway and decreased mitochondrial membrane potential [7, 23]. Cisplatin was reported to release TNF-α into the cell culture medium and activated TNFR1 in proximal tubular cells [15, 16]. Cisplatin in combination with compound herbal medicinal prescription showed synergestic effects in proliferation inhibition in ovarian cancer cells (SKOV3). Mechanistic studies indicated TNFR1 activation in the SKOV3 cells [24]. In our previous studies it was determined that MJ activated TNFR1 in prostate and breast cancer cells and decreased membrane potential in breast cancer cells (25, 26). In addition to that TNF-α release (Figure 6B) was measured in combination treatments and did not observe any significant increase in TNF-α release compared to the control (Figure 6C). Taken together all these observations and the combination studies demonstrate that POH, MJ and cisplatin treatment activates TNFR1 and decreases mitochondrial membrane potential. The proposed mechanism for growth inhibition with combination treatment includes activation of TNFR1 as well as mitochondrial membrane potential decrease by cisplatin, MJ and POH.
Figure 6.
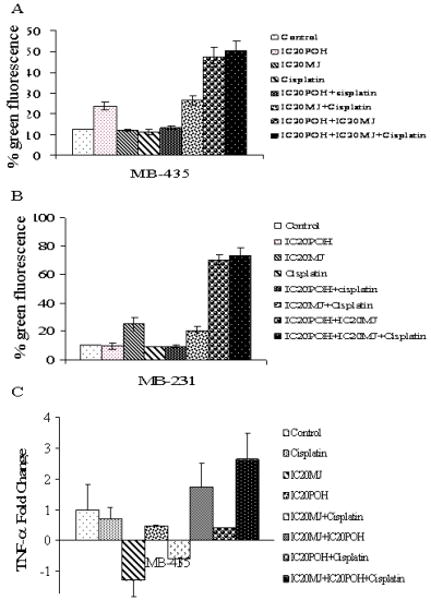
Panel A. Mitochondrial membrane potential was determined in breast cancer cells using a fluorescent dye as explained in methods section. In column graph Lane 1 is MDA-MB-435 cells treated with DMSO. Lane 2: Cells were exposed to IC20 POH for 24 hr. Lane 3: Cells were exposed to IC20 MJ for 24 hr. Lane 4: Cells were exposed to 1μM cisplatin for 24 hr. Lane 5: Cells were exposed to IC20 POH and 1μM cisplatin for 24 hr. Lane 6: Cells were exposed to IC20 MJ and 1μM cisplatin. Lane 7: Cells were exposed to IC20POH and IC20 MJ for 24 hr. Lane 8: Cells were exposed to IC20POH, IC20 MJ and 1μM cisplatin. In MDA-MB-435 cells an increase in green fluorescence indicated decreased membrane potential. Panel B: In column graph Lane 1 is MDA-MB-231cells treated with DMSO. Lane 2: Cells were exposed to IC20 POH for 24 hr. Lane 3: Cells were exposed to IC20 MJ for 24 hr. Lane 4: Cells were exposed to 1μM cisplatin for 24 hr. Lane 5: Cells were exposed to IC20 POH and 1μM cisplatin for 24 hr. Lane 6: Cells were exposed to IC20 MJ and 1μM cisplatin. Lane 7: Cells were exposed to IC20POH and IC20 MJ for 24 hr. Lane 8: Cells were exposed to IC20POH, IC20 MJ and 1μM cisplatin. In MDA-MB-231 cells an increase in green fluorescence indicated decreased membrane potential. Panel C: TNF-α release was measured in MDA-MB-435 cells as described in methods section. Compared to the control there was no significant increase in TNF--α release in combination treatments (POH+MJ, MJ+cisplatin, POH+cisplatin, and POH+MJ+cisplatin) in MDA-MB-435 cells.
Cancer patients have disadvantages with single agent therapy such as side effects and severe toxicity. Combination studies involving two or more agents to reduce toxicity and improve efficacy of chemotherapy will provide new avenues for cancer treatment. It is possible that three compounds studied here could have independent fates once in the human body. However previously it has been proposed that POH and MJ induce mitochondrial mediated apoptosis, hence by combining compounds which induce similar signaling pathways at very low dosages with cisplatin would be advantageous and could be less toxic to cancer cells. Future animal and in vivo studies would evaluate drug distribution and different fates of these compounds in the body. In addition to that scheduling and mechanistic studies at different doses need to be carried out to improve the efficacy of cisplatin.
Supplementary Material
Acknowledgments
The authors thank Shirly Shen for her technical assistance. This research was supported in part by ACS grant #IRG-103719 (to JAE) and in part by NIH Grant Number 2 P20 RR 016464 from the INBRE Program of the National Center for Research Resources.
Footnotes
Publisher's Disclaimer: This is a PDF file of an unedited manuscript that has been accepted for publication. As a service to our customers we are providing this early version of the manuscript. The manuscript will undergo copyediting, typesetting, and review of the resulting proof before it is published in its final citable form. Please note that during the production process errors may be discovered which could affect the content, and all legal disclaimers that apply to the journal pertain.
References
- 1.American Cancer Society. Cancer Facts & Figures. American Cancer Society Inc.; Atlanta, GA: 2007. [Google Scholar]
- 2.Elegbede JA, Flores R, Wang RC. Perillyl alcohol and perillaldehyde induced cell cycle arrest and cell death in BroTo and A549 cells cultured in vitro. Life Sci. 2003;73:2831–2840. doi: 10.1016/s0024-3205(03)00701-x. [DOI] [PubMed] [Google Scholar]
- 3.Ezekwudo D, Shashidharamurthy R, Devineni D, Bozeman E, Palaniappan R, Selvaraj P. Inhibition of expression of anti-apoptotic protein Bcl-2 and induction of cell death in radioresistant human prostate adenocarcinoma cell line (PC-3) by methyl jasmonate. Cancer Lett. 2008;270:277–285. doi: 10.1016/j.canlet.2008.05.022. [DOI] [PubMed] [Google Scholar]
- 4.Bardon S, Foussard V, Fournel S, Loubat A. Monoterpenes inhibit proliferation of human colon cancer cells by modulating cell cycle-related protein expression. Cancer Lett. 2002;181:187–194. doi: 10.1016/s0304-3835(02)00047-2. [DOI] [PubMed] [Google Scholar]
- 5.Bardon S, Picard K, Martel P. Monoterpenes inhibit cell growth, cell cycle progression, and cyclin D1 gene expression in human breast cancer cell lines. Nutr Cancer. 1998;32:1–7. doi: 10.1080/01635589809514708. [DOI] [PubMed] [Google Scholar]
- 6.Gómez-Contreras PC, Hernández-Flores G, Ortiz-Lazareno PC. In vitro induction of apoptosis in U937 cells by perillyl alcohol with sensitization by pentoxifylline: Increased Bcl-2 and Bax protein expression. Chemotherapy. 2006;52:308–315. doi: 10.1159/000096003. [DOI] [PubMed] [Google Scholar]
- 7.Rajesh D, Howard SP. Perillyl alcohol mediated radiosensitization via augmentation of the Fas pathway in prostate cancer cells. The prostate. 2003;57:14–23. doi: 10.1002/pros.10269. [DOI] [PubMed] [Google Scholar]
- 8.Rajesh D, Stenzel RA, Howard SP. Perillyl alcohol as a radio-/chemosensitizer in malignant glioma. J Biol Chem. 2003;278:35968–35978. doi: 10.1074/jbc.M303280200. [DOI] [PubMed] [Google Scholar]
- 9.Rotem R, Heyfets A, Fingrut O, Blickstein D, Shaklai M, Flescher E. Jasmonates: novel anticancer agents acting directly and selectively on human cancer cell mitochondria. Cancer Res. 2005;65:1984–1993. doi: 10.1158/0008-5472.CAN-04-3091. [DOI] [PubMed] [Google Scholar]
- 10.Yeruva L, Pierre KJ, Carper SW, Elegbede JA, Toy BJ, Wang RC. Jasmonates induce apoptosis and cell cycle arrest in non-small cell lung cancer lines. Exp Lung Res. 2006;32:499–516. doi: 10.1080/01902140601059604. [DOI] [PubMed] [Google Scholar]
- 11.Heyfets A, Flescher E. Cooperative cytotoxicity of methyl jasmonate with anti-cancer drugs and 2-deoxy-D-glucose. Cancer Lett. 2007;250:300–310. doi: 10.1016/j.canlet.2006.10.013. [DOI] [PubMed] [Google Scholar]
- 12.Galluzzi L, Kepp O, Tajeddine N, Kroemer G. Disruption of the hexokinase-VDAC complex for tumor therapy. Oncogene. 2008;27:4633–4635. doi: 10.1038/onc.2008.114. [DOI] [PubMed] [Google Scholar]
- 13.Pinton P, Ferrari D, Di Virgilio F, Pozzan T, Rizzuto R. Molecular machinery and signaling events in apoptosis. Drug Dev Res. 2001;52:558–570. [Google Scholar]
- 14.Tsuruya K, Ninomiya T, Tokumoto M, Hirakawa M, Masutani K, Taniguchi M, et al. Direct involvement of the receptor-mediated apoptotic pathways in cisplatin-induced renal tubular cell death. Kidney Int. 2003;63:72–82. doi: 10.1046/j.1523-1755.2003.00709.x. [DOI] [PubMed] [Google Scholar]
- 15.Ramesh G, Reeves WB. TNFR2-mediated apoptosis and necrosis in cisplatin induced acute renal failure. Am J Physiol Renal Physiol. 2003;285:F610–F618. doi: 10.1152/ajprenal.00101.2003. [DOI] [PubMed] [Google Scholar]
- 16.Ramesh G, Kimball SR, Jefferson LS, Reeves WB. Endotoxin and cisplatin synergistically stimulate TNF-{alpha} production by renal epithelial cells. Am J Physiol Renal Physiol. 2007;292:F812–F819. doi: 10.1152/ajprenal.00277.2006. [DOI] [PubMed] [Google Scholar]
- 17.Ashkenazi A, Dixit VM. Death receptors: Signaling and modulation. Science. 1998;281:1305–1308. doi: 10.1126/science.281.5381.1305. [DOI] [PubMed] [Google Scholar]
- 18.Baud V, Karin M. Signal transduction by tumor necrosis factor and its relatives. Trends Cell Biol. 2001;11:372–377. doi: 10.1016/s0962-8924(01)02064-5. [DOI] [PubMed] [Google Scholar]
- 19.Mathiasen IS, Hansen CM, Foghsgaard L, Jaattela M. Sensitization to TNF-induced apoptosis by 1, 25-dihydroxy vitamin D3 involves up-regulation of the TNF receptor 1 cathepsin B. Int J Cancer. 2001;93:224–231. doi: 10.1002/ijc.1325. [DOI] [PubMed] [Google Scholar]
- 20.Jin Z, EI-diery WS. Overview of cell death signaling pathways. Cancer Biol Ther. 2005;4:139–163. doi: 10.4161/cbt.4.2.1508. [DOI] [PubMed] [Google Scholar]
- 21.Smolnikar K, Loffek S, Schulz T, Michna H, Diel P. Treatment with the pure antiestrogen faslodex (ICI182780) induces tumor necrosis factor receptor 1 (TNFR1) expression in MCF-7 breast cancer cells. Breast Cancer Res Treat. 2000;63:249–259. doi: 10.1023/a:1006490416408. [DOI] [PubMed] [Google Scholar]
- 22.Dhanalakshmi S, Agarwal P, Glode LM, Agarwal R. Silibinin sensitizes human prostate carcinoma DU145 cells to cisplatin- and carboplatin-induced growth inhibition and apoptotic death. Int J Cancer. 2003;106:699–705. doi: 10.1002/ijc.11299. [DOI] [PubMed] [Google Scholar]
- 23.Jing XB, Cai XB, Hu H, Chen SZ, Chen BM, Cai JY. Reactive oxygen species and mitochondrial membrane potential are modulated during CDDP-induced apoptosis in EC-109 cells. Biochem Cell Boil. 2007;85:265–271. doi: 10.1139/O07-014. [DOI] [PubMed] [Google Scholar]
- 24.Suo YP, Wang BY, Hong Z, Yin RT, Wang DQ, Peng ZL. Comparative study of that synergistic effect of cisplatin combined with compound herbal medicinal prescription for tonic quality and activating blood circulation is on SKOV3 cell proliferation and apoptosis. Sichuan Da Xue Xue Bao Yi Xue Ban. 2006;37:542–546. [PubMed] [Google Scholar]
- 25.Yeruva L, Elegbede JA, Carper SW. Methyl jasmonate decreases membrane fluidity and induces apoptosis through tumor necrosis factor receptor 1 in breast cancer cells. Anticancer Drugs. 2008;19:766–776. doi: 10.1097/CAD.0b013e32830b5894. [DOI] [PMC free article] [PubMed] [Google Scholar]
- 26.Yeruva L, Pierre KJ, Bathina M, Elegbede A, Carper SW. Delayed Cytotoxic Effects of Methyl Jasmonate and cis-Jasmone Induced Apoptosis in Prostate Cancer Cells. Cancer Invest. 2008;26:890–899. doi: 10.1080/07357900801975272. [DOI] [PubMed] [Google Scholar]
Associated Data
This section collects any data citations, data availability statements, or supplementary materials included in this article.