Abstract
Lanthanide complexes of two tris-(amide) derivatives of PCTA were synthesized and characterized. The relaxometric and luminescence properties of their lanthanide complexes were investigated as bimodal magnetic resonance (MR) and optical imaging agents. Luminescence studies show that one of the TbIII complexes dimerizes in solution at low millimolar concentrations while the other may have a higher than expected coordination number in solution. The corresponding GdIII complexes display unusually high T1 relaxivities and enhanced kinetic inertness compared to GdPCTA. These features suggest that these new chelates may be suitable for in vivo applications. The fast water exchange rates observed for these complexes make them unsuitable as paramagnetic chemical exchange saturation transfer (PARACEST) agents.
Keywords: High relaxivity agents, water exchange rates, lanthanide complexes, PARACEST
Introduction
Considerable research has been focused on the rational design of lanthanide (Ln) complexes for biomedical applications.[1–3] The LnIII-ions are hard Lewis acids and have a high affinity for oxygen donor atoms of carboxylate and phosphate groups ubiquitous in biological systems.[4] Therefore, the synthesis of ligands that can form kinetically inert chelates with the LnIII-ion plays an important role in the design of Ln-based biomedical probes. LnIII complexes of polyazamacrocyclic ligands, in particular, 1,4,7,10-tetraazacyclododecane-N,N′,N″,N‴-tetraacetic acid (DOTA) and DOTA-like ligands, are known to have high kinetic inertness and therefore suitable for in vivo applications.[5] GdIII-complexes of DOTA and HP-DO3A (hydroxypropyl-DOTA) have one metal bound water molecule which exchanges relatively rapidly with the bulk solvent water. These paramagnetic complexes are commonly used as MRI contrast agents in clinical practice (Dotarem and Prohance, respectively).[6] The presence of a rapidly exchanging inner-sphere water molecule is essential for the efficient transfer of the paramagnetic effect of GdIII to the bulk water pool. Tetraamide derivatives of DOTA have been synthesized over a decade ago but their Gd-complexes have been shown to exhibit extremely slow water exchange rate, which limits their usefulness as MRI contrast agents.[7]
Recently, however, a novel class of contrast agents (CA) known as chemical exchange saturation transfer (CEST) agents has drawn considerable interest for MRI applications.[8–15] CEST agents enhance MRI contrast by transferring selectively saturated spins from a small proton chemical pool to the bulk water proton pool. CEST requires slow-to-intermediate exchange of protons or water molecules between the two pools (Δω>kex) and the chemical shift difference (Δω) of the exchanging proton pools must be large enough to allow selective saturation of the small pool without affecting the bulk water. Hence, a large proton chemical shift difference between the pools is a distinct advantage. The firstCEST agents were diamagnetic molecules containing exchangeable -NH or -OH groups in which the chemical shift difference (Δω) was less than 5 ppm. It was later shown that DOTA-tetraamide complexes of large hyperfine shifting LnIII-ions such as DyIII, TbIII, TmIII and particularly EuIII produce large paramagnetic shifts of the metal bound water protons and may have sufficiently slow water exchange rates to satisfy the (Δω>kex) condition.[16] This observation led to the successful development of several LnDOTA-tetraamide complexes as PARACEST contrast agents.[9] Amide derivatives of other polyamino macrocyclic ligand platforms have not been studied even though the LnIII complexes of some of these ligands have satisfactory kinetic inertness as well. One such example is 3,6,9,15-tetraazabicyclo[9.3.1]pentadeca-1(15),11,13-triene-3,6,9-triacetic acid (H3PCTA) 1 in which one of the macrocyclic backbone nitrogen atoms of DOTA has been substituted by a pyridine nitrogen (Figure 1). Lanthanide complexes of PCTA have been reported to have some interesting properties such as rapid formation kinetics coupled with high kinetic inertness, long luminescent lifetime for the EuIII and TbIII complexes and high water relaxivity (q=2 complex) for the GdIII complex.[17–19]
Figure 1.
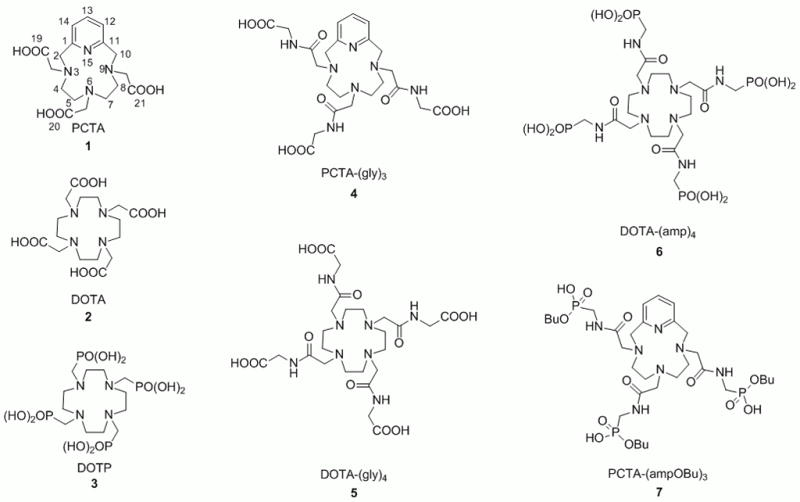
Structures of ligands discussed in this work. The atoms in PCTA are numbered to facilitate the discussion of its protonation constants (see Results and Discussion section).
Here, we report some chemical features of lanthanide complexes of PCTA-tris(amide) ligands that make them potentially useful as MRI contrast and optical imaging agents. The thermodynamic stability and kinetic inertness of some of the LnPCTA-(gly)3 complexes (Figure 1) are also discussed.
Results and Discussion
Synthesis
The synthesis of PCTA-(gly)3 is outlined in Scheme 1. Pyclen was synthesized according to published procedures.[20,21] The commercially available hydrochloride salt of tert-butyl glycinate ester was acylated with bromoacetyl bromide to give 9 in excellent yields. Pyclen was alkylated using three equivalents of 9 in the presence of potassium carbonate as a base to afford 10 which was deprotected in hydrochloric acid (3 M) to yield the HCl salt of PCTA-(gly)3. Lanthanide (III) complexes of PCTA-(gly)3 were formed by reacting the chloride salts of the metals and the ligand in aqueous solution in the pH range of 5–6.
Scheme 1.
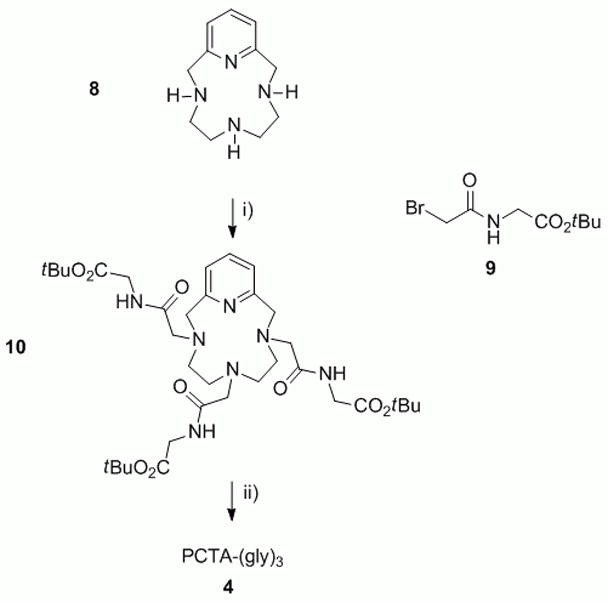
The synthesis of PCTA-(gly)3. Reagents and conditions: i) K2CO3, MeCN, 65 °C; ii) HCl, H2O.
The synthesis of PCTA-(ampOBu)3 is outlined in Scheme 2. Dibutyl phosphite was reacted with tribenzylhexahydro triazine under nitrogen gas at 100 °C to yield the benzyl protected aminomethylene dibutylphosphonate following a published procedure.[22] The protecting group was then quantitatively removed by catalytic hydrogenation using palladium on activated carbon in ethanol. The resulting free amine was acylated using chloroacetyl chloride and diisopropylethyleneamine as a base with 77% yield. Alkylation of pyclen with the resulting chloroacetamide for 7 days in the presence of potassium carbonate afforded 14 in 94% yield. The resulting dibutyl phosphonate tris-amide macrocycle was then reacted with lithium bromide at 80 °C which selectively cleaved one butyl group per arm. Cleavage of phosphonate esters under these conditions has been described elsewhere.[23–25] This approach was chosen over the use of a strong base such as sodium or potassium hydroxide to prevent hydrolysis of the amide bond. Purification by high performance liquid chromatography (HPLC) afforded PCTA-(ampOBu)3 as the trifluoroacetic salt which in turn was converted to its hydrochloride form by lyophilizing a solution of the ligand in dilute hydrochloric acid to give the desired final product.
Scheme 2.
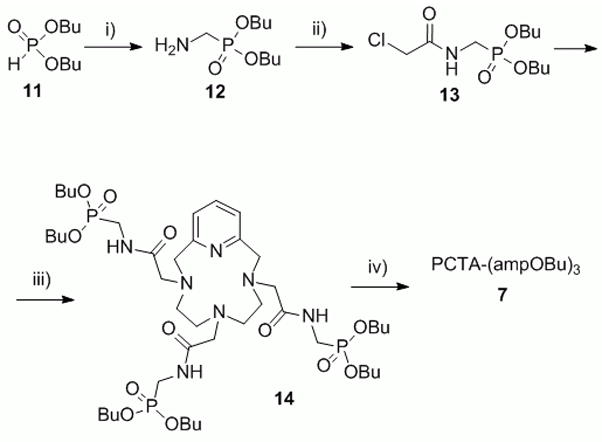
The synthetic route to PCTA-(ampOBu)3. Reagents and conditions: i) 1. 1,3,5-tribenzylhexa-hydro-1,3,5-triazine, 100 °C, 2. H2/Pd on C, EtOH ii) chloroacetyl chloride, diisopropylethylamine, dichloromethane, −97 °C; iii) pyclen, K2CO3, acetonitrile, 55 °C; iv) LiBr, 2-hexanone, 80 °C.
Lanthanide (III) complexes of PCTA-(ampOBu)3 were prepared by reacting equimolar quantities of the chloride salt of the metal with ligand in water while maintaining the pH of the solution around 6. Complexes of the water insoluble ligand 14 were prepared in methanol using lanthanide trifluoromethanesulfonate salts.
Luminescence studies
The luminescence emission spectrum of EuPCTA-(gly)3 is shown in Figure 2. As anticipated, the emission lines are quite sharp and have large Stokes shifts. This shift precludes any overlap between the emission bands of the lanthanide ion and the absorption band of the chromophore (centered at 284 nm). The shift also prevents self-quenching of emission which is frequently observed for organic fluorescent dyes, and minimizes the unwanted effects of scattered light from the excitation source.[26, 27]
Figure 2.
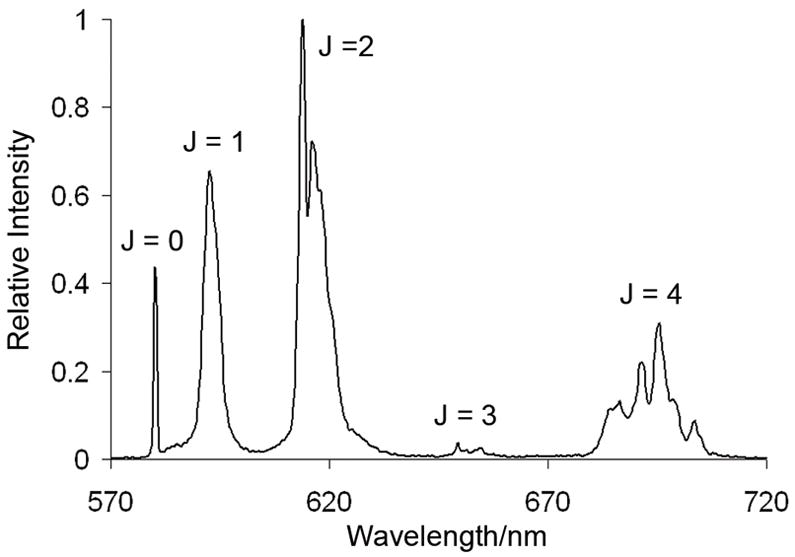
Emission spectrum of EuPCTA-(gly)3.
The monoexponential fit of the emission decay curve of EuPCTA-(gly)3 suggests the presence of a q=3 species in solution. The presence of a complex in solution bearing a third water molecule bound to its metal center is interesting, yet not entirely unexpected. Based alone on considerations of the coordination number (CN) of the lanthanide, one would expect to see no more than two water molecules in order to complete the coordination sphere of the metal in these complexes. Nevertheless, contradictory reports on the hydration number of the parent ligand PCTA can be found in the literature and point to the possibility of a third water molecule in the coordination sphere of the lanthanide ion. Kim et al. reported q values of 2.4 and 2.9 for the TbIII and EuIII complexes of PCTA based on luminescence measurements[28] while Aime et al. reported a hydration number of 2 for GdPCTA based upon fitting of the temperature dependence of the 17O transverse relaxation rate of the water-bound to the metal center.[17] Our observation, however, is important since it suggests that the lanthanide ion has an unusually high CN. A few reports of a CN higher than 9 can be found in the literature for other lanthanide chelates. Hence, Bretonnière et al. attributed the high relaxivity of the GdIII complex of their tripodal ligand TPAA to an equilibrium in solution of the tris- and bis(aqua) species of the complex, with the tris- species having a CN = 10.[29] Paschalidis measured the electronic, infrared and 1H NMR spectra of several nitrato-lanthanide (III) hydrazone complexes and found that the La, Ce and Pr complexes have CNs of 12 while the Y, Nd, Eu, Gd, Tb, Dy, Ho, Er and Yb complexes all have CNs of 10.[30] Tripathi et al. reported on La, Pr, Nd, Gd and Dy mixed DTPA-hydroxy acid complexes having coordination numbers of 10 as well.[31]
Both EuPCTA-(ampOBu)3 and TbPCTA-(ampOBu)3 display intense luminescence upon UV excitation. UV absorption and luminescence emission spectra for these complexes are shown in Figure 4. The luminescence spectra were recorded in time-gated mode (100 μsec delay) to separate the fluorescent background from the longer luminescence signal. A large Stokes shift (>200 nm) is observed between the absorption and emission in both spectra.
Figure 4.
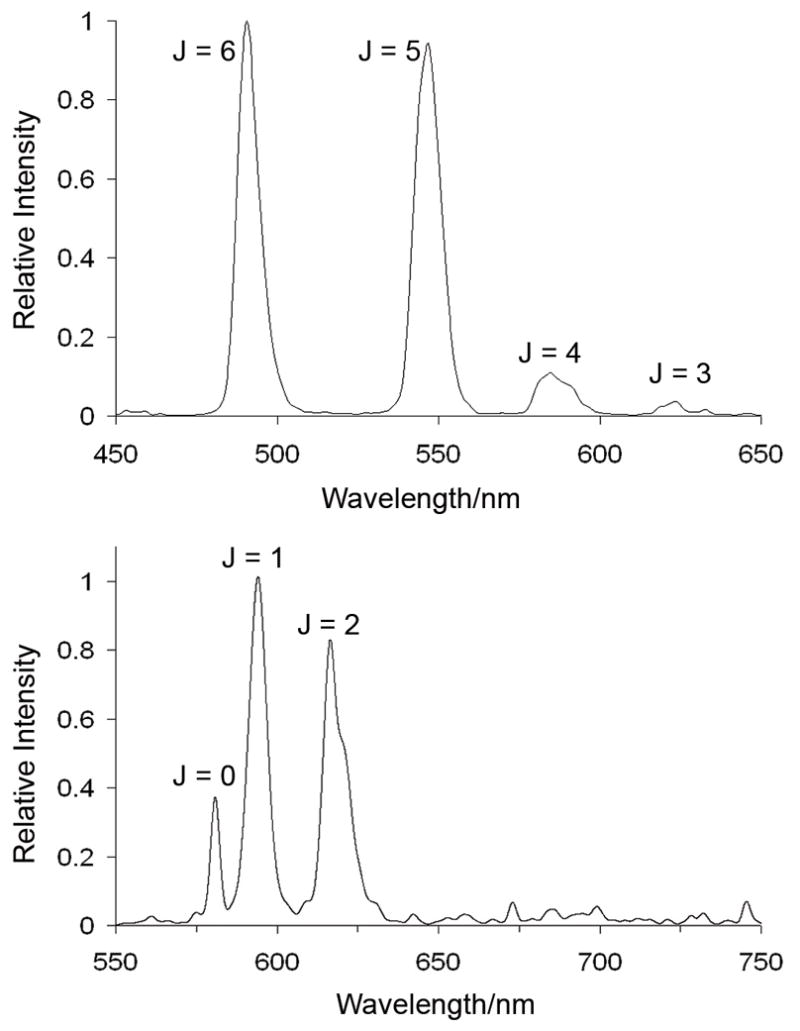
Emission spectra of TbPCTA-(ampOBu)3 (top) and of EuPCTA-(ampOBu)3 (bottom).
The emission spectra of lanthanide ions in solution or in solid state consist of sharp line-like bands resulting from f-f transitions. This particular spectral feature is a direct consequence of the shielding of the metal’s 4f electrons from the environment by an outer shell of 5s and 5p electrons.[32] The emission spectrum of TbPCTA-(ampOBu)3 shows only four of the expected five 5D4 → 7Fj emissive bands of terbium (J=6–3) (Figure 4). The spectrum is dominated by the band at 494 nm, arising from the 5D4 → 7F6 metal centered transition. The emission spectrum of EuPCTA-(ampOBu)3 also shows only three out of the five expected bands (J=0–2). For this complex, the maximum emission was observed at 594 nm, which corresponds to the 5D0 → 7F1 transition.[33].
Bruce et al.[27] have discussed the spectral characteristics of some DOTA-like complexes of EuIII based on symmetry considerations of the corresponding ligand. ΔJ=0 corresponds to the highest energy emission band in the europium 5D0 → 7Fj manifold and is formally forbidden by selection rules. For this transition, both the initial and final states are non-degenerate and only one band is expected for each EuIII species in solution. In the case of the emission spectrum of EuPCTA-(ampOBu)3, only one band is observed for this transition as expected (Figure 4). The ΔJ=1 transition is magnetically-dipole-allowed and its intensity varies relatively little with the coordination environment of the metal center. For this particular transition, three bands are expected for low symmetry systems, whereas two should be observed for complexes with C3 and C4 symmetries. Interestingly, the emission spectrum of EuPCTA-(ampOBu)3 shows only one band for this transition. The ΔJ = 2 and ΔJ = 4 transitions, known as “hypersensitive” bands, are strongly dependent on the crystal field environment of the metal ion. In the particular case of ΔJ=2, its intensity increases as symmetry of the complex decreases. Here, too, is worth noting that the emission intensity of this band relative to the ΔJ=1 band matches the pattern observed for some highly symmetric EuIII complexes with DOTA ligands,[27] suggesting the symmetry of EuPCTA-(ampOBu)3 may be higher than anticipated. The absence of the ΔJ=4 transition in the spectrum is also interesting and might be a matter that deserves further investigation. Finally, the ΔJ=3 transition in the spectrum of these complexes is typically very weak and does not yield useful information.
Figure S2 shows that the luminescence decay curves of EuPCTA-(ampOBu)3 and TbPCTA-(ampOBu)3 follow mono-exponential kinetics as expected for a single species in solution. The number of coordinated waters, q, was estimated from the measured lifetimes (Table 1).
Table 1.
Number of inner sphere water molecules, q, determined by luminescence
| Chelate | kH2O, ms−1 | kD2O, ms−1 | q (10 μM) | q (10 mM) |
|---|---|---|---|---|
| EuPCTA-(gly)3 | 3.20 | 0.50 | 3.1 | 2.9 |
| TbPCTA-(ampOBu)3 | 0.78 | 0.32 | 1.9 | 1.3 |
| EuPCTA-(ampOBu)3 | 2.45 | 0.51 | 2.0 | 1.4 |
A q value of 2 has been reported for GdPCTA,[17], and values of 2.4 and 2.9 were reported for TbPCTA and EuPCTA, respectively.[28] From Table 1, it can be seen that for both chelates, a q value of 2 is found when the experiment is performed under dilute conditions (10 μM) while more concentrated samples (1–10 mM) gave q values of 1–1.4. This suggests that the complexes may form oligomers at higher concentrations. This was later confirmed by MALDI-TOF mass spectrometry performed on the terbium complex as well as by relaxivity measurements with the GdIII-complex. The observation that lanthanide complexes of DOTA-like ligands bearing phosphonate pendant arms tend to form dimers has been reported previously.[34] These authors reported the structure of a dimer formed by a praseodymium (III) complex of a DOTA-tetra methylenephenylphosphonic acid crystallized from an aqueous solution neutralized with LiOH.
Protonation and stability constants
The protonation constants of PCTA, DOTA, and their glycinate amide analogues are summarized in Table 2. The protonation scheme of PCTA-(gly)3 is analogous to that of the parent ligand PCTA.[19, 21] The first protonation takes places at the N-atom (N6) opposite to the pyridine nitrogen (Figure 1), followed by a proton shift from this nitrogen to N3 upon the protonation of N9; (these protonation steps correspond to K1 and K2 in Table 2). This protonation pattern minimizes charge repulsion in the diprotonated macrocycle. The remaining three protonation constants (K3–5) correspond to the protonation of acetate groups. In the case of DOTA and DOTA-(gly)4, the first two protonation constants also correspond to protonation of two nitrogens in the ring followed by three of the four acetate groups.[35] The protonation constants of the nitrogens in the macrocycle ring for PCTA and DOTA are higher than those of their corresponding amides. This reflects the fact that the negatively charged acetate groups are better hydrogen bond sites for the protonated nitrogens in the ring, stabilizing the protonated form of the ligand. These intramolecular hydrogen bonds have been described in the past for both acyclic and cyclic amine systems bearing different types of pendant arms, although their effect on the protonation constants is dependant on the nature of the arm.[36, 37] The protonation constants for the glycinates in PCTA-(gly)3 and DOTA-(gly)4 are similar to or higher than those observed for PCTA and DOTA.
Table 2.
Protonation constants of PCTA-(gly)3 as measured by pH potentiometry (1.0 M KCl and 25 °C) compared to values for PCTA, DOTA and DOTA-(gly)4 from the literature.
| logKiH | PCTA [19] | PCTA-(gly)3 | DOTA(a), [38] | DOTA-(gly)4(b), [39] |
|---|---|---|---|---|
| log K1H | 11.36 | 9.35 (1) | 12.6 | 9.19 |
| log K2H | 7.35 | 4.47 (1) | 9.7 | 6.25 |
| log K3H | 3.83 | 3.73 (1) | 4.5 | 4.08 |
| log K4H | 2.12 | 3.20 (1) | 4.14 | 3.45 |
| log K5H | 1.29 | 2.72 (1) | 2.32 | 3.2 |
| log K6H | - | - | - | 1.4 |
| Σlog KiH | 25.95 | 23.46 | 33.26 | 27.57 |
In 0.1 M Me4NCl and 25 °C;
in 1.0 M KCl and 25 °C.
The total basicity (Σlog KiH) of PCTA-(gly)3 is significantly lower than that of the parent ligand PCTA (Table 2). Consequently, the stability constants of the LnPCTA-(gly)3 complexes are about 7–8 log K units lower than those of the corresponding LnPCTA complexes. The complex formation equilibrium of PCTA-(gly)3 with various metal ions can adequately be described by assuming the formation of the following complex species: ML, MHL, MH2L, MH3L, MH−1L and MH−2L. (Table 3). As expected, across the four ligands shown, the trend of the stability constants generally follows the order DOTA>PCTA>DOTA-(gly)4>PCTA-(gly)3; this is in good agreement with the overall trend observed for the basicities of these ligands. The pM values calculated with the use of ligand protonation constants and stability constants of Eu complexes shows very similar trend (Table S1, Supporting Information). The lower thermodynamic stability for the DOTA-(gly)4 complexes despite the higher total basicity of the free ligand relative to PCTA may be attributed to the fact that only noncharged donor atoms are coordinating the metal.[39] Interestingly, the only exception is MgPCTA-(gly)3, which is about two orders of magnitude more stable than MgDOTA-(gly)4. This is likely due to the more rigid, preorganized structure and perhaps slightly smaller cavity size of PCTA-(gly)3 as compared to DOTA-(gly)4. Overall, the stabilities of the LnIII complexes increase along the lanthanide series for all ligands, with PCTA-(gly)3 having a slightly higher selectivity for the smaller (heavier) lanthanides than DOTA-(gly)4. This again may reflect a more preorganized structure of the former ligand. It is worth noting that in the case of PCTA-(gly)3, the stabilities of its Cu- and Zn- complexes obey the Irving-Williams rule whereas PCTA does not.[40]
Table 3.
Stability constants for the metal complexes formed with PCTA-(gly)3 and PCTA (1.0 M KCl and 25 °C)
| Metal (M) | PCTA-(gly)3 | PCTA [19] | ||||||||
|---|---|---|---|---|---|---|---|---|---|---|
| ML | MLH | MLH2 | MLH3 | M2L | MLH−1 | MLH−2 | ML | MLH | MLH−1 | |
| Mg2+ | 6.14 (2) | - | - | - | - | - | - | 12.35 | 3.82 | - |
| Ca2+ | 8.32 (1) | 3.88 (2) | - | - | - | - | - | 12.72 | 3.79 | - |
| Cu2+ | 13.00 (5) | 4.01 (5) | 3.14 (4) | 2.95 (4) | 2.80 (8) | 4.27 (4) | - | 18.79 | 3.59 | 11.28 |
| Zn2+ | 12.31 (4) | 4.10 (3) | 3.28 (2) | 2.99 (3) | 2.64 (9) | 8.37 (7) | - | 20.48 | 3.10 | 12.31 |
| CeIII | 11.54 (3) | 3.63 (3) | 2.72 (7) | - | - | 8.99 (4) | 10.05 (9) | 18.15 | 2.89 | 11.30 |
| NdIII | 11.38 (2) | 3.79 (1) | 2.88 (2) | - | - | 8.91 (4) | 10.10 (4) | 20.15 | 2.41 | 11.63 |
| EuIII | 12.84 (1) | 3.58 (2) | 2.83 (3) | 1.7 (3) | - | 8.88 (4) | 9.74 (7) | 20.26 | - | 11.39 |
| TbIII | 13.24 (4) | 3.74 (5) | 2.96 (4) | 2.72 (5) | - | 8.82 (7) | 9.54 (8) | 20.39 | - | 11.10 |
| YbIII | 13.20 (7) | 3.72 (9) | 3.00 (8) | 2.66 (6) | - | 8.46 (6) | 9.49 (6) | 20.63 | - | 10.26 |
The protonation of the glycine carboxylate groups of PCTA-(gly)3 at pH values lower than 4.5 leads to the formation of mono-, di- and triprotonated complex species in the case of Cu(II), Zn(II) and LnIII. Furthermore, a comparison of the protonation constants of the carboxylates in the free ligand to those in its complexes shows that these do not play a significant role in the complexation of the metals. This has also been reported for the DOTA-(gly)4 complexes.[39] Under basic conditions, deprotonation of the two metal bound water molecules results in the formation of of ternary hydroxo complexes (MLH−1 and MLH−2). Similar species (MLH−1) have been reported for DOTA tetraamide complexes as well.[41–43] Formation of more than one ternary hydroxo complexes under mildly basic conditions also point to the existence of complex species with hydration number higher than one in solution.
Formation kinetics
Lanthanide complexes used for medical diagnoses must be both stable and kinetically inert since both products of dissociation, the free metal ion and the ligand, can be toxic. The former may interact with oxygen and nitrogen donor atoms found in several biomolecules present in the body,[4] possibly interfering with important enzymatic processes, while the latter may sequester biological relevant metal ions such as Zn(II), Ca(II), and Cu(II), as evidenced by the still significantly high stability constants of the complexes of these metals with DOTA (Table 4). Hence, it is of importance to study and characterize the dissociation kinetics of these complexes in order to evaluate their potential for imaging applications. Furthermore, knowledge on their rates of formation as well as the intermediates involved provides insights on the optimum conditions required for the complexation of the lanthanide ion by the ligand.
Table 4.
Stability constants for the metal complexes formed with DOTA and DOTA-(gly)4 (1.0 M KCl and 25 °C)
| Metal (M) | DOTA-(gly)4[39] | DOTA | ||||||||
|---|---|---|---|---|---|---|---|---|---|---|
| ML | MLH | MLH2 | MLH3 | MLH4 | M2L | MLH−1 | ML | MLH | MLH−1 | |
| Mg2+ | 4.34 | - | - | - | - | - | - | 11.92[44] | 4.09[44] | - |
| Ca2+ | 10.39 | 4.23 | 3.98 | 3.96 | 3.00 | - | - | 17.23[44] | 3.54[44] | - |
| Cu2+ | 13.39 | 4.38 | 3.35 | 3.46 | - | - | 9.18 | 22.25[45] | 3.78[45] | - |
| Zn2+ | 12.97 (2) | 4.16 (2) | 3.70 (2) | 3.00 (2) | - | - | 9.49 (6) | 21.10[45] | 4.18[45] | - |
| CeIII | 13.02 | 3.38 | 3.09 | 2.38 | 1.90 | - | - | 23.4[46] | - | - |
| NdIII | 14.55 | 3.27 | 3.02 | 2.29 | 1.70 | - | - | 23.0[46] | - | - |
| EuIII | 14.84 | 3.45 | 2.96 | 2.40 | 1.90 | - | - | 23.5[46] | - | - |
| TbIII | 14.54 | 3.38 | 2.87 | 2.40 | - | - | - | 24.7[46] | - | - |
| YbIII | 14.25 | 3.07 | 3.05 | - | - | - | - | 25.0[46] | - | - |
The rates of LnPCTA-(gly)3 complex formation were studied in the pH range of 4.19 to 5.54where the ligand is present mostly in its monoprotonated (HL) and diprotonated (H2L) form. The experimental data indicate that complex formation is a first-order process in the presence of a large excess of LnIII (equation 1).
| (1) |
Plots of the pseudo-first order rate constant kobs against the LnIII concentration gave saturation curves indicating rapid formation of a protonated intermediate, which slowly rearranges to the final product. This behaviour has been observed in other kinetic studies involving lanthanide complexes of PCTA, nitrobenzyl-PCTA and DOTA.[19, 38, 39] The kinetic data were fitted to equation 2 as published before for LnPCTA complexes, where kobs is the observed rate constant, [L] is the ligand concentration, kr is the rate constant of the rearrangement from the intermediate to the product, KH is the conditional stability constant for the protonated intermediate, and [LnIII] is the lanthanide ion concentration.
| (2) |
The kr values obtained this way were found to be proportional to the [OH−] concentration, as illustrated for three lanthanide complexes in Figure 5 (the kobs pseudo-first order rate constants and kr rate constants obtained at different pH values are given in Table S2–S8 in the Supporting Information). This result is expected since the rate determining step in the formation of the complex is the deprotonation of the intermediate, followed by a rapid structural rearrangement of the complex to the final product. This is consistent with a general base catalysis mechanism and therefore, kr in equation 2 can be expressed in terms of the relative contributions from each base in solution, (equation 3):
| (3) |
where kH2O and kOH are rate constants characterizing the deprotonation involving a water molecule (or other base) and OH− ion catalyzed deprotonation of the intermediate, respectively. However, the contribution of the pathway characterized by kH2O is usually negligibly small in comparision to kOH, (this appears to be the case for PCTA-(gly)3 as the plots of kH2O vales obtained are several orders of magnitude smaller than the kOH values, namely 2.1×10⁻² s−1, 1.1×10⁻² s−1 and 1.0×10⁻² s−1 for the Ce, Eu and Yb complexes, respectively). As a result, the kOH values can be used to compare the formation kinetics of DOTA, PCTA and similar complexes.
Figure 5.
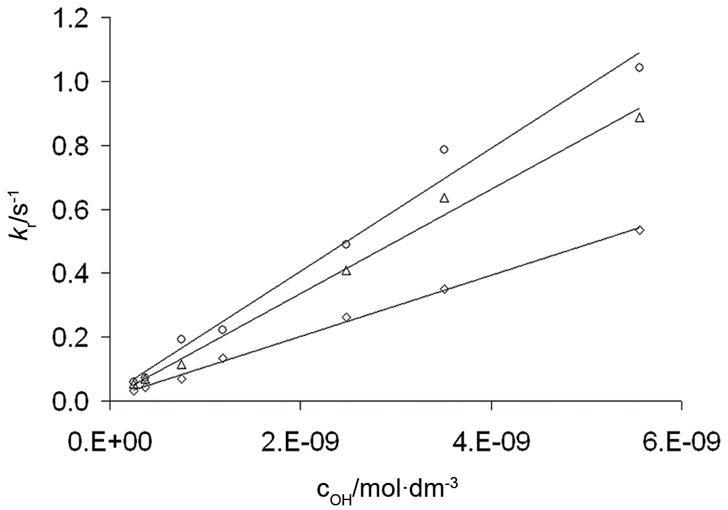
Rates of formation of lanthanide ion complexes with PCTA-(gly)3. Data are shown for CeIII (○), EuIII (△) and YbIII (◇).
The rate constants (kOH) of the LnPCTA-(gly)3 complexes are at least one order of magnitude higher than those of their DOTA analogues (Table 5). This is not unexpected because similar differences were observed for PCTA and DOTA and attributed to the higher preorganization of the pyclen macrocycle.
Table 5.
Rate constants (kOH) of the Ln-PCTA-(gly)3 complexes.
| M | PCTA-(gly)3(a) | PCTA[19] | DOTA-(gly)4[39] | DOTA[47] |
|---|---|---|---|---|
| Ce | (1.92±0.12)×108 | 9.68×10⁷ | 4.6×10⁶ | 3.5×10⁶ |
| Eu | (1.63±0.14)×108 | 1.74×10⁸ | 6.6×10⁶ | 1.1×10⁷ |
| Yb | (9.60±0.14)×108 | 1.11×10⁹ | - | 4.1×10⁷ |
kH2O values: (2.0±0.3)×10−2 s−1 (CeIII), (1.1±0.1)×10−2 s−1 (EuIII), and (1.0±0.1)×10−2 s−1 (YbIII)
Preorganization is defined as the free ligand having a conformation in solution that is similar to that in the final complex, which should result in faster complex formation and enhanced complex stability. This phenomenon has been the subject of considerable research in the past by other groups.[48, 49]
Dissociation kinetics
It has been reported that the dissociation of DOTA and DOTA-type complexes takes place predominantly via an acid catalyzed pathway.[50–55] Hence, dissociation of the LnPCTA-(gly)3 complexes was studied under acidic conditions where the acid concentration ranged from 0.2–3.0 M. Under these conditions, the complexes are thermodynamically unstable and dissociation of the complexes can be described as follows,
| (4) |
The observed dissociation rate constants (kobs) were plotted against acid concentration for the Ce-, Eu- and YbPCTA-(gly)3 complexes. In this pH range, a linear dependence of kobs on acid concentration was observed for CePCTA-(gly)3, while the Eu- and YbPCTA-(gly)3 complexes exhibited saturation behavior (Figure 6). This kinetic behaviour is quite similar to the that reported for the LnPCTA chelates and indicative of rapid formation of a protonated intermediate.[19, 56] In both instances, kobs can be expressed as equation 5;[47] however, if the protonation constant K1 of the intermediate is relatively low, such that K1[H+]≪1, then equation 5 reduces to the linear expression given by equation 6.
Figure 6.
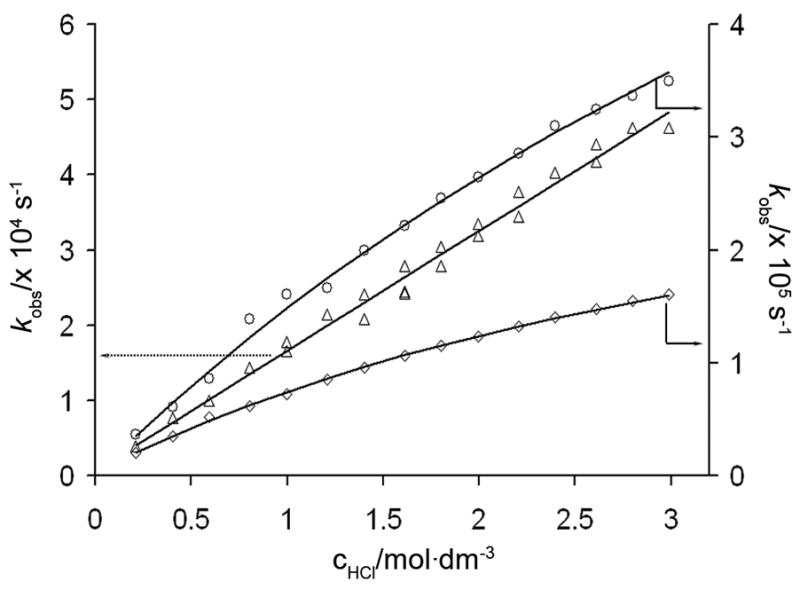
Pseudo-first-order rate constants of acid catalyzed dissociation of Ln-PCTA-(gly)3 complexes of EuIII (○), CeIII (△), and YbIII (◇). The kobs rate constants measured at different pH values are given in Table S9 in the Supporting Information.
| (5) |
| (6) |
Here, k0 corresponds to the acid independent spontaneous dissociation (this process is normally negligible) while k1 and k1′ characterize the acid assisted dissociation of the monoprotonated complexes.
Experimentally, the protonation constant (K1) of the intermediate cannot be accurately determined for CePCTA-(gly)3 from equation 6. Hence, the dissociation half-lives in 2.5 M acid solution were calculated from the kinetic data to compare the kinetic inertness of these ligands [47] (Table 6). As evidenced by these data, the LnPCTA-(gly)3 are surprisingly quite kinetically inert. The long dissociation half-lives of the LnPCTA-(gly)3 and LnDOTA-(gly)4 complexes compared to the parent acetate forms of these macrocycles can be attributed to the lower basicity of the macrocyclics amines in the amides (Table 2) since the rate-determining step for the dissociation of these complexes is the protonation of one of these nitrogens [52, 57]. Interestingly, the half-time for dissociation of EuPCTA-(gly)3 is at least twice as slow as GdDOTA, which is widely used in Europe for clinical MRI applications under the brand name of Dotarem®.
Table 6.
Half-time (t1/2 in hours) of dissociation reactions in 2.5 M acid.
Relaxivity
The longitudinal water proton relaxivity r1 is defined as the slope of the concentration dependence of the observed relaxation rate of water protons (R1obs) in a solution of the paramagnetic metal complex [17]:
| (7) |
where [M] is the concentration of the paramagnetic species in solution and R1d represents the relaxation rate of water protons in the presence of a solution of a related diamagnetic analogue and it may be assumed to be equal to the relaxation rate of pure water (i.e. 0.38 s−1 at 25°C). At each frequency the relaxivity of the paramagnetic complex r1 may be considered as the sum of three contributions:
| (8) |
where r1is arises from the exchange of water molecule(s) in the inner coordination sphere, r1os deals with the contribution from water molecules which diffuse in the proximity of the paramagnetic complex and r1ss is the contribution from water molecules in the second coordination sphere.[58, 59]
The relaxivity (r1) of GdPCTA-(gly)3 at 20 MHz, pH 7 and 25°C was 9.9 mM−1s−1, surprisingly high even for a typical q=2 complex. The temperature and pH dependence of r1 (Figure 7) was further studied to gain more insights. In the temperature range of 275–343 K, the relaxivity of GdPCTA-(gly)3 decreases exponentially with increasing temperature, in agreement with fast water exchange systems such as GdPCTA and GdDOTA.[21, 28] The r1 relaxivity of GdPCTA-(gly)3 remains relatively constant between pH 2–8 but then drops dramatically at higher pH values. This decrease in relaxivity can be attributed to the substitution of water molecules in the coordination sphere by hydroxyl groups,[28] an observation consistent with the equilibrium studies where ternary hydroxo complexes were detected in solution at higher pH values.
Figure 7.
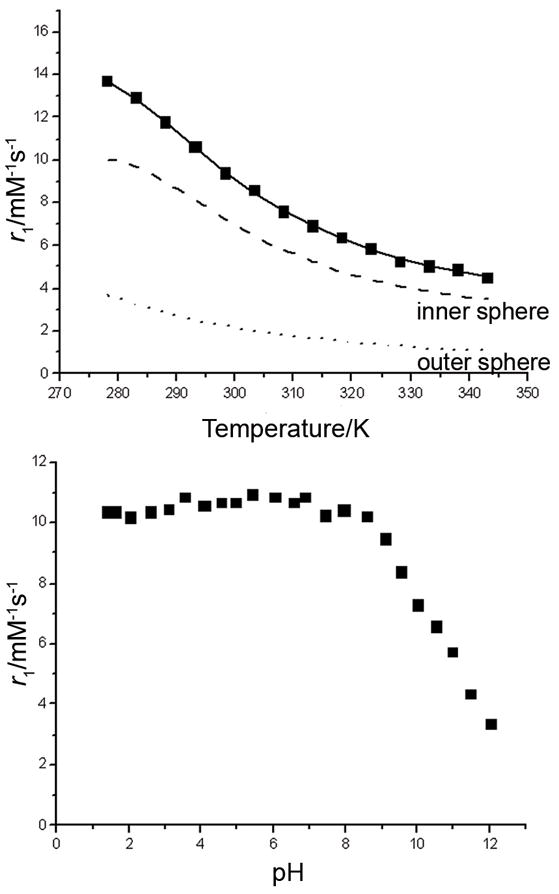
Temperature (top) and pH (bottom) dependence of the relaxivity of GdPCTA-(gly)3. (pH=7 for the temperature dependence; 25 °C for the pH dependence; [GdL]=1 mM, 20 MHz
The r1 relaxivity of [GdPCTA-(ampOBu)3]2 dimer, 24.6 mM−1s−1 (r1/[Gd]=12.3 s−1) at pH 7, 25°C is also unusually high, significantly higher than the r1 of GdPCTA under these same conditions, 5.1 to 6.9 mM−1s−1.[17, 28] The design of LnDOTA-tetraamides as PARACEST agents is based on the idea that the amide bonds can effectively slow the water exchange into a range where the condition Δω>kex is satisfied for CEST, where Δω is the frequency difference between the two exchangeable pools and kex is the rate constant of the exchange. This in turn results in relaxivities for their Gd-complexes that are much lower than those expected for q = 1 complexes, as exemplified by the r1 values of GdDOTAM and GdDTMA (2.5 mM−1s−1) and GdDOTA-(gly)4 (2.1 mM−1s−1).[39, 60] It has been suggested that amide donors increase the residual charge on the metal center (resulting in stronger Ln-OH2 bonds) and/or by participating in extended hydrogen-bonding networks with water molecules.[61] For GdDOTA and GdDOTA-(ampOBu)4 (Figure 1), two complexes with similar structural features, the relaxivities at physiological pH are only 4.2 mM−1 s−1 and 6.0 mM−1 s−1, respectively. Hence, the marked increase in relaxivity for complexes under study cannot be explained alone in terms of the number of coordinated water molecule(s), the elongation of the molecular reorientational time or the polarity of the pendant arms. Perhaps a more appropriate explanation might take into consideration the second coordination sphere effects such as those observed for GdDOTP (Figure 1), a q = 0 complex with a relaxivity of 4.0 mM−1s−1.[62] In general, the outer sphere contribution to the relaxivity of most gadolinium complexes is on the order of 2.0 mM−1s−1. However, in the case of GdPCTA-(ampOBu)3, it is conceivable that the marked increase in r1 observed for this complex is the result not only of the shortening of the T1 of the water molecule(s) directly bound to their metal centers (r1is), but also of an enhanced dipolar coupling between the metal ion and water molecules in the outer and second coordination sphere, resulting in a greater than expected contribution from r1os and r1ss to the relaxivity.
To further understand these observations, the water exchange dynamics of these complexes were studied by variable temperature 17O NMR measurements. The profile of the temperature dependence of the water 17O NMR transverse relaxation rate for GdPCTA-(gly)3 and [GdPCTA-(ampOBu)3]2 dimer (Figure 8) is similar to that reported previously for GdDO3A.[17] The maximum of the curve for GdPCTA-(gly)3 is observed at almost the same temperature as for GdDO3A while the maximum for [GdPCTA-(ampOBu)3]2 is shifted to a slightly higher temperature, indicative of somewhat slower water exchange. By adopting a standard value of −3.8×10⁻⁸ rad s−1 for the hyperfine coupling constant A/ħ and assuming that the Gd-O distance of the inner-sphere water molecule is 2.5 Å, a good fit of the data is obtained with the parameters shown in Table 7. (Figure 8)[17]. The water residence lifetimes were 159 and 329 ns for GdPCTA-(gly)3 and [GdPCTA-(ampOBu)3]2 dimer, respectively. These values are similar in magnitude to the value reported for GdDO3A (160 ns) and about two orders of magnitude smaller than the value reported for GdDOTA (18 μs for the SAP isomer) [63]. Interestingly, the bound water lifetimes for the two amide ligands examined here are longer than that for GdPCTA (71 ns),[17] indicating that the amide groups do indeed slow water exchange compared to acetate type complexes.
Figure 8.
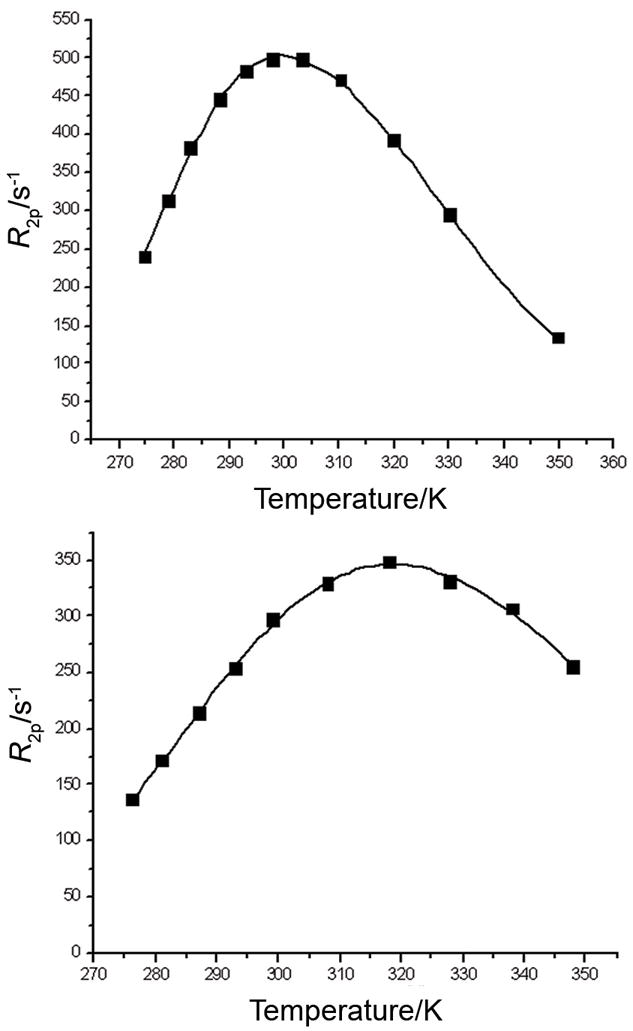
Temperature dependence of the water 17O transverse relaxation rate for Gd-PCTA(gly)3 (top) and for [GdPCTA-(ampOBu)3]2 dimer (bottom) at 500 MHz (pH=7, [GdL]=6.35 mM)
Table 7.
Relaxation parameters calculated from the simultaneous fitting of the temperature dependence of the water 17O transversal relaxation rate and the NMRD profile of GdPCTA-(gly)3 and [GdPCTA-(ampOBu)3]2 at pH 7.
| Parameter | GdPCTA-(gly)3 | [GdPCTA-(ampOBu)3]2 |
|---|---|---|
| r1298 (mM−1s−1) (20 MHz) | 9.9 | 24.4 |
| q | 3 | 2 |
| Δ2 (s−2×10¹⁹) | 4.06±0.45 | 2.34±1.21 |
| τv298 (ps) | 17.2±1.1 | 22.0±0.7 |
| τM298 (ns) | 159±4 | 329±19 |
| τR298 (ps) | 98±2 | 332±10 |
| ΔHM (kJ·mol−1) | 53.2±0.8 | 39.8±2.1 |
| ΔHV (kJ·mol−1) | 18.9±3.5 | 3.8±1.4 |
| nsf (H2O) | 0 | 9±1 |
Even with slower water molecule exchange, the relaxivites of GdPCTA-(gly)3 and [GdPCTA-(ampOBu)3]2 are both higher than that of GdPCTA so outer and second sphere effects must play a significant role in water proton relaxation in these systems. The relatively short water residence lifetimes, in particular for GdPCTA-(gly)3, along with the luminescence data indicating the possible presence of a q=3 species for EuPCTA-(gly)3, suggests that the water exchange in these complexes may occur by an associative mechanism. We also studied the proton nuclear magnetic relaxation dispersion (NMRD) profiles of both complexes at 25 °C and pH 7 (Figure 9). Gadolinium complexes are good relaxation agents as a result of long electron spin relaxation time (T1e) and large magnetic moment of the GdIII ion. For metal complexes with such long T1e values, modulation of their rotational correlation time (τR) is the most important factor in determining the relaxivity.[6, 64] By studying the magnetic field dependence of the longitudinal relaxation rates of these complexes it is possible to determine, among other parameters, their τR. During the fittings, the standard values of the outer-sphere relaxation parameters a and D (3.8 Å and 2.24×10⁻⁵ cm2 s−1 respectively) were used. In the calculations of the second-sphere relaxation, a value of 1×10⁻¹⁰ s and 4 Å were adopted for the generic correlation time τss of the motion of the second-coordination sphere water molecules and for the average distance of the second-sphere water molecules from the paramagnetic center, respectively.).[58, 59]
Figure 9.
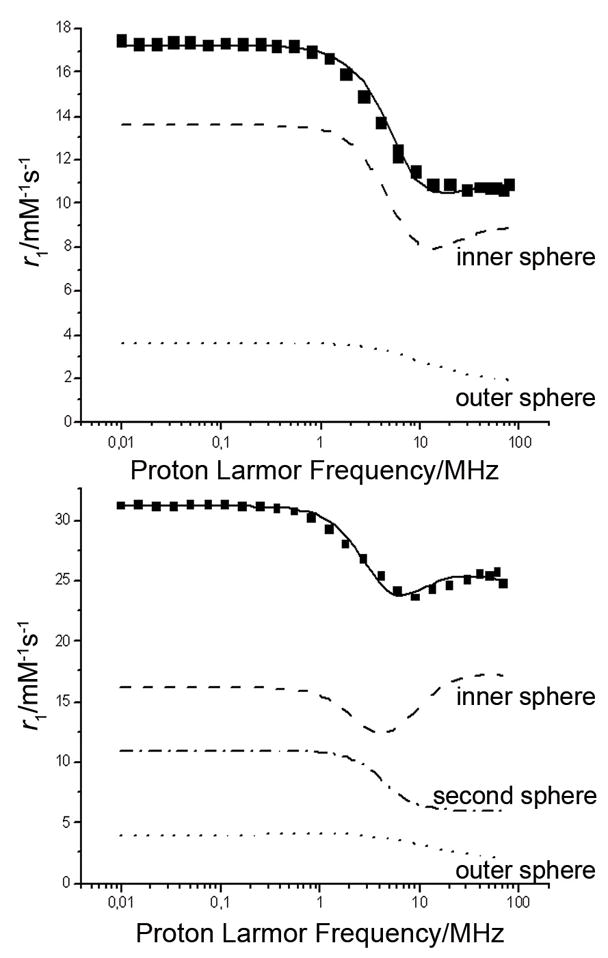
NMRD profile for 1 mM GdPCTA-(gly)3 (top) and [GdPCTA-(ampOBu)3]2 dimer (bottom) at 25 °C (pH=7, [GdL]=1 mM) The solid curves represents the profile calculated with the parameters (Table 7.) obtained by a best fitting procedure of the paramagnetic relaxation.
The NMRD profile of GdPCTA-(gly)3 and [GdPCTA-(ampOBu)3]2 is quite similar to that of GdDO3A and GdPCTA except the former two complexes have higher relaxivity over the entire frequency range.[17] GdPCTA-(gly)3 shows a single dispersion centered near 4 MHz and two plateaus in the low and high magnetic field regions. Inthe case of [GdPCTA-(ampOBu)3]2 a second dispersion is found at higher fields, possibly reflecting an increase in the rotational correlation time, τR.[6] This provides further evidence for the dimerization in solution. A fitting of the NMRD data provided an estimate of the rotational correlation times for these new complexes (Table 7). Both chelates have slower tumbling rates, as evidenced by their higher τR values, than the corresponding reported values for GdDOTA (56 ps) and GdPCTA (70 ps).[6] For low molecular weight complexes such as these, one would anticipate a linear relationship between the rotational correlation times and the molecular weights of the complexes, with τR of GdDOTA≈GdPCTA<GdPCTA-(gly)3<[GdPCTA-(ampOBu)3]2. In the latter complex, the rotational correlation time is further increased due to the formation of the dimer.
The contribution of the water molecules in the inner-, outer and second-coordination sphere of the GdIII-complexes to the relaxivity can be estimated from the fitting of the NMRD profile (Figure 9). The outer- and second-sphere relaxivities are related to the association and organization of the water molecules in the vicinity of the paramagnetic chelate. One may anticipate that the polar glycinate and mono-butyl phosphonate moieties are capable of participating in strong interactions with the water molecules on the surface of the complex, which should increase the residence time of the water molecules in the proximity of the paramagnetic center. The NMRD profile of the GdPCTA-(gly)3 could reliably be fitted by a model which took into account the outer sphere effects giving an outer-sphere relaxivity (r1os) of about 2 mM−1s−1 (25°C, 20 MHz). This is in a good agreement with the r1 relaxivity value of GdDOTA-(Gly)4 (2.1 mM−1s−1, 25°C, 20 MHz) which is dominated by the outer-sphere relaxation. These findings suggest that the presence of the glycinate pendant arm results in a strong contribution of the outer-sphere relaxivity because of the formation of hydrogen bonds with the water molecules located near the paramagnetic center. In case of the [GdPCTA-(ampOBu)3]2, we were able to determine the second sphere contribution from the fitting of the NMRD profile. The presence of about 8–9 second sphere water molecules (ca. 4 water molecule/GdIII) located at an average distance of 4 Å from the paramagnetic center was estimated and a value of about 7 mM−1s−1 (3.5/GdIII s−1) at 25°C and 20 MHz was obtained for the second sphere relaxivity r1ss. This result is not surprising since the negatively charged phosphonate groups can also participate in multiple hydrogen-bonding interactions with water molecules in the second-coordination sphere. Similar phenomenon has been observed in the case of the phosphonate derivatives of GdDOTA.[59] The theoretical background of the calculations used to access relaxation parameters is available in Supporting Information.
PARACEST and NMR spectroscopy
CEST spectra were collected on concentrated (30 mM) samples of EuPCTA-(gly)3 and EuPCTA-(ampOBu)3. Although substantial CEST effects are seen for most EuDOTA-tetraamide complexes even at concentrations well below 30 mM, no water exchange peak was observed for either of these complexes. Given the water exchange rates measured for these complexes by 17O NMR (Table 6), this was not a surprising result. Nevertheless, CEST from water can be detected in some EuDOTA-tetraamide complexes having water exchange lifetimes on the order of 20–30 μs[65] so the water lifetimes measured here for EuPCTA-(gly)3 and EuPCTA-(ampOBu)3 are about 50–100-fold too short for CEST observation. Hence, it may be possible to slow water exchange in these systems by placing them in the different solvent or by binding them to biological receptors to slow water exchange by this amount.
A comparison of the high resolution 1H NMR spectra of EuPCTA-(gly)3 (Figure S2) with that of EuDOTA-(gly)4 (SAP isomer) (Figure S3) shows that the lanthanide induced shifts observed in the ligand protons of EuPCTA-(gly)3 are substantially smaller. For example, one of the macrocyclic backbone protons (H4), commonly the most highly shifted proton in the EuDOTA-tetraamide complexes, can be found at 8 ppm in EuPCTA-(gly)3 (spectra not shown). Given the known relationship between the chemical shift of the H4 proton and the bound water molecules in the LnDOTA-tetraamide complexes (the hyperfine shift of LnIII-bound water is typically twice that of the H4 protons)[66], one can estimate that the bound water signal in EuPCTA-(gly)3, if slow enough to observe, would be expected to be seen around 18–20 ppm. However, a bound water signal could not be detected in any of the LnIII complexes of PCTA-(gly)3, even at low temperatures. These combined results are consistent with the general conclusion that water exchange is too fast in all LnPCTA-(gly)3 complexes to satisfy the CEST requirement, Δω>kex. The one complex examined here could potentially become an exception to this rule. The luminescence results for EuPCTA-(ampOBu)3 showed that this complex exists predominantly as a dimer above 10 mM with only a single EuIII-bound water molecule. Since water exchange should be slower in q=1 complexes such as this, it probably represents the best-case scenario for detecting CEST effect and observing the metal bound water. The absence of a bound-water signal in these NMR spectra along with the fast water exchange rate of the gadolinium complex of PCTA-(gly)3 and 14 strongly suggest the general conclusion that the water exchange rates in Ln-PCTA amide complexes are too fast to satisfy the Δω>kex requirement.
Conclusion
Two new tris-amide derivatives of PCTA were prepared and their complexes with lanthanides examined as potential contrast agents for imaging applications. The gadolinium complexes displayed surprising high water protons r1 relaxivities, consistent with rapid water exchange plus a large outer-sphere contribution. The LnPCTA-(gly)3 complexes also displayed a surprising high kinetic inertness which may allow them to be considered for in vivo use as T1 contrast agents. Furthermore, the intense luminescence observed for the europium and terbium complexes of PCTA-(gly)3 and PCTA-(ampOBu)3 may be useful for certain optical imaging applications. Luminescence data for the EuIII and TbIII complexes of PCTA-(ampOBu)3 indicate that these complexes exist in dilute solution (low μM) as a q = 2 species, but undergo dimerization at higher concentrations (mM). The lack of a PARACEST effect for either the europium complex of PCTA-(gly)3 or PCTA-(ampOBu)3 indicates that the rules governing the design of PARACEST agents derived from the LnDOTA-tetraamide complexes do not apply to the PCTA analogues.
Experimental Section
General remarks
All reagents and solvents were purchased from commercially available sources and used as received. 1H and 13C spectra were recorded with a Varian 400 spectrometer operating at 400 and 100 MHz, respectively The chemical shift values are reported relative to TMS. Elemental analyses were performed by Galbraith Laboratories, Inc. (Knoxville, TN). 3,6,9,15-tetraazabicyclo[9.3.1]pentadeca-1(15),11,13-triene (pyclen) was synthesized according to a published procedure.[67] The synthesis of dibutyl aminomethylphosphonate (12) was accomplished according to procedures published elsewhere.[22] The syntheses of PCTA and its derivatives and their complexes with lanthanide ions have been previously reported in detail in the literature.[20, 68]
Synthesis of the ligands and complexes
Detailed synthetic procedures are given in the Supporting Information.
pH-potentiometric determination of protonation constants
The pH-potentimetric titrations were carried out with a Thermo Orion expandable ion analyzer EA940 pH meter using Metrohm combined electrode 6.0234.100 in a mixing vessel thermostated at 25.0 °C. A Metrohm DOSIMATE 665 autoburette (5 mL capacity) was used for base additions and 1.0 M KCl was used to maintain the ionic strength. All equilibrium measurements (direct titrations) were carried out in 10.00 mL sample volumes with magnetic stirring. During the titrations, samples were kept under argon gas to ensure no CO2 is present. The electrodes were calibrated according to the standard two point calibration procedure with the use of commercially available buffers (0.01 M borax for pH = 9.180 and 0.05 M KH-phthalate for pH = 4.005). The concentrations of H+ ions were calculated from the measured pH values according to the method proposed by Irving et al.[69] The protonation constants of the ligand (log KiH) are defined as:
| (9) |
where i=1, 2, …, 5 and [Hi−1L] and [H+] are the equilibrium concentrations of the ligand (i=1), protonated forms of the ligand (i=2, …, 5) and hydrogen ions, respectively. The thermodynamic stability constants (KML) listed in Tables 3 and 4 were evaluated and reported based on the following equations:
| (10) |
| (11) |
where x=0 and −1 for ternary hydroxo complexes and 2–5 for the protonated complex species.
Formation and dissociation kinetic studies
The rates of complex formation of CePCTA-(gly)3, EuPCTA-(gly)3 and YbPCTA-(gly)3 were studied at 25 °C and 1.0 M KCl ionic strength by the “stopped-flow” method with the use of an Applied Photophysics RX.2000 rapid mixing accessory attached to a Cary 300 Bio UV-Vis spectrophotometer. The formation reactions at low pH (below pH=4.87) were sufficiently slow to be followed by conventional UV-vis spectroscopy. Samples were mixed in semi-micro quartz cells (Starna, optical path length =1 cm) kept in a thermostated multicell holder at 25 °C. The typical concentration of 4 was 0.20 mM and the concentration of the metal ions was varied in the range of 2.0–8.0 mM (10 to 40-fold metal excess). Formation kinetic studies were carried out with the non-coordinating buffer N-methylpiperazine (NMP, log K2H=4.83) at a concentration of 0.05 M in the pH range of 4.19 to 5.54.
Acid catalyzed dissociation kinetics of CePCTA-(gly)3, EuPCTA-(gly)3 and YbPCTA-(gly)3 complexes were performed under pseudo-first-order conditions by mixing the appropriate complexes with a large excess of hydrochloric acid (0.25–3.0 M) while keeping the ionic strength constant at 3.0 M [H++K+]Cl−; typically 16–21 data points were obtained at 25 °C. The reactions were followed in 0.3 mM complex solutions by direct spectrophotometry and the complex concentrations were adjusted so that changes of ~0.7 absorbance units were detected throughout the dissociation reaction. Equation 12 was used to calculate the first-order rate constants (k is kobs for formation and kd for dissociation), where A0, Ae, and At are the absorbance values measured at the start of the reaction (t=0), at equilibrium, and at time t, respectively. The kinetic curves were acquired usually until equilibrium was reached, and to obtain the rate constants, the complete kinetic curves were fitted. However, dissociaton reactions in dilute concentrations of HCl were followed only until 85–90% conversion. The data were fitted to equation 12 with the software Scientist (Micromath) using a standard least-squares procedure.
| (12) |
Luminescence studies
The high-resolution emission spectrum of EuPCTA-(gly)3 and TbPCTA-(gly)3 (using a 450W xenon arc lamp) along with the lifetime measurements (using a 100W pulsed mercury lamp) were recorded on an Edinburgh Instruments Steady State/Lifetime FS900 fluorimeter. The pyridine antenna in these complexes was excited at 281 nm and the emission was monitored at 615 nm for the EuIII complex and at 545 nm for the TbIII complex, at a concentration of 1.0 mM (pH=6.5). Luminescence spectra for the EuIII and TbIII complexes of 7 were recorded on a Perkin-Elmer LS55 instrument (Waltham, MA) exciting the pyridine ring at 284 nm and detecting the emission at 545 nm for TbIII and 594 nm for EuIII. Slit widths were set to 15 nm (excitation) and 5 nm (emission) for emission spectra, and 5 nm (excitation) and 15 nm (emission) for excitation spectra. Lifetimes were measured on the same instrument using the pHlemming software provided by Andrew Beeby at the University of Durham.[70]
Lifetime measurements were fitted to a single exponential decay curve using a least-squares regression (Equation 13),
| (13) |
Where I is the intensity of the signal at time t, I0 is the initial intensity at t=0, t is time in seconds, and τs is the reciprocal lifetime for the excited state in a given solvent.
The number of water molecules coordinated to the metal center, q, was calculated using the Supkowski et al. calibration method (Equation 14).[71]
| (14) |
where A has been determined to be 1.05 (water molecules·ms) and 4.2 (water molecules·ms) for EuIII and TbIII, respectively.
Relaxivity measurements
Water proton relaxation measurements were made using an inversion-recovery pulse sequence (180°–τ–90°). Each data point was the average of 5 scans at 6 different concentrations. Data for the GdPCTA-(gly)3 complex was collected with the use of an MRS-6 NMR analyzer (Institut “Jožef Stefan”, Ljubljana, Slovenia) operating at 20 MHz. The temperature of the sample holder was controlled with a thermostated N2 gas stream. The relaxivity of GdPCTA-(gly)3 was calculated from the linear dependence of the relaxation times plotted against the concentration of the complex and were corrected for the diamagnetic contribution measured in the absence of paramagnetic complex. In the study of the temperature and pH dependence of the relaxation times the concentration of GdPCTA-(gly)3 (with slight ligand excess) was 1.0 mM and the pH of the solutions was set to 6.5. T1 values of GdPCTA-(ampOBu)3 were recorded in a Maran Ultra relaxometer (Oxford Instruments, United Kingdom) at 24 MHz and 25 °C. Relaxivity was determined by the linear regression analysis of the relaxation rates of two sets of five solutions (20–60 μM and 2–6 mM), in 50 mM HEPES buffer and in triplicate.
Z-spectra
CEST spectra of EuPCTA-(gly)3 were recorded in a 6.3 T JEOL Eclipse spectrometer at room temperature. Magnetization transfer profiles for the lanthanide complexes of 14 were measured at room temperature in a 9.4 T Varian spectrometer, using B1 saturation powers ranging from 200 to 900 Hz, with an irradiation time of 3 seconds and a delay time of 10 seconds. For the low temperature experiments, samples were cooled to −30°C using liquid nitrogen. All samples studied ranged in concentration between 20 and 30 mM and were dissolved in mixtures of deuterated acetonitrile and dioxane. Water was added to these samples in 2 μL increments.
Variable temperature 17O NMR measurements
The data were collected on a Bruker DRX 500 NMR (11.7 T) and DRX 600 NMR (14.1 T) spectrometer, equipped with a 10 mm probe and Bruker VT-1000 thermocontroller. NMR data was acquired using a spectral width of 10000 Hz, a 90° pulse of 7 μs, an acquisition time of 10 ms, 1000 scans and no sample spinning. Solutions containing 2.6% of 17O isotope (Yeda, Israel) were used.
Proton 1/T1 NMRD profiles
The measurements were performed over a continuum of magnetic field strengths from 0.00024 to 0.47 T (corresponding to 0.01–20 MHz proton Larmor Frequency) on a Stelar field-cycling relaxometer, under complete computer control with an absolute uncertainty of 1%. Data points from 0.47 T (20 MHz) to 1.7 T (70 MHz) were collected on a Stelar Spinmaster spectrometer working at variable field.
Supplementary Material
Figure 3.
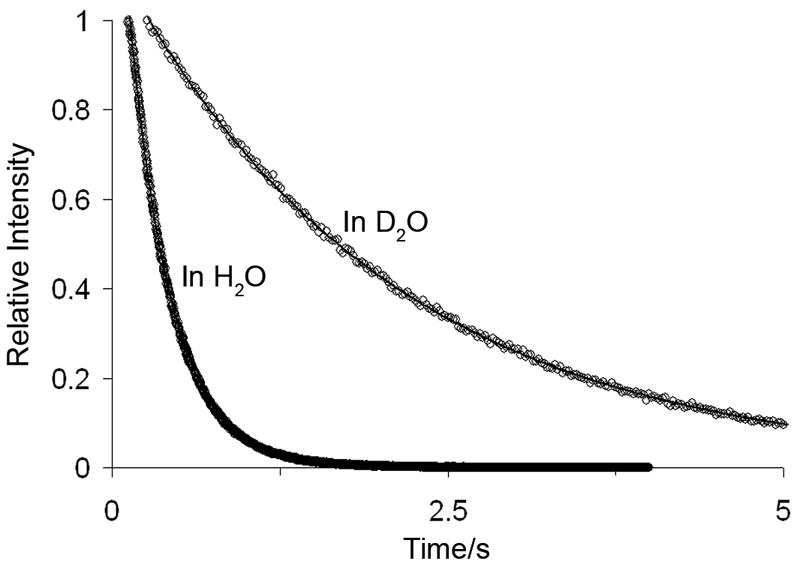
Emission decay profiles for 1 mM EuPCTA-(gly)3 (λEx=281 nm; λEm=615 nm).
Acknowledgments
We wish to thank the NIH (CA-115531, CA-126608, DK-058398, RR-02584 and EB-04582), EU-Integrated Project “Meditrans” NMP4-CT-2006-026668, the EMIL Project funded by the EC FP6 Framework Program (LSCH-2004-503569), Hungarian Science Foundation (OTKA K-69098), COST D-38 Action and the Robert A. Welch Foundation (AT-584) for partial support of this work. We thank Macrocyclics (Dallas, TX) for the access to their high resolution fluorescence spectrometer.
Footnotes
Supporting information for this article is available on the WWW under http://www.chemeurj.org/ or from the author.
References
- 1.Faulkner S, Pope SJA, Burton-Pye BP. Applied Spectroscopy Reviews. 2005;40:1–31. [Google Scholar]
- 2.Leonard JP, Nolan CB, Stomeo F, Gunnlaugsson T. Top Curr Chem. 2007;281:1–43. [Google Scholar]
- 3.Pandya S, Yu J, Parker D. Dalton Transactions. 2006:2757–2766. doi: 10.1039/b514637b. [DOI] [PubMed] [Google Scholar]
- 4.Vidaud C, Pible O, Quemeneur E. Recent Research Developments in Biochemistry. 2002;3:511–525. [Google Scholar]
- 5.Brucher E, Sherry DA. Stability and toxicity of contrast agents. In: Toth E, Merbach Andre E, editors. The Chemistry of Contrast Agents in Medical Magnetic Resonance Imaging. John Wiley and Sons Ltd; Chichester: 2001. pp. 243–279. [Google Scholar]
- 6.Caravan P, Ellison JJ, McMurry TJ, Lauffer RB. Chem Rev. 1999;99:2293–2352. doi: 10.1021/cr980440x. [DOI] [PubMed] [Google Scholar]
- 7.Aime S, Barge A, Botta M, Parker D, De Sousa AS. JACS. 1997;119:4767–4768. [Google Scholar]
- 8.Ward KM, Aletras AH, Balaban RS. Journal of Magnetic Resonance. 2000;143:79–87. doi: 10.1006/jmre.1999.1956. [DOI] [PubMed] [Google Scholar]
- 9.Zhang S, Merritt M, Woessner DE, Lenkinski RE, Sherry AD. Acc Chem Res. 2003;36:783–790. doi: 10.1021/ar020228m. [DOI] [PubMed] [Google Scholar]
- 10.Woods M, Sherry AD. Conf Proc IEEE Eng Med Biol Soc FIELD Full Journal Title:Conference proceedings: … Annual International Conference of the IEEE Engineering in Medicine and Biology Society. IEEE Engineering in Medicine and Biology Society. Conference; 2004. pp. 5254–7. [Google Scholar]
- 11.Aime S, Crich SG, Gianolio E, Giovenzana GB, Tei L, Terreno E. Coord Chem Rev. 2006;250:1562–1579. [Google Scholar]
- 12.Woods M, Woessner DE, Sherry AD. Chem Soc Rev. 2006;35:500–511. doi: 10.1039/b509907m. [DOI] [PMC free article] [PubMed] [Google Scholar]
- 13.Sherry AD, Woods M. Annu Rev Biomed Eng. 2008;10:391–411. doi: 10.1146/annurev.bioeng.9.060906.151929. [DOI] [PMC free article] [PubMed] [Google Scholar]
- 14.Sherry AD, Woods M. Molecular and Cellular MR Imaging. 2007:101–122. 2 plates. [Google Scholar]
- 15.Woods M, Zhang S, Sherry AD. Current Medicinal Chemistry: Immunology, Endocrine & Metabolic Agents. 2004;4:349–369. doi: 10.2174/1568013043357338. [DOI] [PMC free article] [PubMed] [Google Scholar]
- 16.Zhang S, Wu K, Sherry AD. JACS. 2002;124:4226–4227. doi: 10.1021/ja017133k. [DOI] [PubMed] [Google Scholar]
- 17.Aime S, Botta M, Crich SG, Giovenzana G, Pagliarin R, Sisti M, Terreno E. Magn Reson Chem. 1998;36:S200–S208. [Google Scholar]
- 18.Siaugue JM, Segat-Dioury F, Favre-Reguillon A, Wintgens V, Madic C, Foos J, Guy A. Journal of Photochemistry and Photobiology, A: Chemistry. 2003;156:23–29. [Google Scholar]
- 19.Tircso G, Kovacs Z, Sherry AD. Inorg Chem. 2006;45:9269–9280. doi: 10.1021/ic0608750. [DOI] [PMC free article] [PubMed] [Google Scholar]
- 20.Stetter H, Frank W, Mertens R. Tetrahedron. 1981;37:767–72. [Google Scholar]
- 21.Aime S, Botta M, Crich SG, Giovenzana GB, Jommi G, Pagliarin R, Sisti M. Inorg Chem. 1997;36:2992–3000. doi: 10.1021/ic960794b. [DOI] [PubMed] [Google Scholar]
- 22.Christensen BG, Ratcliffe RW. 7-Acylaminocephalosporanales. Merck and Co., Inc; USA: 1975. Application: DE. p. 131 pp Division of Ger Offen 2, 318, 829. [Google Scholar]
- 23.Krawczyk H. Synth Commun. 1997;27:3151–3161. [Google Scholar]
- 24.Karaman R, Goldblum A, Breuer E, Leader H. Journal of the Chemical Society, Perkin Transactions 1: Organic and Bio-Organic Chemistry (1972–1999) 1989:765–74. [Google Scholar]
- 25.Rensing S, Schrader T. Org Lett. 2002;4:2161–4. doi: 10.1021/ol025976q. [DOI] [PubMed] [Google Scholar]
- 26.Horrocks WD, Jr, Albin M. Prog Inorg Chem. 1984;31:1–104. [Google Scholar]
- 27.Bruce JI, Lowe MP, Parker D. Photophysical Aspects of Lanthanide(III) Complexes. In: Merbach AE, Toth E, editors. The Chemistry of Contrast Agents in Medical Magnetic Resonance Imaging. 2001. p. 471. [Google Scholar]
- 28.Kim WD, Kiefer GE, Maton F, McMillan K, Muller RN, Sherry AD. Inorg Chem. 1995;34:2233–43. [Google Scholar]
- 29.Bretonniere Y, Mazzanti M, Pecaut J, Dunand FA, Merbach AE. Inorg Chem. 2001;40:6737–6745. doi: 10.1021/ic010591+. [DOI] [PubMed] [Google Scholar]
- 30.Paschalidis DG. Synth React Inorg Met-Org Chem. 2004;34:1401–1415. [Google Scholar]
- 31.Tripathi SP, Sharma RC, Chaturvedi GK. Journal of the Institution of Chemists (India) 1980;52:203–8. [Google Scholar]
- 32.Buono-Core GE, Li H, Marciniak B. Coord Chem Rev. 1990;99:55–87. [Google Scholar]
- 33.Selvin PR. Annu Rev Biophys Biomol Struct. 2002;31:275–302. doi: 10.1146/annurev.biophys.31.101101.140927. [DOI] [PubMed] [Google Scholar]
- 34.Klimentova J, Vojtisek P. J Mol Struct. 2007;826:82–88. [Google Scholar]
- 35.Desreux JF, Merciny E, Loncin MF. Inorg Chem. 1981;20:987–91. [Google Scholar]
- 36.Harris WR, Motekaitis RJ, Martell AE. Inorg Chem. 1975;14:974–8. [Google Scholar]
- 37.Cui X, Cabral MF, Costa J, Delgado R. Inorg Chim Acta. 2003;356:133–141. [Google Scholar]
- 38.Burai L, Fabian I, Kiraly R, Szilagyi E, Brucher E. Journal of the Chemical Society, Dalton Transactions: Inorganic Chemistry. 1998:243–248. [Google Scholar]
- 39.Baranyai Z, Bruecher E, Ivanyi T, Kiraly R, Lazar I, Zekany L. Helv Chim Acta. 2005;88:604–617. [Google Scholar]
- 40.Delgado R, Quintino S, Teixeira M, Zhang A. Journal of the Chemical Society, Dalton Transactions: Inorganic Chemistry. 1997:55–63. [Google Scholar]
- 41.Alderighi L, Bianchi A, Calabi L, Dapporto P, Giorgi C, Losi P, Paleari L, Paoli P, Rossi P, Valtancoli B, Virtuani M. Eur J Inorg Chem. 1998:1581–1584. [Google Scholar]
- 42.Bianchi A, Calabi L, Giorgi C, Losi P, Mariani P, Paoli P, Rossi P, Valtancoli B, Virtuani M. Dalton. 2000:697–705. [Google Scholar]
- 43.Pasha A, Tircso G, Benyo ET, Brucher E, Sherry AD. Eur J Inorg Chem. 2007:4340–4349. doi: 10.1002/ejic.200700354. [DOI] [PMC free article] [PubMed] [Google Scholar]
- 44.Delgado R, Frausto da Silva JJR. Talanta. 1982;29:815–22. doi: 10.1016/0039-9140(82)80251-8. [DOI] [PubMed] [Google Scholar]
- 45.Chaves S, Delgado R, Frausto da Silva JJR. Talanta. 1992;39:249–54. doi: 10.1016/0039-9140(92)80028-c. [DOI] [PubMed] [Google Scholar]
- 46.Cacheris WP, Nickle SK, Sherry AD. Inorg Chem. 1987;26:958–60. [Google Scholar]
- 47.Toth E, Brucher E, Lazar I, Toth I. Inorg Chem. 1994;33:4070–6. [Google Scholar]
- 48.Hancock RD, Martell AE. Chem Rev. 1989;89:1875–914. [Google Scholar]
- 49.Chang CA, Liu YL, Chen CY, Chou XM. Inorg Chem. 2001;40:3448–3455. doi: 10.1021/ic001325j. [DOI] [PubMed] [Google Scholar]
- 50.Szarvas P, Brucher E. Acta Chimica Academiae Scientiarum Hungaricae. 1966;50:279–86. [Google Scholar]
- 51.Brucher E, Laurenczy G, Makra Z. Inorg Chim Acta. 1987;139:141–2. [Google Scholar]
- 52.Brucher E, Sherry AD. Inorg Chem. 1990;29:1555–9. [Google Scholar]
- 53.Kumar K, Jin T, Wang X, Desreux JF, Tweedle MF. Inorg Chem. 1994;33:3823–9. [Google Scholar]
- 54.Huskens J, Sherry AD. Inorg Chem. 1996;35:5137–5143. [Google Scholar]
- 55.Burai L, Kiraly R, Lazar I, Brucher E. Eur J Inorg Chem. 2001:813–820. [Google Scholar]
- 56.Tircso G, Benyo ET, Suh EH, Jurek P, Kiefer GE, Sherry AD, Kovacs Z. Bioconjug Chem. 2009 doi: 10.1021/bc8004914. [DOI] [PMC free article] [PubMed] [Google Scholar]
- 57.Brucher E, Cortes S, Chavez F, Sherry AD. Inorg Chem. 1991;30:2092–7. [Google Scholar]
- 58.Aime S, Botta M, Crich SG, Giovenzana GB, Pagliarin R, Piccinini M, Sisti M, Terreno E. JBIC, J Biol Inorg Chem. 1997;2:470–479. [Google Scholar]
- 59.Botta M. Eur J Inorg Chem. 2000:399–407. [Google Scholar]
- 60.Aime S, Barge A, Bruce JI, Botta M, Howard JAK, Moloney JM, Parker D, de Sousa AS, Woods M. JACS. 1999;121:5762–5771. [Google Scholar]
- 61.Aime S, Botta M, Fasano M, Paoletti S, Anelli PL, Uggeri F, Virtuani M. Inorg Chem. 1994;33:4707–11. [Google Scholar]
- 62.Aime S, Botta M, Terreno E, Anelli PL, Uggeri F. Magnetic Resonance in Medicine. 1993;30:583–91. doi: 10.1002/mrm.1910300509. [DOI] [PubMed] [Google Scholar]
- 63.Helm L, Merbach AE. Chem Rev. 2005;105:1923–59. doi: 10.1021/cr030726o. [DOI] [PubMed] [Google Scholar]
- 64.Lauffer RB. Chem Rev. 1987;87:901–27. [Google Scholar]
- 65.Terreno E, Castelli DD, Cravotto G, Milone L, Aime S. Invest Radiol. 2004;39:235–43. doi: 10.1097/01.rli.0000116607.26372.d0. [DOI] [PubMed] [Google Scholar]
- 66.Zhang S, Sherry AD. J Solid State Chem. 2003;171:38–43. [Google Scholar]
- 67.Siaugue JM, Segat-Dioury F, Sylvestre I, Favre-Reguillon A, Foos J, Madic C, Guy A. Tetrahedron. 2001;57:4713–4718. [Google Scholar]
- 68.Kiefer GE. Process for the preparation of azamacrocyclic or acyclic aminophosphonate ester derivatives. Dow Chemical Co; USA: 1994. p. 22. Application: WO. [Google Scholar]
- 69.Irving HMNH, Miles MG, Pettit LD. Anal Chim Acta. 1967;38:475–88. [Google Scholar]
- 70.Woods M, Sherry AD. Inorg Chem. 2003;42:4401–4408. doi: 10.1021/ic0300823. [DOI] [PubMed] [Google Scholar]
- 71.Supkowski RM, Horrocks WD., Jr Inorg Chim Acta. 2002;340:44–48. [Google Scholar]
Associated Data
This section collects any data citations, data availability statements, or supplementary materials included in this article.


